Mechanochemistry for the production of a hybrid salt used in the treatment of malaria†
Vânia M.
do Prado
 a,
Thiago B.
de Queiroz
 a,
Paula M.
Sá
 b,
Rafael C.
Seiceira
 c,
Nubia
Boechat
 b and
Fabio F.
Ferreira
 *a
*a
aCenter for Natural and Human Sciences (CCNH), Federal University of ABC (UFABC), Av. dos Estados, 5001, Santo André, SP 09210-580, Brazil. E-mail: fabio.furlan@ufabc.edu.br; Tel: +55 11 4996-8370
bDepartment of Drug Synthesis, Farmanguinhos-Fiocruz, Av. Comandante Guarany, 447, Rio de Janeiro, RJ 22775-903, Brazil
cLaboratory of Solid-State Studies (LEES), Farmanguinhos-Fiocruz, Av. Comandante Guarany, 447, Rio de Janeiro, RJ 22775-903, Brazil
First published on 14th October 2019
Abstract
Mechanochemistry refers to a chemical reaction induced by mechanical energy involving solids. This method provides several advantages over solution-phase synthesis, such as minimizing the need for large volumes of solvents in chemical reactions and greener and more efficient synthetic solutions. In this paper we obtain, via mechanochemistry, a hybrid salt, named MEFAS, derived from two antimalarial molecules – mefloquine and artesunate. We demonstrate, using a simple experimental procedure, how the catalytic amount of liquid present during mechanochemical reactions is decisive to obtain MEFAS. Fourier-transform infrared spectroscopy (FTIR) and nuclear magnetic resonance (NMR) data indicate that liquid-assisted mechanochemical reactions are promising in the formation of the hybrid salt, which is formed via a hydrogen interaction of the carboxylate group of the artesunate molecule with the piperidine group of mefloquine.
Introduction
The search for cleaner and cheaper production processes with safer and more efficient synthetic solutions is part of the challenges faced by the pharmaceutical industry. To overcome these challenges, mechanochemistry has been explored as a way to provide not only sustainable processes employing solvent-free synthesis (or minimal amounts of solvents) but also to obtain materials that are sometimes difficult or even impossible to produce from conventional solution-phase routes. Furthermore, mechanochemistry has emerged as a powerful tool to rapidly and efficiently search for different polymorphic forms and cocrystals as well as for the discovery and development of new drugs.1–3In mechanochemistry, the reactions are induced by mechanical forces. The mechanochemical experiments can be conducted manually – using a mortar and a pestle – or using mixers/electrical mills. They can also be performed on a large scale with the use of industrial ceramic ball mills. During grinding, several breaks occur in the bulk solid reactants, thus reducing their particle sizes. The simplest mechanochemical method is neat grinding, in which two or more bulk solid reactants are ground together, without the addition of a solvent. When a minimal amount of solvent is added to the process, this more versatile method is so called liquid-assisted grinding (LAG).4 The use of catalytic amounts of a liquid phase accelerates the mechanochemical reactions, since it imparts mobility to the reaction's components. With LAG one can induce reactivity in systems that are inactive upon neat grinding, and steer a reaction towards the formation of a particular product. The need for small volumes of solvents allows a strong “Green Chemistry” aspect to mechanochemistry.1,2,5
Despite the challenges posed by sustainable methods, the pharmaceutical industry has other demands, such as search and development of new drugs. Some diseases, like malaria, present the drug-resistance problem. In this particular case, the emergence and potential spread of antimalarial-resistant parasites limited the efficacies of many antimalarial drugs, making the development of new drugs an urgent need.6,7 A recent strategy in the design of antimalarial drugs is related to molecular hybridization. Hybrid molecules have been pointed out as the next-generation antimalarial drugs. Hybrid drugs are defined as chemical entities with two distinct chemical moieties that act on different/same biological targets via different modes of action. Hybrid drugs may improve pharmacological profiles due to the dual mode of action.6,8,9
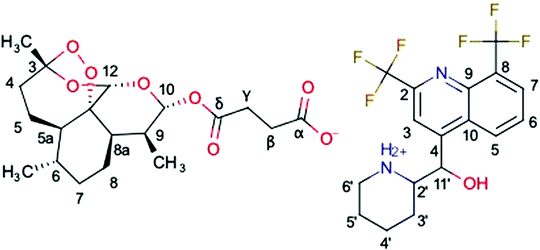
A new hybrid salt derived from two antimalarial molecules, mefloquine and artesunate, named MEFAS (Fig. 1; Marvin 19.15.0, 2019, ChemAxon (http://www.chemaxon.com) was used for drawing the chemical structures), is a promising candidate for treating human malaria.10 This hybrid salt contains two antimalarial functionalities: one quinolinic ring from mefloquine and one endoperoxide ring from artesunate. It has been demonstrated that MEFAS is an active blood schizonticidal drug, being more effective than artesunate and mefloquine alone or in combinations at different mass proportions against P. falciparum in vitro and in mice infected with Plasmodium berghei, promoting cure of this infection.10 Another advantage is that MEFAS is synthesized at a relatively low cost when compared to the former description,11 thus making the drug affordable to populations exposed to drug-resistant P. falciparum malaria in Africa, Southeast Asia, and Latin America.10,11
MEFAS was developed at the Institute of Drug Technology (Farmanguinhos-Fiocruz) and was obtained by a solution-phase synthesis.11 The synthesis routes of most of the hybrid drugs that are currently being studied are based on the solution-phase synthesis, including MEFAS, which uses a considerable volume of solvents. However, mechanochemical synthesis is likely to have a strong impact on future pharmaceutical and medicinal chemistry. Thus, in this paper we present a new way of obtaining MEFAS, based on mechanochemistry. The prepared salts were characterized by X-ray diffraction, infra-red absorption spectroscopy, and solid state nuclear magnetic resonance.
Experimental section
Materials
Powdered samples of the mefloquine base, artesunate, dihydroartemisinin and MEFAS Lotsolution (obtained by a solution-phase synthesis according to the study by Varotti et al.11 and also described in the international patent application 2011/US Pat 8071777B2) were obtained from Farmanguinhos/Fiocruz and used as received. The precursor of the mefloquine base contains approximately 15% mefloquine chloride, as identified by quantitative phase analysis using the Rietveld method (shown below in the Results and Discussion section). Ethyl ether (Sigma-Aldrich, 99%) was employed as the solvent in the LAG experiments because it avoids the degradation of artesunate,12 and it was used without further purification. There were no signs of solvent evaporation after processing.Grinding procedure
The solid-state obtaining of MEFAS was carried out using the mechanochemical methods of liquid-assisted grinding and neat grinding. Artesunate and the mefloquine base were used in the 1![[thin space (1/6-em)]](https://www.rsc.org/images/entities/char_2009.gif) :
:![[thin space (1/6-em)]](https://www.rsc.org/images/entities/char_2009.gif) 1 molar ratio (corresponding to 1.52 g of artesunate and 1.50 g of mefloquine); the total mass of solids was added to a 10 mL steel jar, along with 10 stainless steel grinding balls of 3 mm diameter. While the total mass of solid reactants was kept fixed for each mechanochemical reaction, the amount of liquid added was different (see details below). A total of four reactions were carried out and the only difference between them was the volume variation of ethyl ether.
1 molar ratio (corresponding to 1.52 g of artesunate and 1.50 g of mefloquine); the total mass of solids was added to a 10 mL steel jar, along with 10 stainless steel grinding balls of 3 mm diameter. While the total mass of solid reactants was kept fixed for each mechanochemical reaction, the amount of liquid added was different (see details below). A total of four reactions were carried out and the only difference between them was the volume variation of ethyl ether.
To simplify the description of the mass-to-volume ratio in a LAG experiment an empirical parameter η (eqn (1)) was introduced, where V is the volume of the solvent divided by the sample weight (m). It is important to define that the sample mass represents the combination of all solid reagents at an appropriate stoichiometric ratio:3,13,14
 | (1) |
Thus, the parameter η was varied, in order to investigate its effect on the synthesis. The η values were η = 1 μL mg−1, η = 0.5 μL mg−1, η = 0.1 μL mg−1 and η = 0 μL mg−1 (neat grinding, i.e. solvent-free synthesis). The mixtures were then ground for 5, 10, 15, 20 and 30 minutes in a Retsch MM400 mixer mill at a frequency of 25 Hz, a parameter mild enough to avoid the degradation of the precursors. The milling time did not influence considerably the reactivity of the mechanochemical syntheses. The FTIR spectra do not change as a function of milling time (ESI†). The powder X-ray diffractograms of samples with η = 0, 0.1, 0.5, and 1.0 μL mg−1 are shown in the ESI.† The samples become slightly more amorphous as the milling time increases. We then directed our attention to the samples milled for 15 min. This procedure yielded the deposition of a Brazilian patent (BR 10 2018 010925 1).
Powder X-ray diffraction (PXRD)
Powder X-ray diffraction patterns were collected in transmission geometry, at room temperature (298 ± 2 K) using a STADI-P powder diffractometer (Stoe®, Darmstadt, Germany), with monochromatic CuKα1 radiation selected using a curved Ge(111) crystal, with a tube voltage of 40 kV and a current of 40 mA. The X-ray photons were detected using a silicon-strip detector (Mythen 1 K, from Dectris®). The measurements were performed in the range from 2 to 60° (2θ) in step-scan mode with step sizes of 0.015° (2θ) and a counting time of 600 s (at each 3.15°). The samples were loaded between two cellulose–acetate foils (Ultraphan 0.014 mm thick with a density of 1.3 g cm−3), which were placed in a sample holder that was spun during data collection.The TOPAS-Academic v.5 package was used for Rietveld refinement,15 with the following refinement routine: first, the unit cell parameters were refined. The background was fitted using a 12-term Chebyshev polynomial. The peak asymmetry was adjusted using the simple axial divergence model of Cheary and Coelho.16 The preferred orientation of the crystals was adjusted using 4-term spherical harmonics.17 The isotropic atomic displacements (Biso) were also refined.
Infrared spectroscopy
The attenuated total reflection Fourier transform infrared spectroscopy (ATR-FTIR) spectra were obtained using a Varian - Agilent 640-IR FTIR spectrophotometer, with an ATR accessory using a diamond crystal. The spectral resolution was 4 cm−1 and the spectra were recorded in the range between 650 and 4000 cm−1.Solid state NMR
13C{1H} cross polarization (CP)2 experiments were conducted in a Varian VNMRS 500 MHz spectrometer operating at a resonance frequency of 125.7 (13C) at a magic angle spinning (MAS) frequency of 15 kHz. The CP-MAS experiments were performed, instead of single pulse ones, because they enhance the signal-to-noise ratio in the 13C spectrum. Typical acquisition parameters were a 1H-π/2 pulse length of 3.5 μs and a relaxation delay of 5 s, with a contact time of 1.5 ms. Chemical shifts are reported relative to tetramethylsilane (TMS) at 0 ppm for 13C, using adamantane as the secondary reference with CH2 carbon at 38.5 ppm. The resonance peaks are assigned according to the references indicated below.Differential scanning calorimetry (DSC)
DSC measurements were performed using a Q200 calorimeter from TA Instruments. The thermal behaviour was studied by heating approximately 5.0 mg of the powdered sample at a rate of 10 K min−1 from 297.15 to 473.15 K in a hermetically sealed pan under a nitrogen flow.Results and discussion
Effect of the amount of solvent
We processed four different mass-to-volume ratios, η, (see the definition in the experimental details), in order to evaluate the effect of the amount of solvent for obtaining MEFAS and thus, to define for this synthesis the best parameter. The four η tested values were η = 1 μL mg−1, η = 0.5 μL mg−1, η = 0.1 μL mg−1 and η = 0 μL mg−1 (neat grinding). We carried out solid-state structural characterization aiming to identify the salt without influence of the solvent and to monitor whether the synthesis conditions are sufficiently mild to not cause degradation. As reference samples, we also investigated the mefloquine base, artesunate, MEFAS prepared in the solution-phase,11 and dihydroartemisinin (DHA). DHA is a hydrolyzed product of artesunate (Scheme 1), which is both an in vivo metabolite and an artemisinin derivative therapeutically active against malaria.12 Here it is considered a possible undesired sub-product of artesunate after processing, since our aim is to produce MEFAS.Fig. 2 shows the attenuated total reflection Fourier transform infrared spectroscopy (ATR-FTIR) spectra of mefloquine base, artesunate, MEFAS Lotsolution (obtained by solution-phase synthesis), dihydroartemisinin (DHA) and four products obtained from different η after 15 minutes of milling. The most relevant information on the spectra is the statement of the hybrid salt formation. According to Varotti et al., the formation of the MEFAS hybrid salt is observed due to the absence of the absorption band at 3276 cm−1.11 This band is related to ν(OH) stretching of the carboxyl functional group present in the artesunate molecule. If a proton transfer occurs between artesunate and the mefloquine base, and thus the MEFAS formation, this band will not appear in the FTIR spectrum of MEFAS, since the carboxyl group will donate a proton.
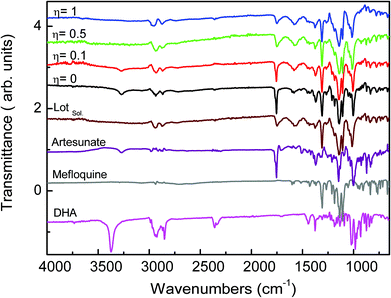 | ||
| Fig. 2 ATR-FTIR spectra of experiments η = 1 μL mg−1, η = 0.5 μL mg−1, η = 0.1 μL mg−1, η = 0 μL mg−1, MEFAS Lotsolution (Lotsol), artesunate, mefloquine and dihydroartemisinin (DHA). | ||
The ATR-FTIR spectrum corresponding to the mechanochemical synthesis η = 0 μL mg−1, i.e. neat grinding, shows the absorption at 3276 cm−1 assigned to ν(OH) stretching of the artesunate moiety. Thus, in the synthesis with η = 0 μL mg−1 there is no change in the O–H bond of the carboxyl functional group, indicating that the hybrid salt is not obtained. The same was observed in the spectrum of the synthesis η = 0.1 μL mg−1, also indicating that in this synthesis the MEFAS was not obtained. Therefore, for these two cases there is only one physical mixture of artesunate and mefloquine base.
In the ATR-FTIR spectra of the experiments η = 0.5 μL mg−1 and η = 1 μL mg−1 the absorption at 3276 cm−1 assigned to ν(OH) stretching could not be noticed; thus, this indicates that in the η = 0.5 μL mg−1 and η = 1 μL mg−1 samples the mefloquine and artesunate interact through a hydrogen bond involving the piperidine ring and carboxyl groups. Therefore, the spectra do not correspond to a simple physical mixture of artesunate and mefloquine, indicating that the MEFAS was obtained.
Another relevant issue is the degradation of artesunate, especially with respect to the degradation of artesunate into DHA during grinding. The band at 3368 cm−1 is assigned to the ν(OH) stretching of the hydroxyl group present in the DHA molecule. The absence of this band, in all the spectra of the mechanochemical reactions, is an indication that degradation of artesunate into DHA during the milling did not occur.18,19
The powder X-ray diffraction patterns of the four η tested values (η = 1 μL mg−1, η = 0.5 μL mg−1, η = 0.1 μL mg−1 and η = 0 μL mg−1) are shown in Fig. 3. The data were used in conjunction with the Rietveld method. The patterns of the attempted MEFAS η = 0 μL mg−1 and η = 0.1 μL mg−1 are similar. First, we performed the Rietveld refinements of the precursors used in the mechanochemical synthesis of MEFAS (artesunate and mefloquine). The Rietveld refinement of artesunate was performed supposing only the crystal structure (orthorhombic P212121), as proposed by Haynes et al.20 Considering that the commercial mefloquine substance is orally administered as the hydrochloride salt, we took into account in the refinements of mefloquine two crystal structures: mefloquine base (monoclinic P2/n), as proposed by Skórska et al.21 and that of mefloquine hydrochloride (triclinic P![[1 with combining macron]](https://www.rsc.org/images/entities/char_0031_0304.gif) ) given by Pitaluga et al.22 The plots from the final Rietveld refinements of the precursors are supplied in the ESI (Fig. S1 and S2†); they indicate good agreement between experimental and calculated data. The Rietveld method was also employed to perform quantitative phase analyses (QPA) of mefloquine. The results indicated 86(3) wt% of mefloquine base and 14(3) wt% of mefloquine hydrochloride.
) given by Pitaluga et al.22 The plots from the final Rietveld refinements of the precursors are supplied in the ESI (Fig. S1 and S2†); they indicate good agreement between experimental and calculated data. The Rietveld method was also employed to perform quantitative phase analyses (QPA) of mefloquine. The results indicated 86(3) wt% of mefloquine base and 14(3) wt% of mefloquine hydrochloride.
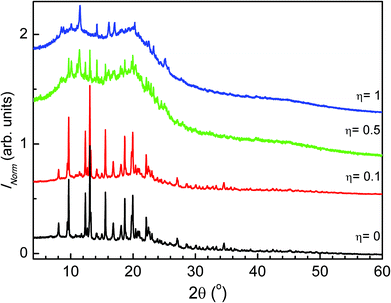 | ||
| Fig. 3 Comparison of the powder X-ray diffraction patterns of experiments η = 1 μL mg−1, η = 0.5 μL mg−1, η = 0.1 μL mg−1 and η = 0 μL mg−1. | ||
The refinements of the attempted MEFAS η = 0 μL mg−1 and η = 0.1 μL mg−1 converged adequately. We obtained a good visual fit of the data as well as good statistical parameters.23 The plots from the final Rietveld refinements of samples η = 0 μL mg−1 and η = 0.1 μL mg−1 are shown in the ESI (Fig. S3 and S4,† respectively). In Tables 1 and 2 we show the crystal details as well as the statistical indexes describing the final Rietveld refinements for samples obtained with experiments η = 0 μL mg−1 and η = 0.1 μL mg−1. With quantitative phase analyses we could unequivocally identify that the samples obtained with experiments η = 0 μL mg−1 and η = 0.1 μL mg−1 consist only of a physical mixture of artesunate, mefloquine base and mefloquine hydrochloride (at lower contents, approximately 15%, already present in the starting material), in agreement with the FTIR data. For the experiment with η = 0 μL mg−1 the mass fraction of the artesunate, mefloquine base and mefloquine hydrochloride phases is respectively 54(3) wt%, 30(3) wt% and 16(3) wt%. For the experiment with η = 0.1 μL mg−1 the QPA result indicated 55(2) wt% of artesunate, 31(3) wt% of mefloquine base and 14(3) wt% of mefloquine hydrochloride.
| Crystal data and structure refinement details (η = 0 μL mg−1) | |
|---|---|
| Artesunate phase | |
| a, b, c (Å) | 9.832(1), 10.505(1), 18.743(1) |
| α, β, γ (°) | 90, 90, 90 |
| Mefloquine phase | |
| a, b, c (Å) | 17.924(2), 8.838(1), 22.113(2) |
| α, β, γ (°) | 90, 95.98(1), 90 |
| Mefloquine hydrochloride phase | |
| a, b, c (Å) | 6.105(4), 17.381(9), 18.241(13) |
| α, β, γ (°) | 89.02(4), 83.59(4), 81.62(4) |
| R wp (%) | 2.42 |
| R exp (%) | 2.00 |
| R Bragg (%) | 0.55 (artesunate) |
| 0.51 (mefloquine) | |
| 0.73 (mefloquine hydrochloride) | |
| χ 2 | 1.21 |
| Crystal data and structure refinement details (η = 0.1 μL mg−1) | |
|---|---|
| Artesunate phase | |
| a, b, c (Å) | 9.839(2), 10.509(1), 18.754(1) |
| α, β, γ (°) | 90, 90, 90 |
| Mefloquine phase | |
| a, b, c (Å) | 17.923(2), 8.842(1), 22.131(3) |
| α, β, γ (°) | 90, 95.98 (1), 90 |
| Mefloquine hydrochloride phase | |
| a, b, c (Å) | 6.091(1), 17.394(4), 18.263(4) |
| α, β, γ (°) | 89.12(2), 83.45(1), 81.48(2) |
| R wp (%) | 2.14 |
| R exp (%) | 1.67 |
| R Bragg (%) | 0.44 (artesunate) |
| 0.53 (mefloquine) | |
| 0.32 (mefloquine hydrochloride) | |
| χ 2 | 1.28 |
For the samples obtained with experimental values η = 0.5 μL mg−1 and η = 1 μL mg−1, the PXRD indicates the presence of amorphous materials with some Bragg peaks (Fig. 3). The absence of peaks in the powder X-ray diffraction patterns related to the artesunate and mefloquine base phases can be taken as an indication of MEFAS formation. However, we could not index the patterns with the observed peaks even for experiments with high counting statistics.
We verified whether the amorphous portion of these samples could originate from the amorphization of the precursors – mefloquine base and artesunate. So, we carried out the milling of the precursors under the same conditions as those for the mechanochemical reaction for the sample obtained with η = 1 μL mg−1. We show in Fig. S5† the powder X-ray diffraction patterns obtained after 15 minutes of liquid-assisted grinding of mefloquine and artesunate. As can be seen, these grinding conditions did not cause amorphization of the precursors. Thus, the amorphous portion of the samples obtained by the liquid-assisted grinding, η = 0.5 μL mg−1 and η = 1 μL mg−1, cannot be attributed to the simple amorphization of the precursors but, most likely, to MEFAS formation.
Since the samples prepared with η = 0.5 μL mg−1 and η = 1 μL mg−1 are mostly amorphous, we employed high-resolution solid-state NMR to characterize the samples, since this technique is well known as a good probe for local sites in amorphous structures. 13C NMR, instead of 1H NMR, has proven itself a much more useful tool for the structural analysis of the attempted MEFAS, due to the strong homonuclear dipolar coupling of the protons, resulting in an intense broadening of the resonance peaks and a possible hindrance of some other lines in the 1H NMR spectra.24 Thus, we focus on the 13C spectra.
Fig. 4 compares the 13C{1H} CP-MAS spectra of the mefloquine base, artesunate, and attempted MEFAS η = 1 μL mg−1. The 13C{1H} CP-MAS NMR spectrum of mefloquine contains the respective assignments,25 indicating the correlation between the peaks and the molecular structure (in Fig. 1). The peak around 20 ppm comes from carbons 3′, 4′, and 5′; the peak around 45 ppm from the carbon 6′, the one around 60 ppm from the 2′ carbon, all in the piperidine unit, and the peak around 70 ppm from the 11′ carbon. The peaks at high frequencies, from 110 ppm on, are related to the aromatic quinoline group. The peak around 110 ppm is related to the carbons 3 and 8, the most intense peak around 130 ppm is attributed to carbons 5, 6, 7 and 9, and the four peaks around 140–160 ppm belong to carbons 4, 2 and 10. The trifluoromethyls *CF3, *CF3-CN (asterisks indicate the observed carbon) are observed at 17 and 9 ppm, and are in overlap with the peaks of the piperidine carbons and a spinning sideband. Interestingly, the region between 140 and 160 ppm is composed of 4 peaks, but Peter Lim assigned only 3 peaks in this range.25 The difference is due to the fact that we measured the mefloquine base in solid state, instead of mefloquine hydrochloride diluted in DMSO. Thus, the additional peak noted here is related to the packing of the aromatics and, most importantly, the differences in electronic density between the cationic and the neutral molecule. Considering the similarity between the sites of carbons 9 and 10, it is possible that the peak attributed to carbon 9 around 130 ppm shifted to a higher frequency, appearing as one of the peaks between 140 and 160 ppm.
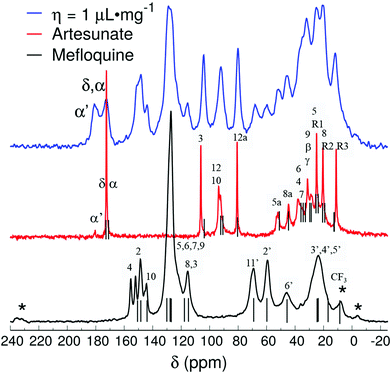 | ||
| Fig. 4 13C{1H} CP-MAS spectra of attempted MEFAS η = 1 μL mg−1, mefloquine (chemical shifts according to Peter Lim25 – gray bars) and artesunate (assignments based on the work of Presser et al. on artesunate26 – gray bars). Asterisks indicate spinning sidebands. | ||
In the 13C{1H} CP-MAS of artesunate the assignments were based on the work of Presser et al.26 As remarking points, the resonances of carbons 10 and 12 overlap around 93 ppm, due to their similarity as chemical sites, as well as carbons α and δ resonate at 172.5 ppm.26 The overlap of resonances belonging to carbons 10 and 12 is a typical signature of the most stable α epimer of artesunate in its preserved form,20 since the decomposition of artesunate in artemisinin or the β epimer dihydroartemisinin (DHA), more stable in solid state,20 would result in a shift of the resonance peak of carbon 10 to 172 ppm in the first case,27 or a splitting of the peaks around 93 ppm in two peaks around 96.4–94.6 and 91.2–87.7 ppm in the second case.28 In addition, a small peak at 180 ppm indicates the presence of a contaminant, or, more precisely, a variation of the artesunate as, most probably, an artesunate salt, in which carbon α now exhibits hydrogen bond interactions29 (indicated as α′).29 The aspects of the artesunate 13C spectrum with respect to the carboxylic group are discussed in more detail in the discussion of the results of the attempted MEFAS.
After elucidating the spectra of precursors, the interpretation of the spectra of the sample, η = 0.5 μL mg−1 and η = 1 μL mg−1 is much simpler. The 13C NMR spectrum of η = 1 μL mg−1 shows slightly lower resolution than that of its precursors. Yet, its peaks are a direct combination of them, except that the peak attributed to the carbon α′ at 180 ppm gains intensity in comparison with the peak attributed to α and δ at 172.5 ppm. The preservation of the peaks belonging to carbons at positions 10 and 12 indicates that the α-artesunate was preserved after ball milling, and the peak at 180 ppm indicates a hydrogen bridge of the carboxylate group of the artesunate with the piperidine or pyridine group of the mefloquine.20,26,29 Clawson et al.29 have identified the δiso shift in the carboxylic group from 175 ppm to higher frequencies as a consequence of its deprotonation, i.e., a higher ionic character of the hydrogen bond. They relate the δiso at 175–178 ppm to a yet protonated carboxylic acid and the δiso at 180–182 ppm to a hydrogen bond of acid–base character. This feature evidences that the MEFAS with η = 1 μL mg−1 was obtained as a complex with an ionic character. The same conclusions can be drawn from the 13C{1H} CP-MAS spectrum of the MEFAS Lotsolution (obtained under conditions of solution synthesis), supplied in the ESI (Fig. S6†).
The spectrum of the η = 0.5 μL mg−1 sample (Fig. 5) is relatively similar to the ones of η = 1 μL mg−1 and Lotsolution, except that the region around 180 ppm shows a broad band that extends to higher frequencies (up to 185 ppm). The peaks at higher frequencies (>180 ppm) indicate the presence of fully ionized forms of the carboxylic group in the artesunate, thus, demonstrating that MEFAS as an ionic complex was, at least, not 100% formed (with some α-artesunate only ionized but not necessarily forming the MEFAS salt). Furthermore, the absence of the splitting of the peak around 92 ppm indicates that the α-artesunate preserves its form as shown in ref. 20, 26 and 29.
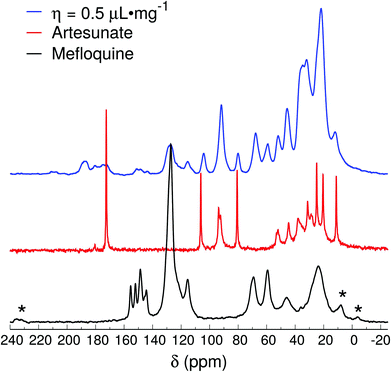 | ||
| Fig. 5 13C{1H} CP-MAS spectra of mefloquine, artesunate, and attempted MEFAS η = 0.5 μL mg−1. Asterisks indicate spinning sidebands. | ||
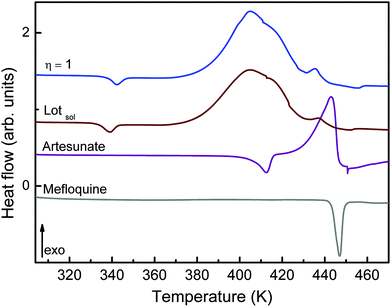
The intermolecular interactions when MEFAS is formed also influence its thermodynamical features. The DSC curve of MEFAS (η = 1 μL mg−1) shown in Fig. 6 displays a broad exothermic peak at 404 K associated with the thermal decomposition of MEFAS and a shallow endothermic peak at 342 K probably due to the removal of adsorbed moisture. In the DSC curve of MEFAS Lotsolution (obtained under conditions of solution synthesis) the same behavior is observed. The DSC curves of MEFAS show that MEFAS has lower thermal stability than its pure precursors – artesunate and mefloquine. This behavior can be attributed to amorphization and, in combination with the fact that the precursors themselves cannot go into amorphous phases in the milling process, points again to the formation of the MEFAS salt.
In summary, the mechanochemical obtaining of MEFAS with η = 1 μL mg−1 resulted in the hybrid salt with α-artesunate and mefloquine interacting through a hydrogen bond between the carboxylic acid of the former and, most likely, the basic sites of the latter (the piperidine or/and the pyridine). The attempted MEFAS with η = 0 and 0.1 μL mg−1 shows only a physical mixture of the precursors, while the one with η = 0.5 μL mg−1 shows a mixture of MEFAS as a salt and, possibly, ionic species that not necessarily interact.
We then demonstrate the influence of the amount of liquid on these mechanochemical reactions. In the literature there are some examples of how a small modification in the volume of added liquid can have a large impact on a mechanochemical reaction. The η value can change the reaction rate or even define the polymorphic form obtained. We have obtained a similar result to that reported by Friščić et al.,14 although in that case occurred the formation of cocrystals. Their results indicated that for each system there is a range of η values suitable for cocrystal synthesis and further they suggested that for very low η values cocrystallization was inefficient. Likewise, in this work, for the lower η values tested, the desired hybrid salt was not obtained, probably due to the low rate of reaction.14,30 The generalization of the method for other salts of acid–base character is an interesting perspective, and it will be considered in future investigations. The milling parameters and η values should depend on various aspects of the reactants involved – as the reactive groups – on the molecular size and solubility.
Conclusions
In this work, we propose an alternative synthesis route to obtain a new hybrid salt, MEFAS, via mechanochemistry. Solid state FTIR and NMR techniques indicated the formation of MEFAS by means of liquid-assisted milling (LAG) synthesis with η = 1 μL mg−1; this value of η was defined as the best parameter for the synthesis. The advantages of this proposed synthetic route, via mechanochemistry, over solution-phase synthesis proposed by Varotti et al.,11 are reduction of the solvent volume (ethyl ether, the same one used in the work of Varotti et al. as well as in the present one) by approximately 92% and reduction in the synthesis time – we demonstrated the formation of MEFAS after 15 minutes of milling, while in the solution-phase synthesis the MEFAS was obtained after 12 hours. These advantages assign a cost reduction in the route synthesis of MEFAS, employing a mechanochemical reaction, which is furthermore an environmentally friendly synthesis. It should be mentioned that we described the way of manufacturing the hybrid salt on a small scale. The parameters found for satisfactory acid–base reactions are specific for the employed experimental setup (though common in research laboratories), and its extension to large scale setups might require a fine tuning of the milling parameters and η values. However, there is no apparent objection to extend this versatile strategy for obtaining MEFAS with significant solvent reduction on a large scale.Conflicts of interest
There are no conflicts to declare.Acknowledgements
The authors acknowledge the financial support provided by FAPESP (proc. nr. 2015/26233-7), CNPq (proc. nr. 402289/2013-7, 307664/2015-5 and 404951/2016-3), PDTIS-FIOCRUZ and PPG-Nano-UFABC and CEM-UFABC.References
- W. Jones and M. D. Eddleston, Faraday Discuss., 2014, 170, 9–34 RSC.
- S. L. James, C. J. Adams, C. Bolm, D. Braga, P. Collier, T. Friić, F. Grepioni, K. D. M. Harris, G. Hyett, W. Jones, A. Krebs, J. MacK, L. Maini, A. G. Orpen, I. P. Parkin, W. C. Shearouse, J. W. Steed and D. C. Waddell, Chem. Soc. Rev., 2012, 41, 413–447 RSC.
- D. Tan, L. Loots and T. Friščić, Chem. Commun., 2016, 52, 7760–7781 RSC.
- D. Hasa and W. Jones, Adv. Drug Delivery Rev., 2017, 117, 147–161 CrossRef CAS PubMed.
- T. Friić, J. Mater. Chem., 2010, 20, 7599–7605 RSC.
- F. W. Muregi and A. Ishih, Drug Dev. Res., 2010, 71, 20–32 CAS.
- World Malaria Report 2018, ed. A. Noor, World Health Organization, Geneva, 2018, Licence: CC BY-NC-SA 3.0 IGO Search PubMed.
- B. Meunier, Acc. Chem. Res., 2008, 41, 69–77 CrossRef CAS.
- R. C. C. Carvalho, W. A. Martins, T. P. Silva, C. R. Kaiser, M. M. Bastos, L. C. S. Pinheiro, A. U. Krettli and N. Boechat, Bioorg. Med. Chem. Lett., 2016, 26, 1881–1884 CrossRef CAS.
- J. Penna-Coutinho, M. J. Almela, C. Miguel-Blanco, E. Herreros, P. M. Sá, N. Boechat and A. U. Krettli, Antimicrob. Agents Chemother., 2016, 60, 3145–3147 CrossRef CAS.
- F. D. P. Varotti, A. C. C. Botelho, A. A. Andrade, R. C. De Paula, E. M. S. Fagundes, A. Valverde, L. M. U. Mayer, J. S. Mendonça, M. V. N. De Souza, N. Boechat and A. U. Krettli, Antimicrob. Agents Chemother., 2008, 52, 3868–3874 CrossRef CAS.
- K. Gaudin, M. H. Langlois, A. Barbaud, C. Boyer, P. Millet, F. Fawaz and J. P. Dubost, J. Pharm. Biomed. Anal., 2007, 43, 1019–1024 CrossRef CAS.
- A. Delori, T. Friščić and W. Jones, CrystEngComm, 2012, 14, 2350 RSC.
- T. Friščić, S. L. Childs, S. A. A. Rizvi and W. Jones, The role of solvent in mechanochemical and sonochemical cocrystal formation: a solubility-based approach for predicting cocrystallisation outcome, CrystEngComm, 2009, 11, 388–403 RSC.
- A. A. Coelho, J. Evans, I. Evans, A. Kern and S. Parsons, Powder Diffr., 2011, 26, S22–S25 CrossRef CAS.
- R. W. Cheary and A. A. Coelho, J. Appl. Crystallogr., 1998, 31, 862–868 CrossRef CAS.
- M. Jarvinen, J. Appl. Crystallogr., 1993, 26, 525–531 CrossRef CAS.
- R. M. Silverstein, F. X. Webster and D. J. Kiemle, Identificação Espectrométrica de Compostos Orgânicos, LTC, Rio de Janeiro, 7th edn, 2006 Search PubMed.
- E. J. Einholm, Introduction to Spectroscopy, Cengage Learning, Belmont, 4th edn, 1996, vol. 121 Search PubMed.
- R. K. Haynes, H. W. Chan, M. K. Cheung, W. L. Lam, M. K. Soo, H. W. Tsang, A. Voerste and I. D. Williams, Eur. J. Org. Chem., 2002, 2002, 113–132 CrossRef.
- A. Skórska, J. Śliwiński and B. J. Oleksyn, Bioorg. Med. Chem. Lett., 2006, 16, 850–853 CrossRef.
- A. Pitaluga, L. D. Prado, R. Seiceira, J. L. Wardell and S. M. S. V. Wardell, Int. J. Pharm., 2010, 398, 50–60 CrossRef CAS.
- B. H. Toby, Powder Diffr., 2006, 21, 67–70 CrossRef CAS.
- U. Sternberg, R. Witter, I. Kuprov, J. M. Lamley, A. Oss, J. R. Lewandowski and A. Samoson, J. Magn. Reson., 2018, 291, 32–39 CrossRef CAS.
- P. Lim, in Analytical Profiles of Drug Substances, 1985, pp. 157–180 Search PubMed.
- A. Presser, A. Feichtinger and S. Buzzi, Monatsh. Chem., 2017, 148, 63–68 CrossRef CAS.
- G. Blaskó, G. A. Cordell and D. C. Lankin, J. Nat. Prod., 1988, 51, 1273–1276 CrossRef.
- L. K. Sy, S. M. Hui, K. K. Cheung and G. D. Brown, Tetrahedron, 1997, 53, 7493–7500 CrossRef CAS.
- J. S. Clawson, F. G. Vogt, J. Brum, J. Sisko, D. B. Patience, W. Dai, S. Sharpe, A. D. Jones, T. N. Pham, M. N. Johnson and R. C. P. Copley, Cryst. Growth Des., 2008, 8, 4120–4131 CrossRef CAS.
- D. Hasa, E. Miniussi and W. Jones, Cryst. Growth Des., 2016, 16, 4582–4588 CrossRef CAS.
Footnote |
| † Electronic supplementary information (ESI) available. See DOI: 10.1039/c9gc02478f |
| This journal is © The Royal Society of Chemistry 2020 |

