 Open Access Article
A square channel vanadium phosphite framework as a high voltage cathode for Li- and Na-ion batteries†
Prashanth
Sandineni
a,
Pranal
Madria
a,
Kartik
Ghosh
b and
Amitava
Choudhury
 *a
*a
aDepartment of Chemistry, Missouri University of Science and Technology, Rolla, MO 65409, USA. E-mail: choudhurya@mst.edu
bDepartment of Physics, Astronomy and Materials Science and Center for Applied Science and Engineering, Missouri State University, Springfield, Missouri 65897, USA
First published on 28th May 2020
Abstract
A vanadium phosphite compound, LiV(HPO3)2, has been synthesized using low-melting flux composed of phosphorous acid and lithium hydroxide. The crystal structure of the compound as refined using the Rietveld method matched with the previously reported unit cell parameters (space group: I![[4 with combining macron]](https://www.rsc.org/images/entities/char_0034_0304.gif) 2d, a = b = 10.5987(4), c = 9.9843(5) Å). It has a 3-dimensional open-framework structure with intersecting channels. Eight-membered ring square channels can be viewed along the c-axis and 6-membered ring channels along the a- and b-axis. The Li-ions are located in the six-membered ring channels exactly at the opening window to the eight-membered ring channels. The magnetic property measurements confirmed the +3 oxidation state of vanadium. The as-synthesized V-phosphite exhibits facile electrochemical properties with an insertion voltage of 4.05 V vs. Li+/Li and 3.7 V vs. Na+/Na in Li- and Na-ion batteries, respectively. When cycled between 4.5 and 1.2 V, the compound shows an insertion of second lithium at ∼2 V. The galvanostatic charge–discharge profiles indicate that LiV(HPO3)2 can be cycled between V4+ and V2+, where a 4 V slightly sloppy plateau and a sloping profile after 2 V represent a solid-solution type mechanism during reductions for V4+/V3+ and V3+/V2+ redox couples, respectively, whereas during charging there is evidence of a biphasic reaction. The compound has been further characterized by TGA, IR, and diffuse reflectance spectroscopy.
2d, a = b = 10.5987(4), c = 9.9843(5) Å). It has a 3-dimensional open-framework structure with intersecting channels. Eight-membered ring square channels can be viewed along the c-axis and 6-membered ring channels along the a- and b-axis. The Li-ions are located in the six-membered ring channels exactly at the opening window to the eight-membered ring channels. The magnetic property measurements confirmed the +3 oxidation state of vanadium. The as-synthesized V-phosphite exhibits facile electrochemical properties with an insertion voltage of 4.05 V vs. Li+/Li and 3.7 V vs. Na+/Na in Li- and Na-ion batteries, respectively. When cycled between 4.5 and 1.2 V, the compound shows an insertion of second lithium at ∼2 V. The galvanostatic charge–discharge profiles indicate that LiV(HPO3)2 can be cycled between V4+ and V2+, where a 4 V slightly sloppy plateau and a sloping profile after 2 V represent a solid-solution type mechanism during reductions for V4+/V3+ and V3+/V2+ redox couples, respectively, whereas during charging there is evidence of a biphasic reaction. The compound has been further characterized by TGA, IR, and diffuse reflectance spectroscopy.
Introduction
Over the past two decades, Li-ion batteries (LIBs) have been touted as the primary source for energy storage and power supply owing to their high energy density.1–7 Depending on the intended applications, batteries can be designed with optimum energy density. For example, high energy density is required for portable applications while low cost, long cycle life, and fast charge–discharge capabilities are desired for powering stationary devices like smart grids.5,8 In this regard, polyanion-based (PO43−, SO42−, SiO44−, etc.) cathode materials have attracted a lot of attention owing to their higher electrochemical stability and achievable capacities as first demonstrated by Goodenough in the case of olivine, LiFePO4.9 Polyanion-based materials are inherently safer because of the strong covalent bonds between the oxygen and the central element of the polyanionic moiety. Another significance of the polyanion chemistry is that the electronegativity of the central atom can tune the redox potential of the transition metal couple by changing the iono-covalency of the metal–ligand bond through the relay of inductive effect in M–O–X linkage (M = transition metal; X = central atom of polyanion).3,10 Besides safety and voltage tuneability, polyanioinc compounds are of great interest for solid state chemists as they can be synthesized under mild reaction conditions, such as hydrothermal conditions. A large number of structure types encompassing 3-dimensional (3-D) structures with channels or layered 2-dimensional structures can be accessed by varying the reaction conditions. Using this strategy, various electroactive compounds have been synthesized using a variety of polyanions,11 such as, phosphates,11–14 pyrophosphates,15,16 sulfates,17 borates,18 silicates,19,20 as well as a range of mixed polyanions such as carbono–phosphates,21,22 phosphate–pyrophosphates,23,24 phosphatonitrate,25 boro–phosphates26 and so on.27 Polyanions in combination with another electronegative element such as fluoride have been successfully used to further boost the insertion voltage through an inductive effect.28,29 Polyanion-based electrodes are also an excellent host for Na-ion batteries because of the availability of appropriate channel dimension/volume for the size of the Na-ion.30 Amidst all the development of polyanion electrodes, one important family of polyanions, namely, phosphites in which one of the oxygen of phosphate is replaced by a hydrogen, has remained largely unexplored. Phosphites are known to form a very stable 3-D structure with channels through vertex-sharing between the pseudo tetrahedral HPO32− and metal–oxygen polyhedra.31 Rojo et al. first reported the electrochemical activity in an open-framework iron phosphite with limited specific capacity.32 We have recently demonstrated facile electrochemical activities in two more iron phosphites, Li3Fe2(HPO3)3Cl and LiFe(HPO3)2, with an average voltage of 3V and a capacity exceeding 70 mA h g−1.33,34 There has been a few more reports of phosphites with encouraging electrochemistry in Li- and Na-ion batteries.35–37 Both Li3Fe2(HPO3)3Cl and LiFe(HPO3)2 are two electron candidates, however, their second electron could not be extracted because of the difficulty in accessing 3+/4+ couple of iron. Vanadium compounds, on the other hand, are known to exhibit a multi electron process more readily. The multi-electron process has been touted as one of the ways to fabricate the next generation of high-capacity Li-ion batteries by Whittingham.38,39 We, therefore, sought to synthesize LiV(HPO3)2, isostructural to LiFe(HPO3)2, to access both +4 and +2 oxidation states through oxidative de-insertion of Li and reductive insertion of Li, respectively. In fact, the synthesis and structure of LiV(HPO3)2 was reported in the literature where the authors also predicted it to be a potential cathode material for Li-ion batteries.40In this article, we report a new route to the synthesis of LiV(HPO3)2 and its reversible (de)intercalation of Li at a high average voltage of ∼4.05 V with reasonable capacity exceeding 70 mA h g−1 when LiV(HPO3)2 is cycled between 4.5 and 2 V. A capacity of >125 mA h g−1 can be harnessed when a second lithium is inserted, demonstrating the possibility of accessing multiple redox couples (V2+/V3+, V3+/V4+) in LiV(HPO3)2 to increase the capacity. The compound also exhibits electrochemical activity towards reversible insertion of Na+ ions at an average voltage of 3.7 V in a hybrid cell when the V3+/V4+ couple is accessed.
Experimental
Materials
VCl3 (97%), H3PO3 (98% extra pure) and LiOH·H2O (98% reagent grade) were purchased from Acros Organics. All the chemicals used in the syntheses were as-purchased and used without further purification.Synthesis
A mixture of 0.7870 g of VCl3 (5 mmol), 1.2304 g of H3PO3 (15 mmol), and 0.6295 g of LiOH·H2O (15 mmol) were ground in an agate mortar pestle, and the resulting paste was transferred into a 23 ml capacity Teflon-lined stainless steel Parr acid digestion bomb, which was then sealed tightly, and placed in a 175 °C pre-heated oven for 24 hours, followed by cooling down naturally to room temperature. The product of the reaction was then filtered and washed with hot water to remove any unreacted reagents and dried at room temperature (yield 94%).Chemical oxidation and reduction
The compound was subjected to chemical oxidation using NO2BF4. 0.2460 g (1.13 mmol) of the compound was mixed with 0.1740 g (1.31 mmol) of NO2BF4 in acetonitrile and was stirred continuously at room temperature in an argon filled glovebox for 5 days and then the reaction mixture was filtered, washed with acetonitrile and dried in vacuum without exposure to air. Chemical reduction was carried out using LiAlH4. 0.2048 g (0.94 mmol) of the compound was mixed with 0.03567 g (0.94 mmol) of LiAlH4 in tetrahydrofuran (THF) and was stirred continuously at room temperature in an argon filled glovebox for 3 days and then the reaction mixture was filtered, washed with THF and dried in vacuum without exposure to air.Electrochemical testing
To test the electrochemical performance of the sample, the compound was subjected to ball-milling thoroughly after mixing with super P conductive carbon in a SPEX 8000 miller for 1 hour to reduce the particle size. Ball milling was done only for 1 hour, as we observed the development of new peaks in the PXRD after 1 hour of milling (Fig. S1, ESI†). Polyvinylidene fluoride (PVDF) was then added to the active material as a binder and an optimum amount of N-methyl-2-pyrrolidone (NMP) was added to dissolve PVDF. The resulting slurry was further ball milled for another 20 minutes to obtain a homogeneous viscous mixture. The ratio of the active material, conducting carbon, and the binder in the cathode mix was 75![[thin space (1/6-em)]](https://www.rsc.org/images/entities/char_2009.gif) :
:![[thin space (1/6-em)]](https://www.rsc.org/images/entities/char_2009.gif) 15
15![[thin space (1/6-em)]](https://www.rsc.org/images/entities/char_2009.gif) :
:![[thin space (1/6-em)]](https://www.rsc.org/images/entities/char_2009.gif) 10. The cathode mix was then spread as a film of uniform thickness with the help of a glass rod onto a flat sheet of carbon-coated aluminum and copper foil current collector and transferred into a vacuum oven and dried overnight at 85 °C.
10. The cathode mix was then spread as a film of uniform thickness with the help of a glass rod onto a flat sheet of carbon-coated aluminum and copper foil current collector and transferred into a vacuum oven and dried overnight at 85 °C.
For electrochemical tests, CR2032 type coin cells were fabricated. The composite cathode film was cut into circular disks (3/8 inch diameter) with 4.0–5.0 mg of active material loading and transferred into an argon filled glove box with an oxygen concentration below 0.1 ppm. The cathode disk and Li anode (0.75 mm thickness Li ribbon cut into circular disks) were assembled in the coin cell casing with a Celgard® 2325 circular sheet placed between the two electrodes as the separator. The electrolyte, 1 M solution of LiPF6 in DMC–EC (1![[thin space (1/6-em)]](https://www.rsc.org/images/entities/char_2009.gif) :
:![[thin space (1/6-em)]](https://www.rsc.org/images/entities/char_2009.gif) 1), was then added and the cell was sealed using a coin cell crimper. The prepared cells were aged for equilibration for about 12 hours before electrochemical testing. Similarly, Na-ion batteries were also made using a Na anode and a 1 M solution of NaClO4 in PC was used as the electrolyte.
1), was then added and the cell was sealed using a coin cell crimper. The prepared cells were aged for equilibration for about 12 hours before electrochemical testing. Similarly, Na-ion batteries were also made using a Na anode and a 1 M solution of NaClO4 in PC was used as the electrolyte.
Cyclic voltammograms were obtained using a PAR EG&G potentiostat/galvanostat model 273 in the potential range of 1.2–4.5 V (vs. Li/Li+ or Na/Na+) with a scan rate of 0.05 mV s−1. Voltage composition profiles were obtained using galvanostatic charge/discharge experiments on an Arbin Instruments battery tester, model BT2043, on the same potential limits as CV at various C-rates. EIS spectra were obtained using Biologic instruments SP-150 with the coin cells in the frequency range from 0.1 Hz to 1 MHz, by applying a 5 mV AC amplitude.
Material characterization
Powder X-ray diffraction (PXRD)
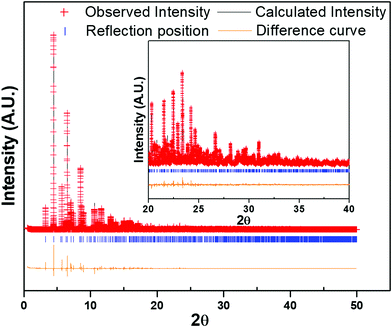
The laboratory PXRD pattern was obtained from a PANalytical X'Pert Pro diffractometer equipped with a Cu Kα1,2 anode and a linear array PIXcel detector over a 2θ range of 5 to 90° at an average scanning rate of 0.0472 s−1. The PXRD pattern matched well with the reported LiFe(HPO3)234 (Fig. S2, ESI†) and LiFe(SeO3)2,41 clearly indicating that the as-synthesized material was LiV(HPO3)2. Single-crystal structure determination of LiV(HPO3)2 has been reported40 but the article only lists the unit cell parameters and no atomic coordinates were listed. Furthermore, the atomic coordinates were also not found in any database. Therefore, to determine the structure and establish the absence of any impurity phase(s), Rietveld refinement was carried out using high-resolution synchrotron PXRD (S-PXRD) data collected from Advanced Photon Source (APS) in the Argonne National Laboratory. The atomic coordinates of LiFe(HPO3)2 were used in the initial model and refinement of S-PXRD data using GSAS-II42 converged very well, which also showed the absence of any impurity phase (Fig. 1). The final refined unit cell parameters are in agreement with the reported parameters40 and are listed with final refinement parameters of the compound in Table 1. Atomic coordinates and isotropic displacement parameters are given in Table S1 (ESI†). Selected bond lengths are given in Table 2.| Empirical formula | LiV(HPO3)2 |
| Formula weight | 217.84 |
| Crystal system | Tetragonal |
| Space group |
I![[4 with combining macron]](https://www.rsc.org/images/entities/char_0034_0304.gif) 2d 2d |
| a/Å | 10.5987(4) |
| b/Å | 10.5987(4) |
| c/Å | 9.9843(5) |
| Volume | 1121.57(4) Å3 |
| Z | 8 |
| Number of reflections | 1399 |
| R w | 12.450% |
| R f 2 | 6.411% |
| Number of data points | 47![[thin space (1/6-em)]](https://www.rsc.org/images/entities/char_2009.gif) 571 571 |
| Atom–Atom | d (Å) | Atom–Atom | d (Å) | Atom–Atom | d (Å) |
|---|---|---|---|---|---|
| P1–O1 | 1.5215(8) | 2 × V1–O1 | 2.0195(5) | 2 × Li1–O1 | 2.0092(1) |
| P1–O2 | 1.5260(2) | 2 × V1–O2 | 2.0106(4) | 2 × Li1–O2 | 2.0155(7) |
| P1–O3 | 1.5205(8) | 2 × V1–O3 | 1.9583(5) | ||
| P1–H1 | 1.3339(5) |
Thermogravimetric analysis (TGA)
TGA has been performed with a TA instruments Q50 TGA from room temperature to 800 °C at a scan rate of 10 °C min−1 under a nitrogen atmosphere. The TGA curve of the sample shows that it is stable up to 400 °C (Fig. 2a). On further heating from 400 to 800 °C, a mass gain is observed due to the presumed oxidation of P(III) to P(V) forming LiV(P2O7) as confirmed by the PXRD of the residue remaining after TGA. The oxidation may be caused as a result of a reaction with oxygen impurity (see eqn (1)) from the nitrogen gas used for purging. Similar oxidation of phosphite has been previously observed in phosphite-based materials.32,34,43,44| LiV(HPO3)2 + O2 = LiV(P2O7) + H2O | (1) |
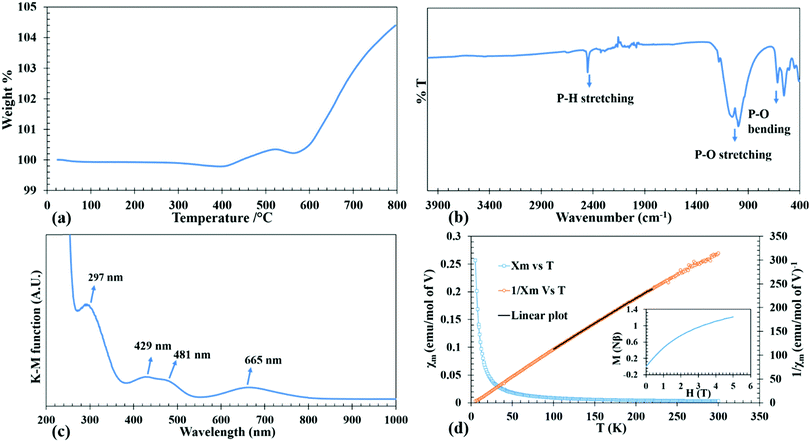 | ||
| Fig. 2 TGA curve (a), FT-IR spectrum (b), DRS spectrum (c), temperature dependence of molar magnetic susceptibility (χm) and inverse molar magnetic susceptibility (χm−1) of LiV(HPO3)2 (d). Inset of Fig. 2(d) shows M vs. H plot. | ||
IR spectroscopy
The IR spectrum was collected using a Thermo Nicolet iS50 FT-IR spectrometer in the range of 400–4000 cm−1 on a sample using the ATR mode. The IR spectrum in Fig. 2b clearly shows the signature P–H stretching at 2450 cm−1. The P–O stretching modes are observed from 900 to 1100 cm−1. The region from 500–600 cm−1 corresponds to the P–O bending modes.UV-Visible spectroscopy
Diffuse reflectance spectrum of the powdered sample was collected using a Praying Mantis accessory on a Cary 5000 UV-Vis-NIR spectrophotometer in the 200–1500 nm range. UV-Vis absorption spectrum of the compound as converted from the diffuse reflectance data by using the Kubelka–Munk equation is given in Fig. 2c. Considering the normal valencies of the elements in LiV(HPO3)2, the oxidation state of V can be discerned as +3, which is a d2 ion. The spin allowed electronic transition from the ground state 3T1g(3F) to the excited states of the same spin multiplicities 3T2g(3F), 3T1g(3P) and 3A2g(3F) take place at wavelengths of 665, 481 and 429 nm. Besides these, the weak spin forbidden transition from 3T1g(3F) to 1Eg(1G) is observed at a high energy (297 nm) as a shoulder peak in the ligand–metal charge transfer band.45,46Magnetic measurements
The purpose of conducting magnetic measurements is to confirm unequivocally the oxidation state of V as +3. The variable temperature magnetic susceptibility measurements of the compound (as-prepared) was carried out in the temperature range of 5–300 K using a Quantum Design SQUID magnetometer at 1 T applied field while warming up under zero-field cooled (ZFC) conditions. Isothermal magnetization measurements were performed at 5 K between 0 to 5 T applied field. The plots of temperature dependent ZFC magnetic susceptibility (χM–T), the corresponding inverse molar susceptibility (χM−1–T) and isothermal field dependent magnetization (M–H) for the as-synthesized compound are given in Fig. 2d. The variable temperature magnetic susceptibility, χMvs. T, plot is asymptotic from 5 to 300 K in an applied field of 1 T which indicates the paramagnetic behavior in that temperature range without any ordering. The small negative Θp value (−3.68 K) suggests that there may exist antiferromagnetic correlation in the paramagnetic region and an antiferromagnetic ordering may exist below 2 K. Magnetic moment per V (2.74 μB) as calculated from the Curie constant, C, derived from the linear fit of the χM−1–T plot, yields a value closer to the theoretical magnetic moment of 2.83 μB corresponding to d2 electronic configuration, thus supporting the +3 oxidation state of V as also observed in DRS. The saturation magnetization at 5 K is about 1.21 Nβ, which is about 60% of the theoretical saturation magnetization (Ms = gS Nβ) of 2 Nβ as calculated for V3+ with 2 unpaired electrons of parallel spins (inset of Fig. 2d).Results and discussion
Synthesis and structure
A low temperature solvent free synthesis route was used to produce the compound, LiV(HPO3)2. The reported synthesis was also a low temperature route using molten boric acid flux and HF as a mineralizer.40 The synthesis method reported here is a straight forward one and is devoid of the use of corrosive HF. VCl3 was used as the V source, hence, no reducing agent was needed. LiOH·H2O as the Li source and H3PO3, which has a low melting point of 73.6 °C, as the phosphite source were mixed together to form a low-melting flux. The reaction was carried out at 175 °C for one day to produce the desired product and the identity of the product did not change even if the reaction was carried out for seven days.The structure of LiV(HPO3)2 has been discussed already in the literature.40 The asymmetric unit consists of seven atoms, one V, one P, three O, one Li, and one H (Fig. S3, ESI†). It has a 3-D framework made up of alternating vertex-sharing VO6 octahedra and HPO3 psuedopyramidal units with Li-ions located in the channels (Fig. 3). The V–O bond distances found in the range of 1.9583(5)–2.0195(5) Å are in agreement with the reported V–O distances in V3+ compounds.45–47 P–O bond distances in the phosphite group in the range of 1.5205(8)–1.5260(2) Å and the P–H bond distance of 1.3339(5) Å are in agreement with the reported metal phosphites.32,34,44,45,47 Vertex sharing alternating VO6 octahedra and HPO3 units form 4-membered rings (connecting only V and P atoms), which are further connected to form a chain, and the chains are further connected through HPO3 units forming a layer (Fig. 3c and f). These layers are connected by HPO3 groups to produce a 3-D structure with intersecting channels: an 8-membered ring square-shaped channel along the c-axis (Fig. 3a and d) and a 6-membered ring bifurcated channel along the a- and b-axis (Fig. 3b and e). Li-ions are located exclusively in the 6-membered ring channel in the opening window to the 8-membered ring channel and adopts a distorted tetrahedral coordination (Fig. S4, ESI†). The 8-membered ring channels are empty and the hydrogen atoms from the HPO3 groups protrude into this channel (Fig. 3a and d).
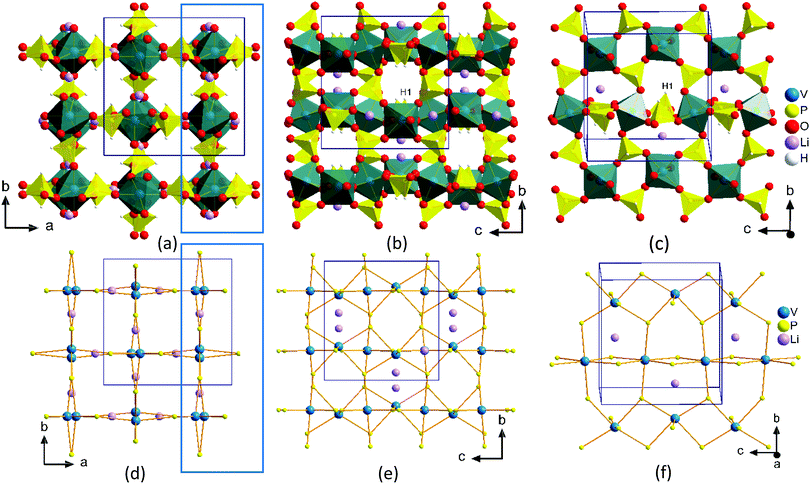 | ||
| Fig. 3 Perspective view of packing diagram of LiV(HPO3)2 along the c-axis (a and d) and along the a-axis (b and e). A slice of layer from Fig. 3a and b (blue rectangles) projected onto the bc plane are shown in Fig. 3c and f. Fig. 3d-f are generated by connecting the P and V atoms to show clearly the shape of the channels and inter-connectivity. | ||
Electrochemistry
Cyclic voltammetry
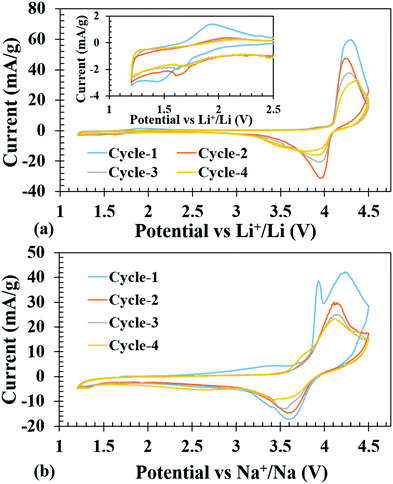
Cyclic voltammetry tests were conducted on the fabricated Li-ion coin cells to get an idea of the Li-insertion (cathodic reduction) and Li-extraction (anodic oxidation) voltages. Fig. 4a shows the first four cycles of cyclic voltammograms, when the cell was subjected to voltage scanning between 1.2 and 4.5 V. The open circuit voltage (OCV) was observed at 2.99 V. The battery was discharged first on the assumption that one more Li can be inserted to further reduce the V3+ to V2+; however, a clear reduction peak could not be observed due to low current (inset of Fig. 4a). It is to be noted here that a previous work on isostructural host with Fe3+ in place of V3+ displayed facile reductive Li-insertion through the reduction of Fe3+ to Fe2+.34 However, upon charging, one could see a high intense peak current at 4.3 V due to V3+ to V4+ oxidation and a corresponding reduction peak at 3.97 V.Similarly, Na-ion cells were subjected to the same voltage scanning from 1.2 to 4.5 V, and the battery was charged first to remove the Li and during the reduction cycle it was presumed that insertion of Na+ would take place. The first oxidation peak was similar to the Li-ion cell, at 4.3 V, but on subsequent oxidation, the peaks shifted to 4.15 V, which was consistent with the notion that during the first oxidation Li was extracted while in the 2nd cycle Na+ was extracted. The corresponding reduction peaks are at 3.63 V, which is ∼0.34 volt less than the Li-ion cell and does not show any shift during cycling indicating that the inserted ion was Na+ (Fig. 4b), consistent with the lower redox potential of Na/Na+ couple (2.71 V) compared to that of Li/Li+ (3.04 V) with respect to the SHE.
Galvanostatic charge–discharge
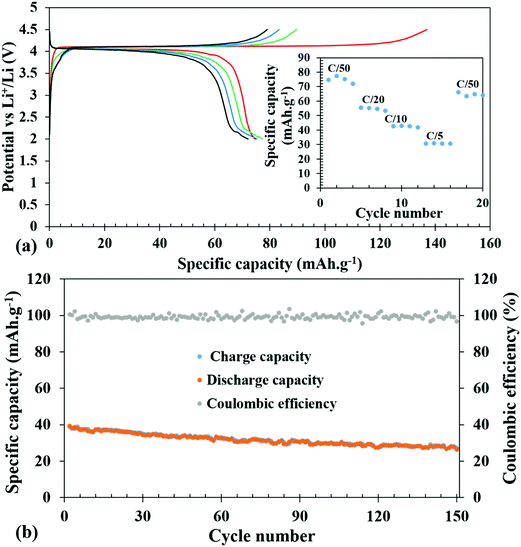
The galvanostatic charge–discharge experiments were carried out at various slow C-rates and the cut-off potentials were set in the range of 2.0–4.5 V or 1.2–4.5 V in different tests (Fig. 5 and 6). Assuming a complete one electron process per V atom, the theoretical capacity of the compound was calculated to be 122.96 mA h g−1. Fig. 5a shows the charge–discharge profiles at C/50. The battery was charged first and the first charge delivered a capacity of 137 mA h g−1, which on subsequent cycles decreased to 90, 84, and 79 mA h g−1. The extra capacity during the first charge can be attributed to the oxidation of the electrolyte and formation of a cathode electrolyte interface (CEI). The corresponding discharge capacities were 75, 77, 75, and 72 mA h g−1. Subsequently, at various comparatively faster C-rates, particularly at C/20, C/10 and C/5, a very stable discharge capacity of 55, 42 and 30 mA h g−1, respectively, (inset of Fig. 5a) was observed. After all the faster C-rates, when the cell was again cycled at C/50, it achieved a capacity of 66 mA h g−1, suffering a loss of 6 mA h g−1, and showed a stable capacity thereafter. This indicates that the decrease of capacity at a faster C-rate may be associated with the polarization within the cell and it is not due to any crystal structure degradation of the host. This was also reflected in the ex situ PXRD of the cycled cells which showed retention of crystallinity (discussed later). After 20 cycles of various C-rates, the battery was cycled at C/10 for 150 cycles to evaluate the capacity retention and the results indicated that it maintained a steady capacity of 33 mA h g−1 with 100% coulombic efficiency after an initial loss of 9 mA h g−1 (Fig. 5b).In order to check the possibility of a second electron process (V3+/V2+), the battery was discharged until 1.2 V. Fig. 6 shows the charge–discharge profiles of the battery cycled between 4.5 and 1.2 V. The discharge curves exhibit a slightly slopping behavior from 4.5 to 3.5 V for the V4+/V3+ couple followed by a sharp fall reaching 2.0 V and a second rather sloppy discharge profile from 2.0 V to 1.2 V corresponding to the reduction of V3+ to V2+. The sloppy profile of the discharge curve indicates a solid solution mechanism for the redox couples (V4+/V3+ and V3+/V2+). The total discharge capacity observed in the first run was 125 mA h g−1, which can be exactly divided into capacity ranges due to two redox processes V4+/V3+ and V3+/V2+, respectively, indicating that the percentage (∼50%) of V4+ reduced in the high voltage plateau to V3+ has been fully converted to V2+. However, there is a loss in the capacity on successive cycling when V2+ was accessed (inset of Fig. 6). Further optimization in terms of particle sizes, conductivities, and degree of SEI formation of the cathode active material needs to be improved to fully access the V4+/V3+ couple to take advantage of two full lithium insertion and double the capacity. In order to further understand the loss of capacity upon cycling, we carried out electrochemical impedance spectroscopy (EIS) measurements on the cycled cell. A freshly fabricated battery was cycled at C/5 for 100 cycles, which showed a capacity of 46 mA h g−1 in the first discharge but it constantly decreased upon cycling and by the end of the 100th cycle, only 11 mA h g−1 capacity was achieved (Fig. S5, ESI†). EIS studies were performed on freshly fabricated and cycled (1, 5, and 100 cycles) batteries in order to understand the kinetics of Li-ion transfer. The freshly fabricated cell was fitted with one R/C element in the mid frequency to high frequency region with one semicircle corresponding to the charge transfer resistance (Rct). During cycling, the cell is expected to develop SEI (solid electrolyte interface) and hence for the cycled cells, we used an extra R/C element at high frequency corresponding to the SEI resistance (RSEI) in addition to the other semicircle for charge transfer resistance (Rct). The combined resistance increased (RSEI + Rct) during the cycling of the battery and the decrease in capacity on successive cycling is correlated with an increase in SEI resistance from 11.45 Ohm in the first cycle to 65.17 Ohm in the 5th cycle. After 100 cycles, RSEI increased to 660.6 Ohm which was reflected in the decreased capacity on further cycling (Fig. S6, ESI†). The equivalent circuit parameters are listed in Table S2 (ESI†).
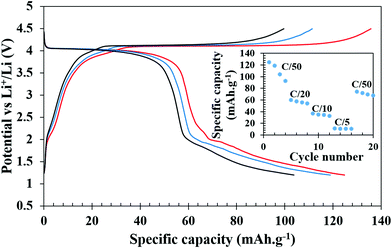 | ||
| Fig. 6 Galvanostatic charge–discharge profiles of Li-ion batteries at C/50 cycled between 1.2 and 4.5 V. The inset shows specific capacities during discharge at different C-rates. | ||
The Na-ion cells, on the other hand, were cycled between 1.75 to 4.5 V in a hybrid cell starting with a Li-containing host. The battery was charged first to remove Li and the first charge capacity (166 mA h g−1) was more than the theoretical capacity at the C/50 rate, presumably due to electrolyte decomposition and CEI formation as observed in Li-ion cells. In subsequent charging cycles, the capacity reduced to 84, 75, and 73 mA h g−1 and the corresponding discharge capacities were 87, 68, 63, and 61 mA h g−1, respectively (Fig. 7). At various comparatively faster C-rates, particularly at C/20, C/10 and C/5, very stable discharge capacities of 46, 35 and 25 mA h g−1, respectively, (inset of Fig. 7) were observed. After cycling through the faster C-rates, the cell was again cycled at C/50 which achieved a capacity of 54 mA h g−1 after suffering a loss of 7 mA h g−1 from the initial C/50 rate, however, it remained stable thereafter. The slightly lower average voltage, ∼3.65 V for the V4+/V3+ couple compared to 4 V for a Li-ion cell, also supports the intercalation of Na+ ions after the first discharge. For long term cycle life, a freshly fabricated battery was cycled at C/10 for 25 cycles, which showed a capacity of 44 mA h g−1 in the first discharge and it constantly decreased to 30 mA h g−1 by the end of 25 cycles. The battery was further cycled at C/5 for another 75 cycles (total 100 cycles), which showed progressive capacity fading and by the end of the 100th cycle, only 10 mA h g−1 capacity was achieved (Fig. S7, ESI†). However, when the cycled cell was returned to the C/50 rate, a capacity close to 50 mA h g−1 was achieved indicating that the decrease of capacity is due to the high degree of polarization and sluggish movement of Na under a faster rate.
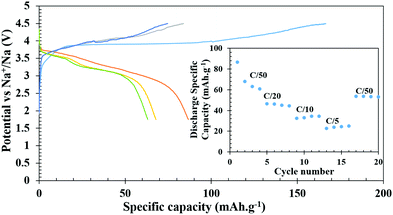 | ||
| Fig. 7 Galvanostatic charge–discharge profiles of Na-ion batteries at C/50. (Inset shows discharge specific capacity at different C-rates). | ||
In order to examine the feasibility of the V3+/2+ redox couple, both Li-and Na-ion batteries were fabricated on a copper current collector and cycled between 0.5 V to 3.0 V. Fig. S8 (ESI†) shows the charge–discharge profiles of the Li-ion battery, which was discharged first to reduce V3+ to V2+ and achieved a capacity of 184 mA h g−1, yielding a capacity more than that of the one electron process. The extra capacity during the first discharge was attributed to the SEI (solid electrolyte interface) formation. On further cycling, a stable capacity of 76 mA h g−1 was achieved. Subsequently, at various comparatively faster C-rates, particularly at C/20, C/10 and C/5, a very stable discharge capacity of 60, 52 and 48 mA h g−1, respectively, (inset of Fig. S8, ESI†) was observed. After cycling through all the faster C-rates, the cell was again cycled at C/50, and it achieved an initial capacity of 76 mA h g−1 without any loss in capacity. After 20 cycles of various C-rates, the battery was cycled at C/5 for 100 cycles to evaluate capacity retention and the results indicate that it maintained a steady capacity of 46 mA h g−1 with 100% coulombic efficiency (Fig. S8b, ESI†). To eliminate the possibility of any capacity due to reductive insertion into carbon, a half cell with a lithium anode and a super P carbon as the cathode was made. The cell when cycled between the same cut-off voltage showed a capacity in the range 23 to 26 mA h g−1 at C-rates between C/50 and C/5 (Fig. S9, ESI†). On close inspection of the discharge curve, it became apparent that the actual discharge starts at ∼1.2 V and this capacity (23–26 mA h g−1) when normalized with respect to the carbon present in the cathode mix will account for only 3–4 mA h g−1 of capacity. In other words, when the Li-ion cell with the LiV(HPO3)2 cathode mix is cycled between 0.5 and 3 V, more than 95% of the capacity (∼76 mA h g−1 at C/50) achieved was due to the redox of the V3+/V2+ couple. More importantly, when the battery was cycled in the range of 4.5–1.2 V (Fig. 6), the capacity achieved was exclusively due to redox of vanadium. On the other hand, the Na-ion battery showed a minimal capacity indicating that the V3+/2+ redox couple is not active for Na+ ion insertion probably due to lack of space for the accommodation of a large Na ion when the channel is occupied by Li. The first discharge at C/50 achieved a capacity of 43 mA h g−1 which decreased to 18 mA h g−1 by the 4th cycle and at faster C rates, almost negligible capacity was achieved (Fig. S10, ESI†).
Polyanion compounds of vanadium are known to exhibit a 4 volt insertion voltage with respect to Li+/Li or Na+/Na when operated within V3+/4+ and V4+/5+ redox couples, for example, in the monoclinic α-Li3V2(PO4)3 phase, in which all three Li+ ions can be removed electrochemically when charged above 4.5 V yielding a high capacity of ∼200 mA h g−1.48 The vanadium fluoro tavorite,49,50 LiVPO4F, and several polymorphs of LiVOPO4 also show the two electron process with higher oxidation redox couples, V3+/4+ and V4+/5+, respectively, showing ∼4 V with Li+/Li and a lower oxidation couple in the ∼2 V range.48–52 Similar to the above mentioned vanadium phosphates, LiV(HPO3)2 also displayed two redox processes at 4 and 2 V, respectively, with a difference of two volt between the two redox couples, which may appear as less attractive for application purposes. However, doping with appropriate metals can reduce this difference to some extent. In the case of the Na-ion battery, LiV(HPO3)2 shows only one electron process with a sloping discharge curve starting at 3.7 V, reminiscent of a single phase solid solution process.
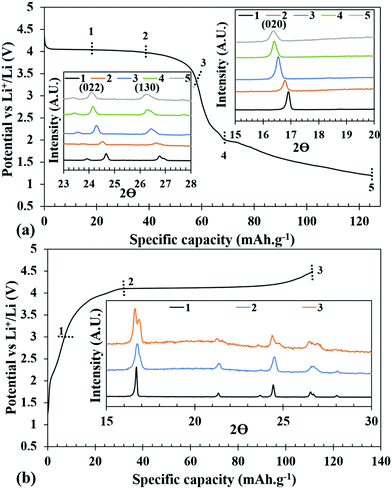
The overall volume change is very minimal indicating that the structure is very rigid. More importantly, the ability to index the Bragg reflections in the same tetragonal crystal system and in I![[4 with combining macron]](https://www.rsc.org/images/entities/char_0034_0304.gif) 2d space group supports the structural integrity upon repeated insertion and de-insertion of Li+. One of the lingering questions about the phosphite-based cathode is the stability of the P–H bond during electrochemical oxidation and reduction. To verify the intactness of the P–H bond, IR-spectroscopy was performed in the ATR mode on the cathode materials under charged and discharged conditions on which ex situ PXRD was conducted. The IR-spectra clearly showed the presence of P–H stretching, confirming that along with crystallinity of the structure it also retains the P–H bond (Fig. S13, ESI†).
2d space group supports the structural integrity upon repeated insertion and de-insertion of Li+. One of the lingering questions about the phosphite-based cathode is the stability of the P–H bond during electrochemical oxidation and reduction. To verify the intactness of the P–H bond, IR-spectroscopy was performed in the ATR mode on the cathode materials under charged and discharged conditions on which ex situ PXRD was conducted. The IR-spectra clearly showed the presence of P–H stretching, confirming that along with crystallinity of the structure it also retains the P–H bond (Fig. S13, ESI†).
Conclusions
In this article, we have reported the synthesis of LiV(HPO3)2 through a low-temperature route. The compound has shown reasonable achievable capacities for the Li- and Na-ion batteries with average voltages of 4.0 V and 3.7 V, respectively. In the case of Li-ion batteries, the compound exhibited a two electron process when the battery was discharged to 1.2 V. The Li-ion battery showed reasonable rate capabilities when cycled between 2 and 4.5 V. The discharge profile follows a solid solution behavior in the entire range and there is evidence of a biphasic behavior during charging. Considering the ease of synthesis and higher average voltage for Na- and Li-ion insertion and structural stability upon repeated cycling, this material cannot be overlooked. Further modification in terms of crystal sizes and improving the electronic conductivities via doping or in situ carbon coating can lead to useful improvements in the material.Conflicts of interest
There are no conflicts to declare.Acknowledgements
The authors acknowledge funding from the University of Missouri Research Board and Energy Research and Development Center, Missouri S&T. Use of the Advanced Photon Source at the Argonne National Laboratory was supported by the U.S. Department of Energy, Office of Science, Office of Basic Energy Sciences, under Contract No. DE-AC02-06CH11357.References
- M. S. Whittingham, Chem. Rev., 2004, 104, 4271–4302 CrossRef CAS PubMed.
- M. Armand and J. M. Tarascon, Nature, 2008, 451, 652–657 CrossRef CAS PubMed.
- J. B. Goodenough and Y. Kim, Chem. Mater., 2010, 22, 587–603 CrossRef CAS.
- B. L. Ellis, K. T. Lee and L. F. Nazar, Chem. Mater., 2010, 22, 691–714 CrossRef CAS.
- B. Dunn, H. Kamath and J. M. Tarascon, Science, 2011, 334, 928–935 CrossRef CAS PubMed.
- J. B. Goodenough and K.-S. Park, J. Am. Chem. Soc., 2013, 135(4), 1167–1176 CrossRef CAS PubMed.
- D. Larcher and J. M. Tarascon, Nat. Chem., 2015, 7, 19–29 CrossRef CAS PubMed.
- Z. Yang, J. Zhang, M. C. W. Kintner-Meyer, X. Lu, D. Choi, J. P. Lemmon and J. Liu, Chem. Rev., 2011, 111(5), 3577–3613 CrossRef CAS PubMed.
- A. K. Padhi, K. S. Nanjundaswamy and J. B. Goodenough, J. Electrochem. Soc., 1997, 144, 1188–1194 CrossRef CAS.
- A. K. Padhi, V. Manivannan and J. B. Goodenough, J. Electrochem. Soc., 1998, 145, 1518–1520 CrossRef CAS.
- C. Masquelier and L. Croguennec, Chem. Rev., 2013, 113(8), 6552–6591 CrossRef CAS PubMed.
- M. Morcrette, C. Wurm and C. Masquelier, Solid State Sci., 2002, 4, 239–246 CrossRef CAS.
- T. N. Ramesh, K. T. Lee, B. L. Ellis and L. F. Nazar, Electrochem. Solid-State Lett., 2010, 13, A43–A47 CrossRef CAS.
- M. F. V. Hidalgo, Y.-C. Lin, A. Grenier, D. Xiao, J. Rana, R. Tran, H. Xin, M. Zuba, J. Donohue, F. O. Omenya, I.-H. Chu, Z. Wang, X. Li, N. A. Chernova, K. W. Chapman, G. Zhou, L. Piper, S. P. Ong and M. S. Whittingham, J. Mater. Chem. A, 2019, 7(14), 8423–8432 RSC.
- S. Nishimura, M. Nakamura, R. Natsui and A. Yamada, J. Am. Chem. Soc., 2010, 132, 13596–13597 CrossRef CAS PubMed.
- M. Tamaru, S. C. Chung, D. Schimizu, S. I. Nishimura and A. Yamada, Chem. Mater., 2013, 25, 2538–2543 CrossRef CAS.
- G. Rousse and J. M. Tarascon, Chem. Mater., 2014, 26, 394–406 CrossRef CAS.
- A. Yamada, N. Iwane, Y. Harada, S. Nishimura, Y. Koyama and I. Tanaka, Adv. Mater., 2010, 22, 3583–3587 CrossRef CAS PubMed.
- A. Nytén, A. Abouimrane, M. Armand, T. Gustafsson and J. Thomas, Electrochem. Commun., 2005, 7, 156–160 CrossRef.
- C. Sirisopanaporn, C. Masquelier, P. Bruce, A. Armstrong and R. Dominko, J. Am. Chem. Soc., 2011, 133, 1263–1265 CrossRef CAS PubMed.
- H. Chen, G. Hautier and G. Ceder, J. Am. Chem. Soc., 2012, 134, 19619–19627 CrossRef CAS PubMed.
- W. Huang, J. Zhou, B. Li, J. Ma, S. Tao, D. Xia, W. Chu and Z. Wu, Sci. Rep., 2014, 4, 4188 CrossRef PubMed.
- H. Kim, I. Park, D. Seo, S. Lee, S. Kim, W. Kwon, Y. Park, C. Kim, S. Jeon and K. Kang, J. Am. Chem. Soc., 2012, 134, 10369–10372 CrossRef CAS PubMed.
- H. Kim, I. Park, S. Lee, H. Kim, K. Park, Y. Park, H. Kim, J. Kim, H. Lim, W. Yoon and K. Kang, Chem. Mater., 2013, 25, 3614–3622 CrossRef CAS.
- H. Yaghoobnejad Asl and A. Choudhury, Chem. Mater., 2016, 28(14), 5029–5036 CrossRef CAS.
- H. Yaghoobnejad Asl, P. Stanley, K. Ghosh and A. Choudhury, Chem. Mater., 2015, 27(20), 7058–7069 CrossRef CAS.
- B. Senthilkumar, C. Murugesan, L. Sharma, S. Lochab and P. Barpanda, Small Methods, 2019, 3, 1800253 CrossRef CAS.
- B. L. Ellis and L. F. Nazar, Chem. Mater., 2012, 4(6), 966–968 CrossRef.
- H. Yaghoobnejad Asl and A. Choudhury, RSC Adv., 2014, 4(71), 37691–37700 RSC.
- P. Barpanda, L. Lander, S.-I. Nishimura and A. Yamada, Adv. Energy Mater., 2018, 8(17), 1703055 CrossRef.
- U. C. Chung, J. L. Mesa, J. L. Pizarro, I. de Meatza, M. Bengoechea, J. R. Fernández, M. I. Arriortua and T. Rojo, Chem. Mater., 2011, 23, 4317–4330 CrossRef CAS.
- T. Rojo, J. L. Mesa, J. Lago, B. Bazan, J. L. Pizarro and M. I. Arriortua, J. Mater. Chem., 2009, 19(23), 3793–3818 RSC.
- H. Yaghoobnejad Asl, K. Ghosh, M. V. Meza and A. Choudhury, J. Mater. Chem. A, 2015, 3, 7488–7497 RSC.
- H. Yaghoobnejad Asl and A. Choudhury, Inorg. Chem., 2015, 54, 6566–6572 CrossRef CAS PubMed.
- A. S. Hameed, M. V. Reddy, N. Sarkar, B. V. R. Chowdari and J. J. Vittal, RSC Adv., 2015, 5(74), 60630–60637 RSC.
- I. Munaò, E. A. Zvereva, O. S. Volkova, A. N. Vasiliev, A. R. Armstrong and P. Lightfoot, Inorg. Chem., 2016, 55(5), 2558–2564 CrossRef PubMed.
- Z. Ma, L. Lander, S.-I. Nishimura, M. Okubo and A. Yamada, Chem. Commun., 2019, 55, 14155 RSC.
- M. S. Whittingham, Chem. Rev., 2014, 114(23), 11414–11443 CrossRef CAS PubMed.
- M. S. Whittingham, C. Siu and J. Ding, Acc. Chem. Res., 2018, 51(2), 258–264 CrossRef CAS PubMed.
- H. L. Huang, S. H. Huang, C. W. Lai, J. R. Wu, K. H. Lii and S. L. Wang, J. Chin. Chem. Soc., 2013, 60, 691–694 CrossRef CAS.
- G. Geister, Monatsh. Chem., 1994, 125(5), 535–538 CrossRef.
- B. H. Toby and R. B. V. Dreele, J. Appl. Crystallogr., 2013, 46, 544 CrossRef CAS.
- H. Yaghoobnejad Asl, R. Morries, T. T. Tran, P. S. Halasyamani, K. Ghosh and A. Choudhury, Cryst. Growth Des., 2016, 16(3), 1187–1194 CrossRef CAS.
- F. Hamchaoui, V. Alonzo, D. Venegas-Yazigi, H. Rebbah and E. L. Fur, J. Solid State Chem., 2013, 198, 295–302 CrossRef CAS.
- S. Fernandez, J. L. Mesa, J. L. Pizarro, L. Lezama, M. I. Arriortua and T. Rojo, Chem. Mater., 2002, 14, 2300–2307 CrossRef CAS.
- E. Alda, B. Bazan, J. L. Mesa, J. L. Pizarro, L. Lezama, M. I. Arriortua and T. Rojo, J. Solid State Chem., 2003, 173(1), 101–108 CrossRef CAS.
- S. F. Armas, J. L. Mesa, J. L. Pizarro, J. M. Clemente-Juan, E. Coronado, M. I. Arriortua and T. Rojo, Inorg. Chem., 2006, 45, 3240–3248 CrossRef PubMed.
- S.-C. Yin, H. Grondey, P. Strobel, M. Anne and L. F. Nazar, J. Am. Chem. Soc., 2003, 125(34), 10402–10411 CrossRef CAS PubMed.
- J. Barker, M. Y. Saidi and J. L. Swoyer, J. Electrochem. Soc., 2003, 150, A1394–A1398 CrossRef CAS.
- J.-M. Ateba Mba, C. Masquelier, E. Suard and L. Croguennec, Chem. Mater., 2012, 24(6), 1223–1234 CrossRef CAS.
- Y.-C. Lin, B. Wen, K. M. Wiaderek, S. Sallis, H. Liu, S. H. Lapidus, O. J. Borkiewicz, N. F. Quackenbush, N. A. Chernova, K. Karki, F. Omenya, P. J. Chupas, L. F. J. Piper, M. S. Whittingham, K. W. Chapman and S. P. Ong, Chem. Mater., 2016, 28, 1794–1805 CrossRef CAS.
- G. He, C. A. Bridges and A. Manthiram, Chem. Mater., 2015, 27(19), 6699–6707 CrossRef CAS.
Footnote |
| † Electronic supplementary information (ESI) available: The additional PXRDs of the ball-milled and as-synthesized pristine samples are given along with figures showing the asymmetric units and Li-coordination and a table of atomic coordinates and refined unit cell parameters for the electrochemically/chemically charged/discharged cell. The charge–discharge curves in the 0.5–3 V range and electrochemical impedance spectra and the table containing the fitted values of the EIS. See DOI: 10.1039/d0ma00029a |
| This journal is © The Royal Society of Chemistry 2020 |

