 Open Access Article
Doped TiO2: the effect of doping elements on photocatalytic activity†
Anna
Khlyustova
 *,
Nikolay
Sirotkin
 ,
Tatiana
Kusova
,
Anton
Kraev
,
Valery
Titov
and
Alexander
Agafonov
,
Tatiana
Kusova
,
Anton
Kraev
,
Valery
Titov
and
Alexander
Agafonov
G. A. Krestov Institute of Solution Chemistry of Russian Academy of Sciencec Academicheskaja str., 1, Ivanovo, 153045, Russia. E-mail: kav@isc-ras.ru
First published on 15th June 2020
Abstract
Doping of TiO2 with various elements increases its photocatalytic activity due to the formation of new energy levels near the conduction band. Photocatalysis involving titanium dioxide is a heterogeneous process in which the surface of the catalyst plays an important role. The structural properties of TiO2 are influenced by the synthesis method, the doping method, and the dopants. In this work, we compare different doping elements for improving the photocatalytic activity of titanium dioxide, which was synthesized by the sol–gel method. In the doping method, low-temperature underwater plasma was used. Al, Cu, Mo, and W acting as electrodes were chosen as doping elements. The obtained samples were characterized by various techniques. The incorporation of elements leads to the distortion of the TiO2 crystal lattice, thus changing its surface characteristics, and to a decrease in the band gap. The introduction of aluminum and copper increases the photocatalytic activity to 70% while doping with Mo and W increases the activity to 96% upon visible light irradiation for 60 minutes. Explanations of the effect of various doping elements on the photocatalytic activity of titanium dioxide are presented.
Introduction
In the processes of heterogeneous catalysis, surface area plays the main role. In the processes of photocatalysis, the redox potential of charge carriers and the selectivity of the catalyst surface are important. Recently, nanostructured materials have been considered for these purposes. The most popular of these is titanium dioxide.1,2 TiO2 is a semiconductor whose photocatalytic properties deteriorate under visible light due to its wide band gap. It is known that doping increases the photocatalytic activity of TiO2 upon irradiation with visible light. The nature of the dopant ion also affects this activity since the dopants can be interstitial, substitutional, or both in the case of incorporation. Different locations have a different effect on the properties of titanium dioxide. A comparison of the effectiveness of photocatalytic decomposition or synthesis of organic compounds is difficult since doping is carried out using different methods (sol–gel, solid reaction/mechanical activation, chemical vapor deposition, etc.), in which various precursors of metal ions are used.3–7 This can also affect the photocatalytic activity of the resulting samples.TiO2 is doped with various elements, both metals and non-metals.8,9 The most popular are transition metal ions.10–14 Interest in such elements is caused by the fact that they have partially filled d-orbitals. The incorporation of them into the lattice of titanium dioxide induces the formation of new energy levels near the conduction band. The use of Cu is a more affordable and cheaper alternative to elements such as silver and gold, as well as platinum group metals.15–19 Recently, there has been increasing interest in the use of trivalent metals (Al, Nb) as doping materials as they improve the electrical, optical, and structural characteristics of titanium dioxide.20–24 Doping of Al, Cu, Mo, or W always leads to a narrowing of the band gap of TiO2, which increases its photocatalytic activity upon irradiation with visible light. The introduction of Al3+ into the crystal lattice of titanium dioxide leads to the appearance of oxygen vacancies, which increase the photocatalytic activity.25 It was shown that, upon doping with copper, clusters of copper oxide are formed on the surface of TiO2, which can also take part in the photocatalysis.16,17 In the cases of transition metals of molybdenum and tungsten, not only Mo6+ and W6+ ions but also Mo4+, Mo5+, W4+, W5+, as well as Ti3+ ions, which also take part in photocatalytic processes, can be present on the powder surface.26–29
In the present work, we report a green chemistry method to obtain metal-doped titanium dioxide by the one-step plasma treatment of the TiO2 sol. The main goal was to study the effect of the doping cation on the structural and photocatalytic properties of titanium dioxide. TiO2 was prepared using a low-temperature sol–gel method, which allows one to obtain micro- and mesoporous powders. The doping procedure was carried out using low-temperature underwater plasma with metal electrodes. Al, Cu, Mo, and W were chosen as the sources of doping elements. The obtained samples were characterized by different techniques. The effect of the metal ion doping on the visible light photocatalytic performance of doped TiO2 was estimated towards the Rhodamine B dye.
The novelty of the work is the use of a new method for doping titanium dioxide with various elements by the plasma exposure of the TiO2 sol. Usually, the synthesis of titanium dioxide and its doping are carried out by similar methods, for example, sol–gel synthesis and chemical doping. In this work, we propose a combination of sol–gel synthesis with plasma treatment, during which the TiO2 sol is modified and doped. We use simple and affordable materials as doping elements. In this method, no chemical reagents are used as metal precursors. It increases the purity of the samples. There is no need to anneal the sample for cleaning when using this method. As a strength of this work, it can be noted that the effect of the nature of the doping element and the charge state on the photocatalytic activity of titanium dioxide is compared.
Materials and methods
Materials
Al, Cu, Mo, and W wires (diameter 1 mm), titanium isopropoxide, and Rhodamine B were purchased from Aldrich (USA). Nitric acid and isopropanol were obtained from Chimmed (Russia). All chemicals were used as received.Methods
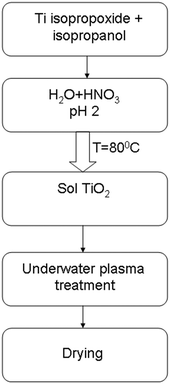
The synthesis of TiO2 was carried out using a sol–gel method. 16 mL Ti isopropoxide (98%) was mixed with 12 mL isopropanol for 2 hours with a magnetic stirrer. The next stage was adding an aqueous solution of nitric acid at pH 2. The mixing was carried out for 4 hours at 80 °C for sol and gel formation. The prepared TiO2 sol was processed by plasma. The time of treatment was 3 minutes. All experiments were carried out with a 100 mL volume of liquid. Then the suspension was dried at 60 °C in an oven for 24 hours. A scheme of the synthesis and doping of TiO2 is presented in Fig. 1.Underwater plasma is excited between two metallic electrodes, which were immersed in the liquid sol. Al, Cu, Mo, and W wires with a diameter of 1 mm were used as metallic electrodes. The distance between electrodes was constant (3 mm). The plasma was ignited using a direct current (DC) power supply. The masses of the electrodes before and after the experiment were measured using an AND HR-15AZ analytical balance (error ±0.1 mg).
Characteristics of the synthesized samples
The suspension solution obtained during the action of the discharge was analyzed by dynamic light scattering to determine the size of the formed particles and the zeta potential using a Zetasizer Nano (Malvern). The absorption spectrum was recorded in the UV and visible spectral regions to estimate the band gap.X-ray diffraction experiments were carried out on a diffractometer with a Mo-Kα source (λ = 0.07107 nm) (Bruker D8 Advance). The radiation was monochromatized by a zirconium β filter. Diffraction data were recorded in the range of angles 4–40° (2Θ) with a step of 0.02°. The intensity of scattering from the samples was registered using a VÅNTEC-1 position-sensitive detector (Bruker). The exposure time at each experimental point was 0.5 s. The crystallite sizes were estimated using the Debye–Scherer equation (eqn (1)):
 | (1) |
Adsorption and photocatalytic tests
Rhodamine B adsorption studies were carried out in batch form for investigating the effect of the initial concentrations of dyes and contact time while studying the adsorption isotherm and kinetics of the reactions. Dye solutions with known concentrations were prepared. The concentration of the dye was 1.2–12 mg L−1. The required amounts of powders were added to the flasks with solutions. The dispersed solutions were mixed using a magnetic stirrer at 300 rpm. Then the solutions were filtered and the residual concentration of RhB was determined using a UV-Vis spectrophotometer (PG70+ Instruments) at 544 nm. The adsorption kinetics was determined by analyzing the adsorption capacity of the dye solution at different contact times.The photocatalytic activity of doped TiO2 was evaluated through the rate of destruction of the Rhodamine B (RhB) dye under visible light. The experimental setup for the photocatalytic destruction of the dye has been described in detail.31 The source of visible light irradiation was a 55 W lamp (Phillips). 0.03 g of the powder was added into 500 mL of the 1.2 mg L−1 RhB solution. The dye solution and powder were mixed using a magnetic stirrer.
Results and discussion
Characteristics of the powders
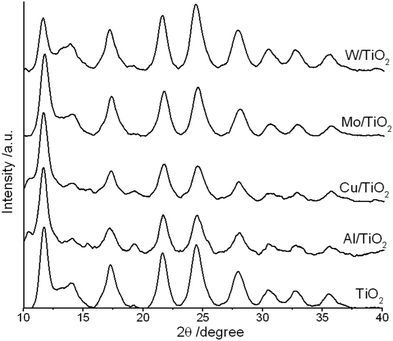
Data of the X-ray diffraction analysis are presented in Fig. 2. The interpretation of data was done by using the crystallographic open database.32 The untreated TiO2 powder showed characteristic peaks related to the (101), (112), (200), (211), and (204) planes at 2θ = 11.5°, 17.36°, 21.54°, 24.93°, and 27.43°, respectively. All peaks correspond to the anatase phase of TiO2. No additional peaks related to impure metals or their oxides have been recorded. A little shift of the main diffraction peaks was detected in powders after plasma treatment. This means that the doping of titanium dioxide occurs during plasma treatment. The lattice parameters are calculated using eqn (2) for the (200) and (101) peak positions:33 | (2) |
| Sample | Lattice parameters, Å | Crystallite size, nm | ||
|---|---|---|---|---|
| a = b | c | V = a × b × c (Å3) | ||
| TiO2 | 3.78 | 9.50 | 135.74 | 4.48 |
| Al/TiO2 | 3.79 | 9.46 | 135.88 | 4.66 |
| Cu/TiO2 | 3.77 | 9.39 | 133.46 | 4.61 |
| Mo/TiO2 | 3.78 | 9.50 | 135.74 | 4.13 |
| W/TiO2 | 3.80 | 9.46 | 136.60 | 3.89 |
Analysis of the published data showed that while doping with Mo6+ and W6+ an increase in cell volume and a decrease in crystallite size are always detected. In the case of aluminum as a doping agent, the published results are not so clear. In ref. 14 and 21, it was established that the introduction of Al led to an increase in the crystal lattice parameters a and c, while in ref. 24 the opposite effect was found. Published data on aluminum doped with TiO2 are contradictory. The reason for this may be the different sources of aluminum (salts, metallic aluminum).
In addition to the ionic radii of the substituting elements, their charges must also be taken into account. The loading of Al3+ in the TiO2 lattice induces the substitution of Ti4+ and the appearance of an imbalance of charges. Oxygen vacancies are formed for the compensation of charge imbalance. They also cause lattice defects (tensile, compressive strain, etc.).21,35 The introduction of W6+ or Mo6+ also leads to an imbalance of charges. In this case, an excess charge attracts hydroxyl ions to the surface to neutralize the charge.36
In our case, the introduction of tungsten caused asymmetric changes in the lattice parameters, which could be the result of the substitution of Ti4+ and compensation of the charge imbalance. In the case of Mo/TiO2, the calculations showed that there were no changes in the lattice parameters. This may be explained by the following. The underwater plasma action leads to the formation not only Mo6+ but also Mo4+ and molybdenum in the intermediate oxidation state.37 The ionic radius of Mo4+ is close to that of Ti4+.38 This can take the place of titanium inside the crystal lattice without causing a charge imbalance. A more detailed answer would probably be provided through XPS analysis. However, at present, we do not have the technical ability to conduct such an analysis.
SEM images with element mapping of doped TiO2 are presented in Fig. 3. The distribution of doping elements on the titanium dioxide surface is non-uniform. The energy dispersive analysis showed that the content of the doping element did not exceed 1% (Table 2).
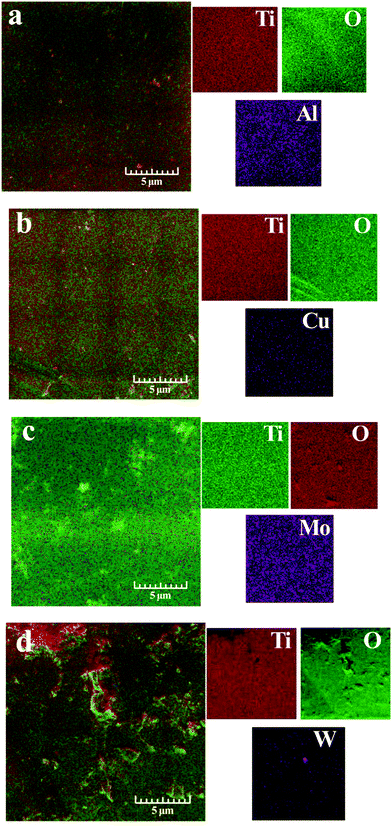 | ||
| Fig. 3 SEM microphotographs and element mapping of Al/TiO2 (a), Cu/TiO2 (b), Mo/TiO2 (c), and W/TiO2 (d). | ||
| Sample | Element ratio, % | Theoretical yield | |||
|---|---|---|---|---|---|
| O | Ti | Metal | Δm, g | Yield, % | |
| Al/TiO2 | 48.28 | 51.48 | 0.24 | 0.009 | 0.21 |
| Cu/TiO2 | 56.14 | 43.74 | 0.11 | 0.005 | 0.12 |
| Mo/TiO2 | 48.56 | 50.99 | 0.46 | 0.02 | 0.54 |
| W/TiO2 | 49.51 | 50.36 | 0.12 | 0.024 | 0.57 |
During the experiments, we believe that all the material of the electrodes atomized during the burning of the plasma was built into the lattice of titanium dioxide, thereby resulting in its doping. Based on the change in the mass of the electrodes before and after the plasma treatment of the sol (Δm), we calculated the maximum possible metal content (theoretical yields) in TiO2 (Table 2). In experiments with aluminum electrodes, the value of the theoretical yield turned out to be lower than the experimental value. Taking into account the fact that the EDS analysis gives an error of about 2–3%, it can be argued that the theoretical and experimental yields coincide. The same can be said for experiments with the Cu and Mo electrodes. In the case of tungsten electrodes, it can be assumed that the theoretical excess of the atomized metal served as a crystallization center during the plasma treatment of the sol.
The isotherms of low-temperature nitrogen adsorption–desorption for all samples are of type I (Fig. S1 in the ESI†). The presence of hysteresis indicates the presence of micropores in the samples. This is also confirmed by the significant difference in the SBET and SBJH values (Table 3). The resulting powders have a high specific surface area. Except for the data for Cu/TiO2, the introduction of a doping element increases the specific surface area of the powders. All doped materials are characterized by the presence of micropores (1.5–2 nm) and mesopores (3–4 nm) (Fig. S1 insets, ESI†).
| Sample | S BET, m2 g−1 | S BJH, m2 g−1 | D av, nm | V p, cm3 g−1 | S ext, m2 g−1 | S mic, m2 g−1 | V total, cm3 g−1 |
|---|---|---|---|---|---|---|---|
| TiO2 | 126.3 | 18.1 | 3.7 | 0.017 | 26.1 | 203.7 | 0.069 |
| Al/TiO2 | 128.7 | 20.7 | 3.6 | 0.019 | 28.5 | 210.8 | 0.071 |
| Cu/TiO2 | 105.5 | 17.6 | 3.2 | 0.016 | 25.4 | 176.3 | 0.059 |
| Mo/TiO2 | 137.9 | 24.7 | 3.6 | 0.021 | 34.4 | 239.9 | 0.085 |
| W/TiO2 | 142.9 | 20.7 | 3.6 | 0.019 | 29.9 | 231.9 | 0.078 |
In many studies, it was noted that the doping of TiO2 leads to an increase in the specific surface of the obtained powders. In several works related to studies of the structures of titanium dioxide doped with copper, it was found that the introduction of Cu leads to a decrease in SBET.16,19 This is associated with the formation of copper oxide clusters that block pores.16,39,40 The introduction of a doping element is always accompanied by the appearance of various defects in the crystal structure. The accumulation of defects (for example, oxygen vacancies) forms pores, thereby increasing the surface area.41
Characterization of the liquid sol
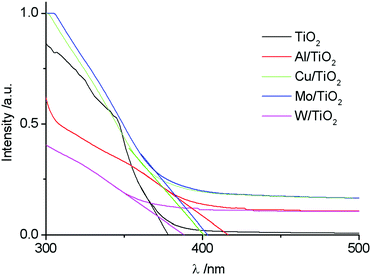
Fig. 4 shows the absorbance spectra of untreated and plasma treated TiO2 sols. As it can be seen, the introduction of the doping element leads to a red shift of the spectra. The relation (3) allows an estimation of the band gap energy (Table 4). The value of the band gap for TiO2 was 3.28 eV. This value is in good agreement with the data presented in previous works,26,42 where it was found that the Eg value is determined by the synthesis method.| Sample | λ, nm | E g, eV | D av, nm | ζ, mV |
|---|---|---|---|---|
| TiO2 | 377.91 | 3.28 | 40.51 | 36.15 |
| Al/TiO2 | 416.42 | 2.98 | 40.86 | 31.80 |
| Cu/TiO2 | 400.11 | 3.10 | 40.95 | 31.83 |
| Mo/TiO2 | 402.92 | 3.08 | 43.25 | 31.95 |
| W/TiO2 | 387.89 | 3.19 | 41.03 | 31.85 |
The obtained values are in agreement with the published data for low concentrations of doping elements.22,24,27,42,43
 | (3) |
The dynamic light scattering method was used for the estimation of the average particle size and zeta potential in the colloidal media (Table 4). Particle size distribution histograms are given in the ESI† (Fig. S2 in the ESI†). It is shown that element loading leads to an increasing average size of particles and decreases the value of zeta potential.
The average particle size in the sol was determined by dynamic light scattering immediately after the plasma doping process. The basis of this method is the calculation of the hydrodynamic radius (size) of a particle by measuring the viscosity of the medium and its diffusion coefficient. According to the Stokes–Einstein equation, the particle size is inversely proportional to the viscosity of the medium. The underwater plasma treatment leads to a change/decrease in the viscosity of the sol by the partial destruction of the organic component of the sol. From this point of view, a slight increase in the particle size can be explained. The greatest effect was recorded for Mo/TiO2. In this case, it can be assumed that molybdenum electrodes or molybdenum ions/atoms acted as a catalyst for the destruction of organic components.
Sorption
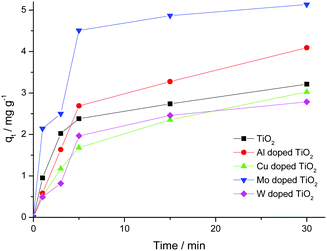
The sorption capacity of TiO2 and doped titanium dioxide with Rhodamine B is depicted in Fig. 5. The quantities of the adsorbed dye were calculated using eqn (4). The sorption capacity of Mo and Al exceeds the capacity of undoped TiO2 only. Unfortunately, we could not find the published data concerning the sorption capacity of doped TiO2 towards organic dyes. | (4) |
where C0 and Ct are the concentrations of the dye initially and at a predetermined time point, respectively (mg L−1), mcat is the mass of the catalyst (0.03 g), and V0 is the volume of the solution of the dye (0.05 L).
To analyze the sorption processes, we used models of pseudo-first and pseudo-second orders, the linear forms of the equations of which are of the form:
| ln(qe − qt) = lnqe − k1t, | (5) |
 | (6) |
| qt = Kid·t1/2 + A, | (7) |
The pseudo-first (k1 and qe) and pseudo-second (qe and k2) parameters were calculated from the plots of ln(qe − qt) = f(t) (Fig. S3 in the ESI†) and t/qt = f(t) (Fig. S3 in the ESI†), respectively. The parameters for the intra-particle diffusion model were obtained from the plot of qt = f(t1/2) (see Fig. S4, ESI†).
The calculated values of the constant and correlation coefficients (R2) are presented in Table 5. The calculated values showed that the sorption process is not described internally by partial diffusion, since one of the three conditions is not satisfied.44 Because R2 is close to 1 and the proximity of the q(exp.) and q(calc.) values, the sorption process is described using the kinetic model of the pseudo-second order.
| TiO2 | Al/TiO2 | Cu/TiO2 | Mo/TiO2 | W/TiO2 | |
|---|---|---|---|---|---|
| q e (exp.), mg g−1 | 3.22 | 4.09 | 3.03 | 10.27 | 2.79 |
| Pseudo-first order | |||||
| q e (calc.), mg g−1 | 2.48 | 4.91 | 3.12 | 6.6 | 2.74 |
| k, min−1 | 0.445 | 0.661 | 0.467 | 0.611 | 0.502 |
| R 2 | 0.926 | 0.872 | 0.909 | 0.95 | 0.95 |
| Pseudo-second order | |||||
| q e (calc.), mg g−1 | 3.43 | 4.88 | 3.59 | 11.01 | 3.41 |
| k, g mg−1 min−1 | 0.394 | 0.164 | 0.159 | 0.48 | 0.158 |
| R 2 | 0.995 | 0.983 | 0.992 | 0.992 | 0.99 |
| Intra-particle diffusion model | |||||
| A, mg g−1 | 0.561 | 0.212 | 0.118 | 1.048 | 0.127 |
| K id, g mg−1 min−1/2 | 0.555 | 0.768 | 0.561 | 0.899 | 0.542 |
| R 2 | 0.812 | 0.91 | 0.965 | 0.747 | 0.87 |
Adsorption isotherms
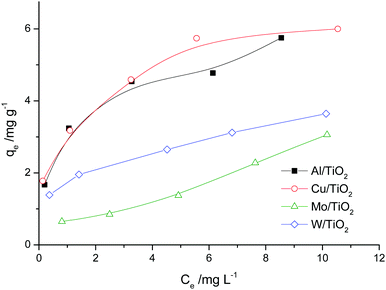
The adsorption isotherms are shown in Fig. 6. For the Al/TiO2 sample, the isotherm is of S type. For the Cu/TiO2 and W/TiO2 samples, the isotherms are of L type. In the case of Mo/TiO2, the curve has the form of the initial part of the S isotherm.The linear forms of the Langmuir and Freundlich model equations are as follows:
 | (8) |
| ln(qe) = ln(kF) + nFln(Ce) | (9) |
The approximation data are presented in Table 6. According to the values of the correlation coefficient for most samples, adsorption is not monolayer. The Freundlich isotherm model seems better than the Langmuir model for most samples. The n values are more than 1. This means that the adsorption of one molecule raises the sorption of the other molecules of the dye. This is correlated with the properties of Rhodamine B, which can form dimers in low viscosity solvents (water) (so-called H-dimers).45
| Sample | Langmuir isotherm parameters | Freundlich isotherm parameters | ||||
|---|---|---|---|---|---|---|
| q max | K L | R 2 | K F | n | R 2 | |
| Al/TiO | 4.86 | 0.19 | 0.39 | 2.46 | 3.17 | 0.97 |
| Cu/TiO | 7.48 | 0.13 | 0.25 | 2.67 | 3.23 | 0.99 |
| Mo/TiO | 0.57 | 0.51 | 0.92 | 0.69 | 1.59 | 0.91 |
| W/TiO | 1.32 | 0.36 | 0.56 | 1.64 | 3.51 | 0.99 |
Photocatalytic activity
The photocatalytic destruction experiments of the RhB dye solution with undoped and doped TiO2 under visible light irradiation were carried out. The experiments were carried out in the dark and under exposure to visible light (Fig. 7). The results showed that the sorption process is not limiting. As can be seen, the introduction of a doping element in titanium dioxide leads to an improvement in its photocatalytic properties. In the cases of Al and Cu, the decomposition efficiency increases from 50% for pure TiO2 to 70%. The loading of Mo and W increases the efficiency of photocatalytic destruction of the dye to 96% with 60 minutes of exposure.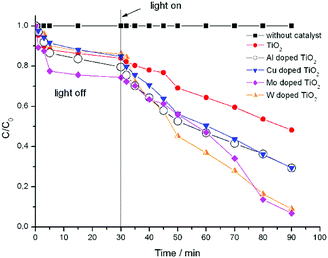 | ||
| Fig. 7 Photocatalytic performance of the undoped and doped TiO2 catalysts for the destruction of Rhodamine B under visible light irradiation for 60 min. | ||
Registration of absorption spectra of dye solutions in the range of 190–800 nm during photocatalysis provides information not only about the destruction of the color centers of the dye molecule but also about the appearance of degradation products in the solution. Small fractions such as phenols and nitrophenols absorb in the region of 250–350 nm. In our experiments, the appearance of peaks in this region is not recorded (Fig. S5 in the ESI†). This allows us to assume that the destruction process leads to the formation of small organic molecules (saturated and unsaturated carboxylic acids). Data on the chemical analysis of solutions after photocatalysis can give more information about the destruction process. This was not the aim of this work, but may be the goal of future studies.
For a simplified description of the kinetics of heterogeneous processes, we make some assumptions. We accept the condition that the distribution of light intensity is the same throughout the reactor. Since we conduct experiments with one radiation source, the radiation intensity is the same in all experiments. The concentration of the catalyst is constant. Also, we will not take into account the rate of generation of active centers on the surface of the catalyst, which is determined by the volumetric absorption rate of photons. The photochemical reactor provides for cooling. Therefore, we accept the condition that the reaction temperature does not change and is 23 °C. Under these assumptions, the decomposition rate is determined only by the concentration of the substrate. The time dependences of ln(C/C0) are shown in Fig. 8. The kinetic curves are described using the pseudo-first-order reaction with good correlation coefficients (R2 > 0.95). The slopes of the present lines show that the rate constant of W/TiO2 is larger than those of other samples. The kinetic constants of undoped and doped TiO2 are listed in Table 7.
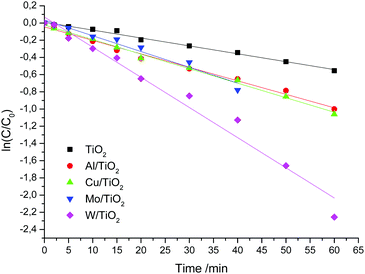 | ||
| Fig. 8 Kinetic curves of RhB destruction over undoped and doped TiO2 under visible light irradiation. | ||
| TiO2 | Al/TiO2 | Cu/TiO2 | Mo/TiO2 | W/TiO2 | |
|---|---|---|---|---|---|
| k, min−1 | 0.0092 | 0.0157 | 0.0169 | 0.0183 | 0.0351 |
| R 2 | 0.991 | 0.989 | 0.995 | 0.96 | 0.972 |
The substitution of the Ti4+ ion or the incorporation of metal ions into the crystal lattice of titanium dioxide creates additional energy levels in the band gap of TiO2. This causes photoactive transitions upon irradiation with visible light due to the excitation of electrons in this energy level and their transition to the conduction band. The use of metal ions as doping elements affects the photoreactive ability of titanium dioxide by acting as electron (holes) traps and changing the rate of the electron/hole recombination process. Electrons can be trapped by oxygen molecules on the surface of TiO2 to form a radical O2−. Holes move in the opposite direction from electrons. Photogenerated holes in the valence band can be scavenged by either hydroxyl ions or water molecules that are adsorbed on the surface. As a result, active OH radicals are formed, which are strong oxidizing agents.
According to the calculated values of Eg, the effectiveness of doped titanium dioxide should decrease in the order of Al/TiO2 > Mo/TiO2 > Cu/TiO2 > W/TiO2 > TiO2. However, we did not observe such a pattern. Therefore, the band gap is not the main criterion in our experiments. The specific surface plays a major role in sorption processes, which are not the dominant processes in our photocatalysis experiments.
Data from an XPS analysis can help us explain this phenomenon. Unfortunately, we do not have the technical ability to conduct such analysis of our samples. So we analyze the data presented in the published works. When doping titanium dioxide with molybdenum and tungsten ions, an XPS analysis shows that Mo6+, Mo5+, (in some cases Mo4+), W6+ and W5+ ions coexist on the surface.26–29 In addition to this, XPS peaks related to Ti3+ are recorded. All this leads to the formation of oxygen vacancies. In experiments on doping with aluminum ions, Al3+ and Ti4+ ions exist on the sample surface.21 The XPS peaks of Ti3+ are recorded under certain conditions (for example, the concentration of aluminum ions in the sample).14,22,24 In Cu doped TiO2 samples, only Cu2+ and Ti4+ ions are detected on the surface.16,18
On the other hand, Aviles Garcia et al.27,46 found that the surface of the TiO2 samples doped with molybdenum and tungsten contains surface hydroxyl groups. These groups are involved in the photodegradation of organic compounds.47 Also, in ref. 48 it was established that the surface acidity of W-doped TiO2 is 42 times higher than that of Al-doped TiO2. This explains the high affinity of the W/TiO2 sample for chemical particles that have unpaired electrons.49
Taking into account the fact that the state of the catalyst surface also plays an important role in heterogeneous photocatalysis, the following can be assumed. The action of plasma on aqueous and organic solutions leads to the formation of hydrogen peroxide.50 It is known that aluminum is inert concerning H2O2, copper is inactive, and Mo and W actively react in hydrogen peroxide with the formation of peroxide compounds and hydroxyl radicals.51 Based on this, we can conclude that the underwater plasma processing of sols leads not only to the doping of TiO2 but also to the creation of new functional groups that take part in photocatalysis. In the case of using electrodes from Mo and W, this effect is most pronounced.
It is known that the time of diffusion of charge carriers from the bulk to the surface of the photocatalyst is directly proportional to the squared radius of particles.52,53 It means that a large crystallite size leads to an increase in the diffusion time. The probability of the electron/hole recombination increases, which leads to a decrease in the photocatalytic activity. A comparison of the data in Tables 1 and 6 shows that the photocatalytic activity of the samples decreases with increasing crystallite size.
It was noted that the effect of the doping amount on the photocatalytic activity has a curve with a maximum.14,15,19,22,23,27,29,43,46,49 The analysis of published works showed that the value of the optimal doping amount differs for various elements. In the case of Al/TIO2, the optimum amount can be 0.5 wt%22 or 0.2 wt%.23 These differences can be explained by both synthesis/doping methods and photocatalytic objects.
Conclusions
The use of underwater plasma as a method for doping titanium dioxide with various metal ions has shown good results. The photocatalytic ability was studied on the destruction of the Rhodamine B dye. All doped samples showed higher efficiency than undoped TiO2. The obtained results showed that the main role is played by the state of the catalyst surface in the process of photocatalysis. The surface is modified by the action of underwater plasma. Modification occurs in different ways and depends on the material of the electrode, which may be one of the directions of our future studies.Conflicts of interest
There are no conflicts to declare.Notes and references
- F. Zaera, Chem. Soc. Rev., 2013, 42, 2746 RSC.
- M. Ge, J. Cai, J. Iocozzia, C. Cao, J. Huang, X. Zhang and Y. Lai, Int. J. Hydrogen Energy, 2017, 42, 8418 CrossRef CAS.
- U. G. Akpana and B. H. Hameed, Appl. Catal., A, 2010, 375, 1 CrossRef.
- S. R. Kurtz and R. G. Gordon, Thin Solid Films, 1987, 147, 167 CrossRef CAS.
- G. Liu, X. Zhang, Y. Xu, X. Niu, L. Zheng and X. Ding, Chemosphere, 2005, 59, 1367 CrossRef CAS PubMed.
- N. Liu, X. Chen, J. Zhang and J. W. Schwank, Catal. Today, 2014, 225, 34 CrossRef CAS.
- Z. Dargahi, H. Asgharzadeh and H. Maleki-Ghaleh, Ceram. Int., 2018, 44, 13015 CrossRef CAS.
- B. Roose, S. Patnak and U. Steiner, Chem. Soc. Rev., 2015, 44, 8326 RSC.
- S. Yadav and G. Jaiswar, J. Chin. Chem. Soc., 2017, 64, 103 CrossRef CAS.
- B. Liu, H. M. Chen, C. Liu, S. C. Andrews, C. Hahn and P. Yang, J. Am. Chem. Soc., 2013, 135, 9995 CrossRef CAS PubMed.
- H. Peng, J. Li, S. S. Li and J. B. Xia, J. Phys.: Condens. Matter, 2008, 20, 125207 CrossRef.
- H. Weng and J. Dong, Phys. Rev. B: Condens. Matter Mater. Phys., 2005, 71, 035201 CrossRef.
- V. Bhatia and A. Dhir, J. Environ. Chem. Eng., 2016, 4, 1267 CrossRef CAS.
- A. K. P. D. Savio, J. Fletcher and F. R. Hernández, Ceram. Int., 2013, 39, 2753 CrossRef CAS.
- F. Bensouici, M. Bououdina, A. A. Dakhel, R. Tala-Ighil, M. Tounane, A. Iratni and W. Cai, Appl. Surf. Sci., 2017, 395, 110 CrossRef CAS.
- Y. Wang, W. Duan, B. Liu, X. Chen, F. Yang and J. Guo, J. Nanomater., 2014, 178152 Search PubMed.
- S. Mathew, P. Ganguly, S. Rhatigan, V. Kumaravel, C. Byrne, S. J. Hinder and S. C. Pillai, Appl. Sci., 2018, 8, 2067 CrossRef CAS.
- M. M. Momeni, Y. Ghayeb and Z. Ghonchegi, Ceram. Int., 2015, 41, 8735 CrossRef CAS.
- N. Turkten, Z. Cinar, A. Tomruk and M. Bekbolet, Environ. Sci. Pollut. Res., 2019, 26, 36096 CrossRef CAS PubMed.
- X. Lü, X. Mou, J. Wu, D. Zhang, L. Zhang, F. Huang and S. Huang, Adv. Funct. Mater., 2010, 20, 509 CrossRef.
- N. D. M. Said, M. Z. Sahdan, N. Nayan, H. Saim, F. Adriyanto, A. S. Bakri and M. Morsin, RSC Adv., 2018, 8, 29686 RSC.
- A. A. Murashkina, P. D. Murzin, A. V. Rudakova, V. K. Ryabchuk, A. V. Emeline and D. W. Bahnemann, J. Phys. Chem. C, 2015, 119, 24695 CrossRef CAS.
- F. Bensouici, M. Bououdina, A. A. Dakhel, T. Souier, R. Tala-Ighil, M. Toubane and W. Cai, Thin Solid Films, 2016, 616, 655 CrossRef CAS.
- D. M. de los Santos, T. Aguilar, A. Sánchez-Coronilla, J. Navas, N. Cruz Hernandez, R. Alcantara and J. Martín-Calleja, Chem. Phys. Chem., 2014, 15, 2267 CrossRef CAS PubMed.
- Y. J. Choi, Z. Seeley, A. Bandyopadhyay, S. Bose and S. A. Akbar, Sens. Actuators, B, 2007, 124, 111 CrossRef CAS.
- J. G. Huang, X. T. Guo, B. Wang, L. Y. Li, M. X. Zhao, L. L. Dong and Y. T. Huang, J. Spectrosc., 2015, 681850 Search PubMed.
- O. Avilés-García, J. Espino-Valencia, R. Romero, J. L. Rico-Cerda, M. Arroyo-Albiter and R. Natividad, Fuel, 2017, 198, 31 CrossRef.
- S. Wang, L. N. Bai, H. M. Sun, Q. Jiang and J. S. Lian, Structure and photocatalytic property of Mo-doped TiO2 nanoparticles, Powder Technol., 2013, 244, 9 CrossRef CAS.
- S. Sathasivam, D. S. Bhachu, Y. Lu, N. Chadwick, S. A. Althabaiti, A. O. Alyoubi and I. P. Parkin, Sci. Rep., 2015, 5, 10952 CrossRef CAS PubMed.
- L. Xu, M. P. Garrett and B. Hu, J. Phys. Chem. C, 2012, 116, 13020 CrossRef CAS.
- T. V. Gerasimova, O. L. Evdokimova, A. S. Kraev, V. K. Ivanov and A. V. Agafonov, Microporous Mesoporous Mater., 2016, 235, 185 CrossRef CAS.
- COD card 7206075 Crystallography Open Database (COD), http://www.crystallography.net.
- J. B. Nelson and D. P. Riley, Proc. Phys. Soc., 1945, 57, 160 CrossRef CAS.
- J. Navas, A. Sánchez-Coronilla, T. Aguilar, N. C. Hernández, M. Desireé, J. Sánchez-Márquez and J. Martín-Calleja, Phys. Chem. Chem. Phys., 2014, 16, 3835 RSC.
- A. K. Tripathi, M. K. Singh, M. C. Mathpal, S. K. Mishra and A. Agarwal, Study of structural transformation in TiO2 nanoparticles and its optical properties, J. Alloys Compd., 2013, 549, 114–120 CrossRef CAS.
- J. Papp, S. Soled, K. Dwight and A. Wold, Chem. Mater., 1994, 6, 496 CrossRef CAS.
- A. Khlyustova, N. Sirotkin, A. Kraev, V. Titov and A. Agafonov, Dalton Trans., 2020, 49, 6270 RSC.
- R. D. Shannon, Acta Crystallogr., Sect. A: Found. Crystallogr., 1976, 32, 751 CrossRef.
- R. López, R. Gómez and M. E. Llanos, Catal. Today, 2009, 148, 103 CrossRef.
- P. L. Richardson, M. L. Perdigoto, W. Wang and R. J. Lopes, Appl. Catal., B, 2013, 132, 408 CrossRef.
- J. F. Nye, Physical properties of crystals: their representation by tenzor and matrices, Clarendon Press, Oxford, 1957 Search PubMed.
- A. V. Agafonov, D. A. Afanasyev, T. V. Gerasimova, A. S. Krayev, M. A. Kashirin, V. V. Vinogradov, A. V. Vinogradov and V. G. Kessler, ACS Sustainable Chem. Eng., 2016, 4, 2814 CrossRef CAS.
- C. Hua, X. Dong, X. Wang, M. Xue, X. Zhang and H. Ma, J. Nanomater., 2014, 943796 Search PubMed.
- G. McKay, H. S. Blair and J. J. Gardner, Appl. Polym. Sci., 1983, 28, 1767 CrossRef CAS.
- F. del Monte and D. Levy, J. Phys. Chem. B, 1998, 102, 8036 CrossRef CAS.
- O. Avilés-García, J. Espino-Valencia, R. Romero-Romero, J. L. Rico-Cerda, M. Arroyo-Albiter, D. A. Solís-Casados and R. Natividad-Rangel, Catalysts, 2018, 8, 631 CrossRef.
- K. L. Yeung, S. T. Yau, A. J. Maira, J. M. Coronado, J. Soria and P. L. Yue, J. Catal., 2003, 219, 107 CrossRef CAS.
- Y. C. Lee, Y. P. Hong, H. Y. Lee, H. Kim, Y. J. Jung, K. H. Ko and K. S. Hong, J. Colloid Interface Sci., 2003, 267, 127 CrossRef CAS.
- S. Liu, E. Guo and L. Yin, J. Mater. Chem., 2012, 22, 5031 RSC.
- B. R. Locke and K. Y. Shih, Plasma Sources Sci. Technol., 2011, 20, 034006 CrossRef.
- U. Shamb, Ch. Setterfield and R. Wentworth, Hydrogen Peroxide, Reinold Publ. Corp., N.Y., 1955 Search PubMed.
- A. T. Bell, Science, 2003, 299, 1688 CrossRef CAS PubMed.
- M. Shang, W. Wang, S. Sun, L. Zhou and L. Zhang, J. Phys. Chem. C, 2008, 112, 10407 CrossRef CAS.
Footnote |
| † Electronic supplementary information (ESI) available. See DOI: 10.1039/d0ma00171f |
| This journal is © The Royal Society of Chemistry 2020 |

