 Open Access Article
A nanoscale, biocompatible and amphiphilic prodrug of cabazitaxel with improved anticancer efficacy against 3D spheroids of prostate cancer cells†
Ashok Kumar
Jangid‡
 a,
Deep
Pooja‡
 b,
Poonam
Jain
a,
Sri Vishnu Kiran
Rompicharla
c,
Shwathy
Ramesan
*d and
Hitesh
Kulhari
 *a
*a
aSchool of Nano Sciences, Central University of Gujarat, Gandhinagar 382030, Gujarat, India. E-mail: hitesh.kulhari@cug.ac.in
bThe Centre for Advanced Materials & Industrial Chemistry (CAMIC), School of Science, RMIT University, Melbourne 3000, Australia
cSynergia Biosciences, School of Science, Bangalore, 560001, India
dSchool of Engineering, School of Science, RMIT University, Melbourne 3000, Australia. E-mail: rameshshwathy@gmail.com
First published on 1st June 2020
Abstract
Chemotherapy is still a major therapeutic approach for the treatment of cancer. Cabazitaxel (CTX) is a highly effective anticancer drug for the treatment of prostate cancer. However, insolubility in water and non-specific drug delivery are major challenges in its application. In this study, we have designed pH-responsive and water-soluble prodrugs of CTX using pluronic F68 and pH-sensitive linkers for its site-specific delivery. The synthesized pluronic F68–CTX conjugates (F68–SA–CTX via a succinoyl linker; and F68–CAA–CTX via a cis-aconityl linker) were characterized through 1H-NMR and FTIR analysis. The nanomicelles of the amphiphilic prodrugs of CTX were self-assembled in water and demonstrated a low critical micelle concentration, a particle size of about 95 nm, monodispersity, spherical shape, and pH-responsive stability. Comparatively, cis-aconityl linker-based nanomicelles exhibited better pH-responsiveness and control over the release of CTX in comparison to succinoyl linker-based nanomicelles. Furthermore, the cis-aconityl linked nanomicelles showed greater inhibition of growth of human prostate cancer cells, stimulated higher ROS generation, decreased mitochondrial membrane potential and induced greater apoptosis without changing the cell cycle arrest mechanism of CTX. Thus, the present prodrug formulation of CTX is more advantageous than its conventional formulation.
1. Introduction
In the past two decades, various drug delivery systems have been developed to improve the therapeutic efficacy and site-specific delivery of anticancer drugs. Most of these systems are based on nanoscience and nanotechnology.1,2 Initially developed nanoscale drug delivery systems were based on passive targeting.3 In this approach, drug loaded nanocarriers i.e. nanomedicines are preferentially accumulated in the tumor tissue due to the enhanced permeability and retention effect resulting from leaky vasculature and impaired lymphatics drainage in rapid-growing tumors.4,5 Subsequently, actively targeting nanoparticles were designed to improve the selectivity of nanomedicines towards cancer cells. In this approach, a targeting ligand is conjugated or coated on the surface of the drug loaded nanoparticles which enhances the binding and uptake of nanoparticles by cancer cells through receptor–ligand interactions.6 Thus, this approach is mostly dependent on the over expression of receptors on cancer cells in comparison to healthy cells. Although several preclinical studies have demonstrated the applicability of this approach, the efficacy of targeted nanoparticles is restricted by the stochastic nature of ligand–receptor interactions, tumor heterogeneity, hypoxia, difficulty in control over the release of drugs, and endosomal escape.7A stimuli-responsive nanoscale delivery system (Sr-NDS) is a powerful strategy to design an advanced therapeutic delivery system for the treatment of different types of cancer. A Sr-NDS responds in a dynamic way to a particular stimulus by recognizing changes in its microenvironment which may be a change in pH, temperature, biochemical levels, presence of a particular enzyme, magnetic field, etc.8 For designing a successful Sr-NDS, a biomaterial is required which not only has the physicochemical properties to respond the stimulus but is also biodegradable and biocompatible. Furthermore, sensitivity towards the stimulus is very important for the selective delivery of the drugs, especially in the case of anticancer nanomedicines.
The aim of this research work was to design a Sr-NDS for improving the delivery of cabazitaxel (CTX), a chemotherapeutic antineoplastic agent approved by FDA in 2010 for the treatment of hormone-refractory prostate cancer. CTX is a second-generation taxane which is specifically designed for hormone-refractory prostate cancer treatment.9–11 CTX was initially formulated in polysorbate 80 and ethanol (13%), known as JEVTANA®, which has been a widely used formulation in clinical settings.12,13 However, the clinical use of CTX is associated with serious side effects such as hypersensitivity reactions, neurotoxicity, bone marrow suppression, fluid retention, diarrhea, nausea, vomiting, numbness, hair loss, etc. due to the non-specific distribution to healthy cells.13,14 Alternatively, nanoformulations, such as micelles, liposomes, albumin nanoparticles and mPEG–PLA–CTX conjugated nanoparticles, have been developed to eliminate the drawbacks of CTX and to deliver it to cancer cells.9,13,15–18 Many of these formulations have been proved successful for the enhancement of the therapeutic efficacy of CTX but these formulations still show drawbacks like low drug loading capacity, instability in body fluid, and burst release of the drug.
To overcome these issues, we developed a self-assembled, pH-sensitive, water-soluble, and stable nanoformulation of CTX through its direct conjugation with a biocompatible polymer. For the designing of CTX-based formulation, pluronic F68 (F68) was selected as a polymeric material because it is highly biocompatible, biodegradable, has a well-known safety profile,19 can self-assemble in aqueous media and moreover, and it has p-glycoprotein inhibition properties that also help to overcome the drug resistance problem for cancer treatment.20–22 For the conjugation of CTX to F68, two pH-sensitive linkers i.e. succinic anhydride and cis-aconitic anhydride were selected to covert the designed formulation into a Sr-NDS. The slightly acidic environment of the tumor tissues (pH ∼ 6.5) and the significant differences in the pH of endosomes (pH ∼ 5–6) and lysosomes (pH ∼ 4–5) due to physiological or blood pH (pH 7.4) provide an opportunity to design pH-responsive formulations for cancer treatment. Among different types of Sr-NDS, a pH-sensitive Sr-NDS is a preferred system because of its well-established protocols, use of low-cost chemicals, simplicity, and non-requirement of specific equipments. To exploit this phenomenon, various pH-sensitive formulations have been developed previously. The conjugation of polymer and drug to prepare pH-sensitive prodrug nanomicelles has attracted widespread interest.23–25 Recently, various polymer–drug conjugates have been developed through pH-sensitive linkers like succinoyl, acetal, cis-acotinyl, hydrazone, thiols, Schiff base, imine, borate and oximes.26 However, the acid-labile chemical bonds have received more attention for the development of pH-sensitive drug delivery systems for cancer therapy.27–30 The acid-labile linker containing a polymer–drug conjugate can only release the drug under an acidic environment into cancer cells.31–33 Hence, in this present study, a polymer–drug conjugated prodrug with an acid-labile bond was designed to retain its stability at blood pH (7.4), and quickly degrade under mild acidic conditions of cancer cells.
2. Experimental section
2.1 Materials
Cabazitaxel (CTX), 4-dimethylaminopyridine (DMAP), cis-aconitic anhydride (CAA), 1-ethyl-3-(3-dimethylaminopropyl) carbodiimide (EDC), hydroxybenzotriazole (HOBt), 3-(4,5-dimethylthiazol-2-yl)-2,5-diphenyl tetrazolium bromide (MTT), calcein-AM, an annexin V-FITC kit, bis benzimide H 33342 trihydrochloride (Hoechst 33342), JC-1, 2′,7′-dichlorofluorescin diacetate (DCFDA), fetal bovine serum (FBS), glutamine, penicillin and streptomycin were purchased from Sigma Aldrich (St. Louis, MO, USA). Succinic anhydride (SA), triethylamine (TEA), diethyl ether and dichloromethane (DCM) were purchased from Rankem (Mumbai, India). Pluronic F68 (F68) was received as a gift sample from BASF (New Jersey, USA).2.2 Synthesis of pluronic F68 and cabazitaxel conjugates via pH sensitive linkers
The conjugation of CTX to pluronic F68 via succinoyl and cis-aconityl linkages (abbreviated as F68–SA–CTX and F68–CAA–CTX, respectively) was carried out by a two step synthesis reaction. First, the hydroxyl group of pluronic F68 (F68) was converted into succinoyl and cis-aconityl groups using succinic anhydride and cis-aconitic anhydride, respectively.34,35 In the second step, succinoyl F68 or cis-aconityl F68 (1.0 eq.), EDC (1.2 eq.) and HOBt (1.2 eq.) were dissolved in anhydrous dichloromethane (DCM) and stirred magnetically for 12 h under N2 conditions. After the activation of the carboxylic group, CTX (1.0 eq.) and DMAP (1.0 eq.) (solubilized in DCM) were added and the reaction was maintained at room temperature for 24 h under N2 conditions. After that, the reaction mixture was transferred in a separating funnel and the brine solution (0.9% NaCl) was added. The DCM layer was separated and dried using anhydrous Na2SO4. DCM was evaporated by the Rotavapour system (IKA RV10 Digital V), and the obtained product was vacuum dried and used for further studies.2.3 Characterizations of F68–SA–CTX and F68–CAA–CTX conjugates
The proton NMR spectra of the synthesized conjugates were recorded using the Bruker 500 MHz Ultra shield plus NMR instrument after dissolving the samples in CDCl3. For the FTIR analysis, the synthesized F68–SA–CTX and F68–CAA–CTX were pelletized with KBr and scanned for % transmittance using a PerkinElmer Spectrum 65 series instrument from 4000 to 400 cm−1.2.4 Determination of critical micelle concentrations of F68–CTX conjugates
The critical micelle concentrations of F68–SA–CTX and F68–CAA–CTX conjugates were determined using our previously validated and reported method.36 A volume of 25 μL of pyrene solution (6 × 10⁻⁷ M) was incubated with various concentrations (50 to 600 μg mL−1) of F68–CTX conjugates at room temperature for 3 h. The samples were excited at a wavelength of 339 nm and emission fluorescence intensities were measured at 383 and 373 nm using a microplate reader (Synergy H1 Hybrid Reader, Biotek; Winooski, VT, USA). The intensity ratio I383/I373versus log![[thin space (1/6-em)]](https://www.rsc.org/images/entities/char_2009.gif) C (μg mL−1) was plotted for the determination of CMC values.
C (μg mL−1) was plotted for the determination of CMC values.
2.5 Preparation of nanomicelles of F68–CTX conjugates
Briefly, 10 mg of F68–SA–CTX or F68–CAA–CTX conjugates was solubilized in 1 mL of acetone and added to 5 mL of water. The prepared dispersion was stirred magnetically at 1000 rpm for 3 h to evaporate acetone. The resultant micelles were filtered through a 0.2 μm syringe filter and used for further experiments. For storage, nanomicelles were lyophilized and kept in a refrigerator until further use. The prepared F68–SA–CTX and F68–CAA–CTX conjugate nanomicelles were termed as CNM-1 and CNM-2, respectively. The percentage drug loading (% DL) of CTX in CNM-1 and CNM-2 was measured using an UV-visible spectrophotometer. The maximum absorbance of CTX was determined at 230 nm. The % DL of CTX was calculated using the following formula:2.6 Characterization of F68-CTX conjugated nanomicelles
2.7 pH-Responsive CTX release
The in vitro CTX release study was performed in two different media i.e. phosphate buffer saline (PBS, pH 7.4) and sodium acetate buffer (SAB, pH 5.0) at 37 °C. Individually CNM-1 and CNM-2 (equivalent of 2 mg of CTX) were transferred into a dialysis bag (MWCO 1000 Da) and then the CNM-1 or CNM-2 containing dialysis bag was placed in 100 mL of release media (PBS pH 7.4 or SAB pH 5.0). At predetermined time intervals, 2 mL of media was taken out and fresh 2 mL of media was added to maintain the sink condition. The withdrawn samples were analysed for % drug content using an UV-visible spectrophotometer.2.8 Stability study of the nanomicelles
The colloidal stability of CNM-1 and CNM-2 was determined by measuring the particle size (nm) and polydispersity index (PDI) using a ZetaSizer Nano ZS 90 (Malvern Instruments, UK) at different time intervals. After 24 h, samples were also analyzed for the change in shape of CNM-1 and CNM-2 through TEM analysis.2.9 Hemolytic toxicity assay
The hemolytic toxicity of CNM-1 and CNM-2 was evaluated according to our previously reported method.6 Briefly, fresh human blood was collected in heparinized tubes and centrifuged at 4000 rpm for 10 min. The supernatant/plasma was collected, and erythrocyte suspension was washed twice with normal saline. The erythrocytes were resuspended in normal saline to make a 2% v/v suspension. Then, varying concentrations (0.5–20 μg mL−1) of the prepared CNM-1 and CNM-2 were incubated with RBC suspensions at 37 °C for 1 h in the dark. Milli-Q water and PBS (pH 7.4) were taken as a positive control (100% hemolysis) and a negative control (0% hemolysis), respectively. After 1 h, samples were centrifuged at 4000 rpm for 10 min. The supernatant was collected and absorbance (A) was measured at 540 nm using a Microplate Reader (Synergy H1 Hybrid Reader, Biotek). The % hemolysis induced by different samples was calculated as follows:2.10 Cell culture
The PC-3 human prostate cancer cell line was obtained from American Type Culture Collection (ATCC, Manassas, VA) and was maintained in Roswell Park Memorial Institute RPMI 1640 medium (Invitrogen, NY) supplemented with 10% fetal bovine serum (FBS), glutamine (2 nmol L−1), penicillin (100 ng mL−1) and streptomycin (100 ng mL−1) at a constant temperature of 37 °C and 5% CO2. The cells were passaged after achieving 70% confluency and the medium was replaced on alternative days. The cells were trypsinised using 0.05% trypsin–EDTA and between 3 and 10 passages were used for experiments.2.11 Determination of 2D anti-proliferative activity
The 2D cytotoxicity study of the pure CTX, CNM-1 and CNM-2 was carried out against PC3 cells with the aid of an MTT assay. About 5 × 10⁴ cells per mL were seeded in 96-well flat bottom plates and allowed to adhere for 24 h before treatments. At 72 h post treatment, a 100 μL of 0.5 mg mL−1 MTT reagent in media was added into each well. The solution was further incubated at 37 °C for 4 h before solubilising the formed formazan crystals in 100 μL of DMSO. The absorbance of the obtained purple/colourless solution was read immediately using a microplate reader (Spectramax) at 570 nm. The percent growth inhibition was calculated as follows: % growth inhibition = (Mean absorbance of drug treated cells/Mean absorbance of untreated cells) × 100. The IC50 values were calculated using Probit software.2.12 3D cell viability assay
PC3 cells were seeded at a seeding density of 3 × 10⁴ cells per mL in Corning® Costar®Ultra-Low attachment 24-well plates. The cells were incubated for 3 days to form a complete spheroid structure in complete RPMI media. The pure CTX, CNM-1 and CNM-2 were added at IC50 concentrations and were incubated for 72 h prior to the addition of Calcein AM and propidium iodide (PI) to stain the live and dead cells, respectively. Images were taken using the ZOE™ Fluorescent Cell Imager (Bio-Rad Laboratories Inc., Hercules, CA, USA) in green and red channels. Quantitative measurements were carried out using a cell titre glow assay. For this, the cells were seeded in Corning 96-well black, spheroid microplates and left to adhere for 3 days similar to the aforementioned live/dead assay. A volume of 100 μL of the CellTiter-Glo® reagent was added to each well containing 100 μL of CTX, CNM-1 and CNM-2 in complete medium. The plates were shaken for 2 min on a shaker to induce cell lysis incubated at room temperature for 10 min before recording the luminescence of the samples.2.13 Cell cycle analysis
PC3 cells (8 × 10⁴ cells per well) were seeded in 12-well plates and were further incubated overnight for attachment. Cells were treated with CTX, CNM-1 and CNM-2 equivalent to their IC50 concentration after 24 h. The vehicle treated wells served as the controls. After 24 h of treatment, each sample containing both the floating and the adherent cells was collected and washed with 150 mM PBS pH 7.4. The obtained pellet was further resuspended in 1 mL of PBS, and added to 9 mL of 70% ethanol under simultaneous vortexing at high speed. The cell suspension was stored at 4 °C for 30 min before the removal of ethanol by centrifugation. The obtained pellet was loosened by gentle tapping and 5 mL of PBS was added to the centrifuge tubes. The tubes were left undisturbed for 15 min to allow sufficient rehydration before centrifugation of the samples at 1000 rpm for 5 min. After 15 min of incubation, 1 mL of propidium iodide staining buffer (PI (200 mg), 0.1% (v/v) Triton X-100, and 2 mg DNAse-free RNAse A (Sigma) in 10 mL of PBS) were added to each sample. The obtained samples were analysed using a BD Accuri™ C6 Flow Cytometer (BD Biosciences, San Jose, CA, USA) for PI fluorescence by observing the intensity in the FL-2 channel. A linear scale was used for the cell cycle while a logarithmic scale was used to determine the sub-G1 fraction.2.14 Hoechst staining
The cells were seeded at a density of 2 × 10⁴ per well in 24-well cell culture plates and incubated for 24 h to render good cell attachment. The culture media was then replaced with media containing CTX, CNM-1 and CNM-2 at IC50 concentrations and incubated for 24 h. The treated cells were fixed with 4% paraformaldehyde which were further stained with Hoechst 33242 (5 μg mL−1) for a period of 15 min at room temperature. The stained cells were washed with 150 mM PBS to remove any excess, unbound dye prior to imaging under fluorescence microscopy (filters, excitation 350 nm and emissions 460 nm) to detect apoptotic cells by observing the intensity of the blue coloured nuclei.2.15 Apoptosis assay by Annexin V-PI staining
To quantify the extent of apoptosis induced by CTX, CNM-1 and CNM-2, flow cytometric analysis was carried out using an Annexin V/propidium iodide (PI) Apoptosis detection kit. The PC3 cells were seeded at 8 × 10⁴ per well in a 12-well plate and left overnight for cell adherence. The cells were treated with CTX, CNM-1 and CNM-2 at IC50 concentrations for 24 h before washing the cells with 150 mM PBS. The washed cells were trypsinised and resuspended in annexin binding buffer with 5 μL Annexin-V/fluorescein isothiocyanate (FITC) and 10 μL PI. The cell suspension was incubated in the dark for 15 min at room temperature before being analysed for red (FL-2) and green channels (FL-1) using a BD Accuri™ C6 Flow Cytometer (BD Biosciences, San Jose, CA, USA).2.16 Measurement of reactive oxygen species (ROS) levels
The ROS measurement was accompanied by the addition of DCFDA containing media to the treated cells as mentioned above for the other assays. The ROS assay was carried out in a 24 well plate with 2 × 10⁴ cells per well. After the treatment, the media was replaced with culture media containing 10 μM carboxy-DCFDA which was further incubated for 30 min at room temperature. All the incubation was carried out in the dark to protect the light sensitive DCFDA compound. The cells were washed with PBS and fluorescence images were captured using a microscope (ZOE™ Fluorescent Cell Imager, Bio-Rad Laboratories Inc., Hercules, CA, USA).2.17 Measurement of mitochondrial membrane potential (MMP)
PC3 cells were seeded (2 × 10⁴ per well) in a 24-well plate and allowed to adhere overnight. The cells were treated with CTX, CNM-1 and CNM-2 at IC50 concentrations. After 24 h of treatment, the cells were washed with 150 mM PBS (pH 7.4). A stock solution of 2 mg mL−1 JC-1 dye was prepared and stored at −20 °C prior to the staining procedure. To measure the MMP, the stock JC-1 aliquot was reconstituted to a final concentration of 1 μg mL−1 in 150 mM PBS, with the addition of 0.5 mL of the prepared JC-1 solution to each well. The cells were incubated at 37 °C for 20 min. The structural influence of the drugs on the mitochondrial membrane was inferred from its potential state by examining the relative fluorescence between its green monomeric (depolarised) form at 585 nm via excitation at 514 nm with that of its red aggregated (hyperpolarised) form at 590 nm through excitation at 529 nm, using a microscope (ZOE™ Fluorescent Cell Imager, Bio-Rad Laboratories Inc., Hercules, CA, USA).2.18 Statistical analysis
Data are expressed as the mean ± standard deviation. Significant differences were calculated by ANOVA analysis and p values <0.05 were considered statistically significant.3. Results and discussion
3.1 Characterizations of F68-CTX conjugates
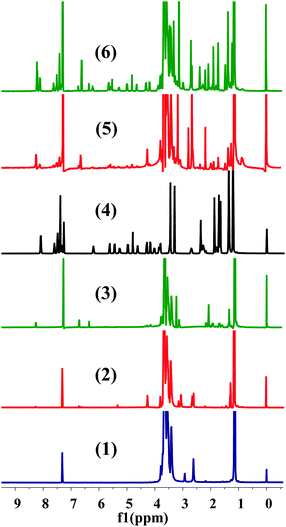
The conjugation of CTX to F68 was achieved using a two-step chemical reaction (Fig. S1, ESI†). In the first step, the –OH terminated pluronic F68 was converted into a –COOH group containing F68 by conjugating with succinic anhydride (SA) and cis-aconityl anhydride (CAA). Succinoyl F68 and cis-aconityl F68 were further conjugated to CTX through an esterification reaction. The finally synthesized conjugates (F68–SA–CTX and F68–CAA–CTX) were characterized by 1H-NMR (Fig. 1) and FTIR analysis (Fig. S2, ESI†). The succinoyl –CH2 peaks at δ 2.65–2.67 ppm, and peaks of cis-aconityl F68 at δ 6.71 and 6.36 ppm (alkene) and δ 2.08 ppm (–CH2) confirmed the successful formation of succinoyl F68 and cis-aconityl F68, respectively. In the case of the F68–SA–CTX conjugate, the phenyl peaks of CTX (δ 7.06–7.61 ppm)37 and characteristic peaks of F68 (δ 3.65 ppm –CH2 of PEO) of F68, δ 2.78 ppm (–CH2 of PPO of F68), δ 2.18–2.66 (–CH2–CH–(CH3)–O–) of PPO of F68 and δ 0.88–1.47 (CH3–O– of PPO of F68)38 confirmed the synthesis of the F68–SA–CTX conjugate. Similarly, the phenyl peaks of CTX (δ 7.33–7.59 ppm)37 and characteristic peaks of F68 (δ 3.65 ppm –CH2) of PEO of F68, δ 2.96 ppm (–CH2 of PPO of F68), δ 2.65–2.82 (–CH2–CH–(CH3)–O–) of PPO of F68 and δ 0.84–1.88 (CH3–O– of PPO of F68)38 were clearly observed in the F68–CAA–CTX conjugate (Fig. 1).The synthesis of F68–CTX conjugates was further confirmed by FTIR analysis (Fig. S2, ESI†). In the FTIR spectrum of F68–SA–CTX, the peaks observed at 1713 and 1648 cm−1 (![[double bond splayed left]](https://www.rsc.org/images/entities/char_e009.gif) C
C![[double bond, length as m-dash]](https://www.rsc.org/images/entities/char_e001.gif) O stretching),36 1563, 1464 and 1351 cm−1 (C
O stretching),36 1563, 1464 and 1351 cm−1 (C![[double bond, length as m-dash]](https://www.rsc.org/images/entities/char_e001.gif) C stretching, –CH3 bending and –C–N stretching of CTX)39 confirmed the successful conjugation of F68–SA–CTX. Similarly, in the FTIR spectrum of F68–CAA–CTX, the peaks observed at 1723 and 1643 cm−1 (
C stretching, –CH3 bending and –C–N stretching of CTX)39 confirmed the successful conjugation of F68–SA–CTX. Similarly, in the FTIR spectrum of F68–CAA–CTX, the peaks observed at 1723 and 1643 cm−1 (![[double bond splayed left]](https://www.rsc.org/images/entities/char_e009.gif) C
C![[double bond, length as m-dash]](https://www.rsc.org/images/entities/char_e001.gif) O stretching), and 1561, 1466 and 1346 cm−1 (C
O stretching), and 1561, 1466 and 1346 cm−1 (C![[double bond, length as m-dash]](https://www.rsc.org/images/entities/char_e001.gif) C stretching, –CH3 bending and –C–N stretching of CTX)39 were clearly observed in the FTIR spectrum of the F68–CAA–CTX conjugate. Therefore, the presence of both CTX and F68 FTIR peaks in the F68–SA–CTX and F68–CAA–CTX conjugates confirmed the successful conjugation.
C stretching, –CH3 bending and –C–N stretching of CTX)39 were clearly observed in the FTIR spectrum of the F68–CAA–CTX conjugate. Therefore, the presence of both CTX and F68 FTIR peaks in the F68–SA–CTX and F68–CAA–CTX conjugates confirmed the successful conjugation.
3.2 Determination of critical micelle concentration
CMC values of a micelle system are important parameters which indicate its stability after administration into the body. A lower CMC value is desirable to form stable micelles. To consider the self-assembling behaviour of F68–CTX conjugates, the CMC value was determined using the fluorescence pyrene method. The emission intensity ratio (I383/I373) drastically changed from a concentration of 200 μg mL−1 (Fig. S3, ESI†) which confirmed the CMC value of the F68–CTX conjugates. The CMC value for pluronic F68 is reported to be 4.008 mg mL−1.20 Thus, the CMC values of the F68–SA–CTX and F68–CAA–CTX conjugates were 20 times less than the CMC value of F68. The CMC value of both conjugates was observed to be the same which confirmed that there was no significant role of linkers in the formation of micelles. The observed lower CMC value of the F68–CTX conjugates indicated their greater stability compared with the micelles formed by native pluronic F68.40,413.3 Physicochemical characterizations of nanomicelles
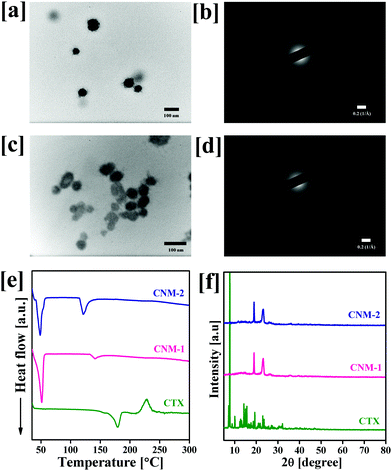
The size of the prepared nanomicelles was determined by DLS and TEM analysis. The particle size, polydispersity index and zeta potential of the prepared nanomicelles were found to be 95.7 ± 3.5 nm, 0.322 ± 0.015 and −13.6 ± 1.3 mV for CNM-1, and 94.8 ± 5.1 nm, 0.315 ± 0.008 PDI and −15.9 ± 1.1 mV for CNM-2, respectively. The observed results suggest the formation of monodispersed nanomicelles of both synthesized conjugates in water after self-assembly. The resulting CNM-1 and CNM-2 showed % DL values of 6.32 ± 0.22% and 6.21 ± 0.30%, respectively. Fig. 2a–d show the TEM images and SAED patterns of nanomicelles which were spherical in shape with 58.9 ± 7.7 nm and 42.5 ± 3.7 nm for CNM-1 and CNM-2, respectively. The SAED patterns of CNM-1 and CNM-2 did not show any diffraction spots and therefore confirmed the amorphous nature of the nanomicelles. To determine the physical state of CNM-1 and CNM-2, DSC and PXRD analyses were performed. As shown in Fig. 2e, the pure CTX showed the characteristic endothermic peak at 178 °C corresponding to its melting point. This typical peak of CTX was not observed in the CNM-1 and CNM-2 which clearly suggested that CTX was molecularly dispersed in the core of the nanomicelles. Fig. 2f shows the XRD patterns of pure CTX, CNM-1 and CNM-2. The XRD pattern of CTX clearly shows a number of sharp peaks at the 2θ angles of 7.0°, 7.8°, 8.9°, 10.1°, 12.3°, 12.6°, 14.1°, 15.5°, 17.5°, 19.2°, 20.9°, 21.8°, 22.9°, 23.5°, 27.2° and 32.1° indicating the crystalline nature of pure hydrophobic CTX. However, with CNM-1 and CNM-2, no such sharp peaks of CTX were observed. The CNM-1 and CNM-2 showed only two sharp peaks at 2θ angles of 18.8° and 23.1° which were obtained due to the presence of F68. These data further confirm that the drug is in an amorphous phase in nanomicelles.3.4 Stimuli-responsive stability of nanomicelles
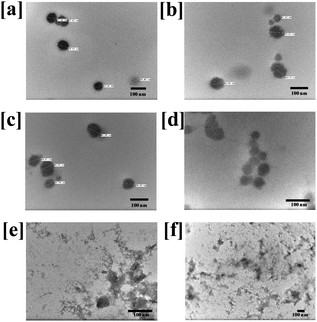
For the clinical application of the therapeutic nanomicelles, high physicochemical stability is required to achieve long term blood circulation and accumulation in tumor tissues. However, nanomicelles also dissemble near tumor-tissues after entering the cells. Therefore, to check the pH-sensitive disassembly of the prepared CTX conjugated nanomicelles, particle size and PDI were measured in water (pH 7.0), PBS (7.4) and SAB (pH 5.0). As shown in Fig. S4 (ESI†), after 12 h of incubation in water, the particle size and PDI were changed from 95 to 104 nm and 0.322 to 0.328 for CNM-1; and from 94 to 104 nm and 0.315 to 0.338 for CNM-2, respectively. In PBS, the particle size and PDI were changed from 96 to 112 nm and 0.307 to 0.417 for CNM-1; and from 95 to 106 nm and 0.315 to 0.337 for CNM-2, respectively.In the case of SAB, the particle size and PDI of both the nanomicelle systems were increased significantly after incubation for 12 h. The size of CNM-1 was increased from 107 to 166 nm and the PDI was increased from 0.291 to 0.539. Similarly, the size of CNM-2 was increased from 103 to 350 nm while the PDI changed from 0.318 to 0.927 (Fig. S4, ESI†). These observed particle size and PDI results suggest that the prepared nanomicelles were stable in water and PBS but highly unstable in SAB which could be due to the rapid hydrolysis of pH-sensitive linkers at acidic pH.42 The hydrolysis of pH-sensitive linkages at acidic pH led to breakage of the bonding between F68 and CTX and dissembling of the micelles which resulted in increased size and polydispersity. While comparing two nanomicelles systems, the higher particle size and PDI were observed within 6 h with CNM-2, indicating that the cis-acotinyl linkage is more rapidly hydrolysed than the succinoyl linkage. To further confirm the hydrolysis of the linkage and dissembling of nanomicelles, TEM analysis was performed. The results of the change in the morphology of the CNM-1 and CNM-2 after incubation for 12 h in water, PBS and SAB are shown in Fig. 3, and provide more insight into the effect of media or pH-stimulation on the CTX nanomicelles. The TEM images indicate distinct morphological changes with the disintegration of the nanomicelles. In water and PBS, the nanomicelles were well intact after 12 h of incubation. However, after incubation in SAB, nanomicelles were distorted due to the rapid hydrolysis of pH sensitive linkers in CNM-1 and CNM-2. These results clearly indicate that the cis-aconityl-linked CNM-2 was more likely to be cleaved in an endosomal pH environment while being stable in a normal physiological environment.
3.5 In vitro hemolytic toxicity
In order to verify the biocompatibility of the synthesized nanomicelles, a hemolytic toxicity assay was performed. As shown in Fig. S5 (ESI†), the nanomicelles prepared with synthesised conjugates did not show any sign of disruption of the RBC membrane and release of haemoglobin. Quantitatively, the observed hemolysis percentage was less than 1% at the tested concentrations and confirmed that both the prepared nanomicelles i.e. CNM-1 and CNM-2 were biocompatible and could be used as a safe carrier for CTX.3.6 In vitro CTX release study
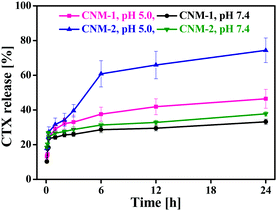
The CTX release behaviour of CNM-1 and CNM-2 was assessed by dialysing the formulations at 37 °C in sodium acetate buffer (SAB, pH 5.0) and phosphate buffered saline (PBS, pH 7.4). As shown in Fig. 4, the release of CTX from CNM-1 and CNM-2 was greatly affected by the environmental pH value of 5.0. Approximately 46% and 33% of CTX was released from CNM-1 within 24 h in SAB pH 5.0 and PBS pH 7.4, respectively. Similarly, about 75% and 37% of CTX was released from CNM-2 within 24 h in SAB pH 5.0 and PBS pH 7.4, respectively.Thus, CTX was released faster from the nanomicelles in acidic buffer as compared to the physiological buffer PBS. These results clearly indicate that the synthesized CTX conjugates are acid-sensitive and more likely to be cleaved in the acidic endosomal compartments or tumor site while remaining stable in a physiological environment at pH 7.4. Furthermore, comparing the release of CTX from nanomicelles at acidic pH, it was found that CTX was released more from CNM-2 (75%) than from CNM-1 (46%). This suggests that the cis-aconityl linkage is more acid sensitive than the succinoyl linkage. Also, these results were in agreement with those observed in the stability studies.
3.7 In vitro cytotoxicity
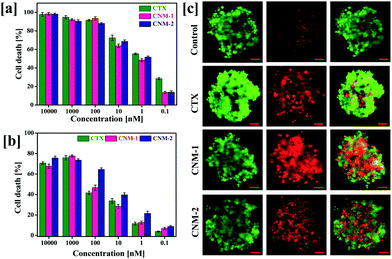
The cytotoxic concentrations of pure CTX, CNM-1 and CNM-2 were determined against PC3 human prostate cancer cell lines by MTT assays at varying concentrations (10![[thin space (1/6-em)]](https://www.rsc.org/images/entities/char_2009.gif) 000–0.1 nM) after 72 h of exposure.43 The concentration of the compounds required for 50% inhibition of the cell growth (IC50) was determined (Fig. 5a). It was observed that the IC50 concentration for the pure CTX, CNM-1 and CNM-2 was found to be 0.75 nM, 2.17 and 1.97 nM, respectively (Table 1). These results prove that the CTX nanomicelle formulations significantly control the growth of human prostate cancer cells and that the bioconjugation of CTX to F68 does not considerably affect the biological activity of CTX.
000–0.1 nM) after 72 h of exposure.43 The concentration of the compounds required for 50% inhibition of the cell growth (IC50) was determined (Fig. 5a). It was observed that the IC50 concentration for the pure CTX, CNM-1 and CNM-2 was found to be 0.75 nM, 2.17 and 1.97 nM, respectively (Table 1). These results prove that the CTX nanomicelle formulations significantly control the growth of human prostate cancer cells and that the bioconjugation of CTX to F68 does not considerably affect the biological activity of CTX.
| Sample | IC50 (nM) |
|---|---|
| Pure CTX | 0.75 ± 0.09 |
| CNM-1 | 2.17 ± 0.30 |
| CNM-2 | 1.97 ± 0.42 |
3.8 Effect on 3D multi-cellular spheroids
The 2D MTT assay results were further extended to the assessment of cytotoxicity of CTX nanomicelles in a 3D spheroid system. Due to the close resemblance of the 3D spheroid system with the tumour microenvironment, the viability assays was carried out in 3D multicellular spheroids to assess the IC50 values of the pure CTX, CNM-1 and CNM-2.44 Live/dead staining was carried out on spheroids after treatment with CTX, CNM-1 and CNM-2. The CNM-1 and CNM-2 showed comparable amounts of cell death while CTX showed the lowest number of cell deaths. Quantitative measurements of cell death in spheroids were also analysed with the help of a cell titer glow assay as shown in Fig. 5b. CNM-2 showed a significantly higher cell death percentage (64.54%) at 100 nM as compared to CTX (41.6%) and CNM-1 (46.6%) (Fig. 5c). CNM-2 demonstrated higher cell death rates as compared to CTX and CNM-1 consistently for all concentrations, thus re-insisting the higher efficacy of CNM-2 in inhibiting cancer cell growth and proliferation (Table 2).| Sample | IC50 (nM) |
|---|---|
| Pure CTX | 181.43 ± 11.2 |
| CNM-1 | 177.05 ± 10.5 |
| CNM-2 | 52.55 ± 3.7 |
3.9 Cell cycle analysis
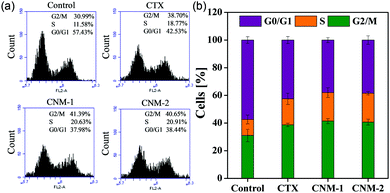
The nanomicelles were investigated in terms of their influence on the cell cycle progression for a better understanding of the mode of action elicited by CTX, CNM-1 and CNM-2 on cancer cells.45,46 The distribution of treated and untreated (control) cells in different phases of the cell cycle is shown in Fig. 6. The findings clearly show evidence of G2/M cycle arrest with the percentages increasing from 30.9% for untreated cells to 41.3% for CNM-1 and 40.6% for CNM-2. These results correlate well with previously published reports.46 It is also noteworthy to observe the simultaneous reduction in the G0/G1 phase values from 57.43% for untreated cells to 37.9% to CNM-1 treated cells and to 38.44% for CNM-2 treated cells. Thus, the results suggest that the cell cycle arrest mechanism of CTX was not altered in nanomicelle formulations but the activity was increased.3.10 Nuclear morphological changes
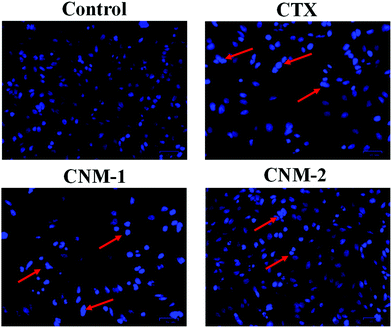
To investigate the effect of the compounds on the nuclear morphology, Hoechst 33342 staining was performed and considerable morphological changes in the nuclear chromatin and DNA condensation were observed.47 The cells were treated with CTX, CNM-1 and CNM-2 at IC50 concentrations for 48 h before the addition of the nucleus staining dye. The changes were observed under the microscope revealing distinct apoptotic characteristics such as cell shrinkage, bright condensed nuclear changes with CNM-1 and CNM-2 while the nucleus of the control cells did not show stronger blue fluorescence indicating non-apoptotic cells (Fig. 7).3.11 Annexin V-PI staining
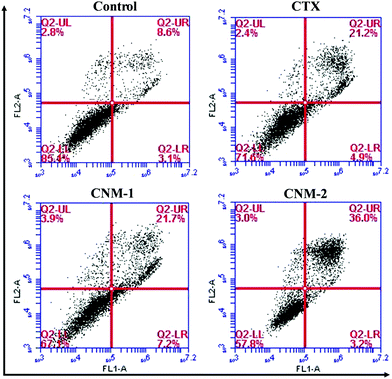
In addition to the identification of apoptosis through nuclear staining, Annexin V-FITC/PI staining was performed to quantify and to differentiate between the early apoptotic, late apoptotic and necrotic cells.48 The cells positively stained only for Annexin V-FITC were mostly early apoptotic cells while the cells stained for both PI and Annexin V-FITC were considered to be late apoptotic cells. The fourth quadrant consisting solely of PI staining comprises necrotic or dead cells. It is evident from the flow cytometry results as seen in Fig. 8 that CNM-2 has the highest percentage of total apoptotic cells (39.2%). CTX and CNM-1 showed an almost similar effect with 26.1% and 28.9% of total apoptotic cells, respectively.3.12 ROS induction analysis
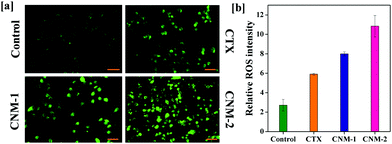
The generation of reactive species (ROS) is one of the paramount phenomena which has been linked to various anti-proliferative processes. An increase in ROS levels in the mitochondria eventually results in elevated oxidative stress which in turn damages the mitochondrial membrane leading to apoptosis.49–51 The ROS generation is examined with the help of carboxy-2,7-dichlorofluorescein diacetate (carboxy-DCFDA) dye, which upon cleavage by intracellular esterases oxidizes to highly fluorescent carboxy-2,7-dichlorofluorescein (carboxy-DCF).52,53 As observed in Fig. 9a, CNM-2 showed a sharp increase in green fluorescence while CTX remained fairly less intense with CNM-1 showing higher fluorescence than CTX but slightly lower than that of CNM-2. This increase in the green fluorescence in cells treated with CNM-1 and CNM-2 indicates an increase in ROS in the cells and therefore, results in greater conversion of non-fluorescent DCFDA to fluorescent DCF molecules. The quantitative analysis of the intensity (Fig. 9b) revealed a 4-fold difference in ROS generation between the untreated and CNM-2 treated cells while the fold difference varied by a factor of 2.9 for CNM-1.3.13 Measurement of mitochondrial membrane potential (MMP)
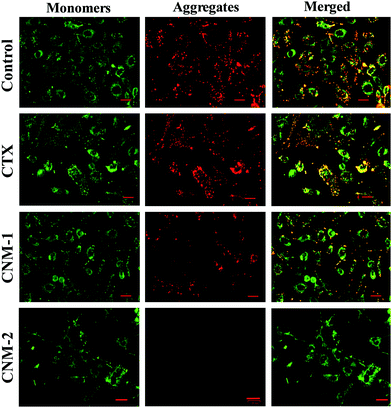
The effect of the pure CTX, CNM-1 and CNM-2 on the mitochondrial membrane damage was investigated by the addition of JC-1 staining after the treatment of cells with the prepared formulations. Polarised mitochondria are prominently marked by orange-red punctuated, fluorescence staining. Upon depolarisation, the orange-red punctuated staining is replaced by bright green monomer fluorescence indicating depolarisation.54 The untreated/control cells and CTX-treated cells showed intense red fluorescence, indicating the formation of aggregates and thus suggesting an intact mitochondrial membrane (Fig. 10). The CNM-1 treated cells also showed the formation of few aggregates but with less intensity, while CNM-2 treated cells did not show the formation of aggregates. This, in turn, suggests that the maximum loss of the membrane potential was caused by CNM-2 followed by CNM-1 and finally by the free CTX. The untreated cells did not show much sign of depolarisation and hence would not enter apoptosis induced by mitochondrial membrane potential loss.4. Conclusions
In summary, we successfully developed surfactant conjugated and pH-responsive prodrug-based nanomicelles with two different pH-sensitive linkers i.e. the succinoyl linker and the cis-aconityl linker. The prepared nanomicelles showed nanoscale particle size, biocompatibility, pH-dependent stability, controlled drug release, and effective cytotoxicity to the PC3 human prostate cancer cells. The cis-aconityl linker based nanomicelles (CNM-2) showed a considerably faster drug release at acidic pH than succinoyl linker-based nanomicelles (CNM-1). CNM-2 also presented notable advantages of stability and superior cytotoxicity towards 3D spheroids of human prostate cancer cells. The IC50 values for pure CTX, CNM-1 and CNM-2 against 3D spheroids were 181, 177 and 52 ng mL−1, respectively. Furthermore, CNM-2 exhibited an increase in ROS generation, a decrease in MMP and the induction of more apoptosis than pure CTX. Thus, the cis-aconityl linker-based conjugated nanomicelles could be a more efficient delivery system for anticancer drugs.Conflicts of interest
The authors declare no conflicts of interest.Acknowledgements
Authors thank the Central University of Gujarat, Gandhinagar for providing the necessary facilities and support. HK acknowledges the Department of Science and Technology (DST), New Delhi for an INSPIRE Faculty Award. AKJ and PJ acknowledge the University Grant Commission, New Delhi for PhD fellowships. The authors gratefully acknowledge the UGC-DAE Consortium for Scientific Research, Indore, M.P., India, for the XRD analysis.References
- A. Sharma, S. V. Madhunapantula and G. P. Robertson, Expert Opin. Drug Metab. Toxicol., 2012, 8, 47–69 CrossRef CAS PubMed
.
- L. Li, W. W. Yang and D. G. Xu, J. Drug Targeting, 2019, 27, 423–433 CrossRef CAS PubMed
.
- F. Luo, Z. Fan, W. Yin, L. Yang, T. Li, L. Zhong, Y. Li, S. Wang, J. Yan, Z. Hou and Q. Zhang, Mater. Sci. Eng., C, 2019, 105, 110107 CrossRef CAS PubMed
.
- S. K. Golombek, J.-N. May, B. Theek, L. Appold, N. Drude, F. Kiessling and T. Lammers, Adv. Drug Delivery Rev., 2018, 130, 17–38 CrossRef CAS PubMed
.
- R. Bazak, M. Houri, S. El Achy, W. Hussein and T. Refaat, Mol. Clin. Oncol., 2014, 2, 904–908 CrossRef PubMed
.
- P. Jain, S. Bhagat, L. Tunki, A. K. Jangid, S. Singh, D. Pooja and H. Kulhari, ACS Appl. Mater. Interfaces, 2020, 12, 10170–10182 CrossRef PubMed
.
- K. G. Gurevich, P. S. Agutter and D. N. Wheatley, Cell. Signalling, 2003, 15, 447–453 CrossRef CAS PubMed
.
- S. Mura, J. Nicolas and P. Couvreur, Nat. Mater., 2013, 12, 991–1003 CrossRef CAS PubMed
.
- N. Kommineni, S. Mahira, A. J. Domb and W. Khan, Pharmaceutics, 2019, 11, 1–22 CrossRef PubMed
.
- A. Abidi, J. Pharmacol. Pharmacother., 2013, 4, 230–237 CrossRef CAS PubMed
.
- C. J. Paller and E. S. Antonarakis, Drug Des., Dev. Ther., 2011, 117–124 CAS
.
- R. Naik and M. A. Khan, Mol. Clin. Oncol., 2017, 6, 341–343 CrossRef CAS PubMed
.
- B. Zhuang, L. Du, H. Xu, X. Xu, C. Wang, Y. Fan, M. Cong, J. Yin, H. Li and H. Guan, Int. J. Pharm., 2016, 499, 146–155 CrossRef CAS PubMed
.
- N. Nishiyama, Y. Matsumura and K. Kataoka, Cancer Sci., 2016, 107, 867–874 CrossRef CAS PubMed
.
- O. Aydin, I. Youssef, Y. Yuksel Durmaz, G. Tiruchinapally and M. E. H. Elsayed, Mol. Pharmaceutics, 2016, 13, 1413–1429 CrossRef CAS PubMed
.
- Y. Sun, Y. Zhao, S. Teng, F. Hao, H. Zhang, F. Meng, X. Zhao, X. Zheng, Y. Bi, Y. Yao, R. J. Lee and L. Teng, Int. J. Nanomed., 2019, 14, 135–148 CrossRef CAS PubMed
.
- P. Xue, D. Liu, J. Wang, N. Zhang, J. Zhou, L. Li, W. Guo, M. Sun, X. Han and Y. Wang, Bioconjugate Chem., 2016, 27, 1360–1372 CrossRef CAS PubMed
.
- F. Bensaid, O. Thillaye du Boullay, A. Amgoune, C. Pradel, L. Harivardhan Reddy, E. Didier, S. Sablé, G. Louit, D. Bazile and D. Bourissou, Biomacromolecules, 2013, 14, 1189–1198 CrossRef CAS PubMed
.
- A. M. Bodratti and P. Alexandridis, J. Funct. Biomater., 2018, 9, 11–35 CrossRef PubMed
.
- Y. Song, Q. Tian, Z. Huang, D. Fan, Z. She, X. Liu, X. Cheng, B. Yu and Y. Deng, Int. J. Nanomed., 2014, 9, 2307–2317 Search PubMed
.
- D. Y. Alakhova and A. V. Kabanov, Mol. Pharmaceutics, 2014, 11, 2566–2578 CrossRef CAS PubMed
.
- D. Pooja, H. Kulhari, M. Kuncha, S. S. Rachamalla, D. J. Adams, V. Bansal and R. Sistla, Mol. Pharmaceutics, 2016, 13, 3903–3912 CrossRef CAS PubMed
.
- X. Zhang, D. Li, J. Huang, K. Ou, B. Yan, F. Shi, J. Zhang, J. Zhang, J. Pang, Y. Kang and J. Wu, J. Mater. Chem. B, 2019, 7, 251–264 RSC
.
- Y. Ou, K. Chen, H. Cai, H. Zhang, Q. Gong, J. Wang, W. Chen and K. Luo, Biomater. Sci., 2018, 6, 1177–1188 RSC
.
- J. Mao, Y. Li, T. Wu, C. Yuan, B. Zeng, Y. Xu and L. Dai, ACS Appl. Mater. Interfaces, 2016, 8, 17109–17117 CrossRef CAS PubMed
.
- X. Pang, Y. Jiang, Q. Xiao, A. W. Leung, H. Hua and C. Xu, J. Controlled Release, 2016, 222, 116–129 CrossRef CAS PubMed
.
- K. Chen, S. Liao, S. Guo, H. Zhang, H. Cai, Q. Gong, Z. Gu and K. Luo, Sci. China Mater., 2018, 61, 1462–1474 CrossRef CAS
.
- Z. S. Liao, S. Y. Huang, J. J. Huang, J. K. Chen, A. W. Lee, J. Y. Lai, D. J. Lee and C. C. Cheng, Biomacromolecules, 2018, 19, 2772–2781 CrossRef CAS PubMed
.
- H. Wang, M. C. Sobral, T. Snyder, Y. Brudno, V. S. Gorantla and D. J. Mooney, Biomater. Sci., 2020, 8, 266–277 RSC
.
- S. Kaur, C. Prasad, B. Balakrishnan and R. Banerjee, Biomater. Sci., 2015, 3, 955–987 RSC
.
- G. Kocak, C. Tuncer and V. Bütün, Polym. Chem., 2017, 8, 144–176 RSC
.
- H. Wang, Q. Huang, H. Chang, J. Xiao and Y. Cheng, Biomater. Sci., 2016, 4, 375–390 RSC
.
- J. Li, Z.-E. Hu, X.-L. Yang, W.-X. Wu, X. Xing, B. Gu, Y.-H. Liu, N. Wang and X.-Q. Yu, Biomater. Sci., 2019, 7, 3277–3286 RSC
.
- Y. Liang, Z. Su, Y. Yao and N. Zhang, Materials, 2015, 8, 379–391 CrossRef CAS PubMed
.
- X. Bin Fang, J. M. Zhang, X. Xie, D. Liu, C. W. He, J. B. Wan and M. W. Chen, Int. J. Pharm., 2016, 502, 28–37 CrossRef PubMed
.
- A. K. Jangid, H. Agraval, N. Gupta, U. C. S. Yadav, R. Sistla, D. Pooja and H. Kulhari, Colloids Surf., B, 2019, 175, 202–211 CrossRef CAS PubMed
.
- M. K. Khoeeniha, M. Esfandyari-Manesh, H. Behrouz, M. Amini, B. S. Varnamkhasti, F. Atyabi and R. Dinarvand, Curr. Drug Delivery, 2017, 14, 1120–1129 CAS
.
- Y. Cai, Z. Sun, X. Fang, X. Fang, F. Xiao, Y. Wang and M. Chen, Drug Delivery, 2016, 23, 2587–2595 CrossRef CAS PubMed
.
- Y. Shao, C. Zhang, Q. Yao, Y. Wang, B. Tian, X. Tang and Y. Wang, Eur. J. Pharm. Sci., 2014, 52, 1–11 CrossRef CAS PubMed
.
- V. Khare, W. Al Sakarchi, P. N. Gupta, A. D. M. Curtis and C. Hoskins, RSC Adv., 2016, 6, 60126–60137 RSC
.
- D. Tang, X. Zhao, T. Yang and C. Wang, RSC Adv., 2018, 8, 380–389 RSC
.
- B. Ma, W. Zhuang, G. Liu and Y. Wang, Regener. Biomater., 2018, 5, 15–24 CrossRef CAS PubMed
.
- S. Ramesan, A. R. Rezk, K. W. Cheng, P. P. Y. Chan and L. Y. Yeo, Lab Chip, 2016, 16, 2820–2828 RSC
.
- T. S. Reddy, S. H. Privér, N. Mirzadeh and S. K. Bhargava, Eur. J. Med. Chem., 2018, 145, 291–301 CrossRef CAS PubMed
.
- J. M. Pérez Martín, P. Fernández Freire, V. Labrador and M. J. Hazen, Mutat. Res., Fundam. Mol. Mech. Mutagen., 2008, 637, 124–133 CrossRef PubMed
.
- J. Reyes, J.-Y. Chen, J. Stewart-Ornstein, K. W. Karhohs, C. S. Mock and G. Lahav, Mol. Cell, 2018, 71, 581–591 CrossRef CAS PubMed
.
- M. Gulfam, T. Matini, P. F. Monteiro, R. Riva, H. Collins, K. Spriggs, S. M. Howdle, C. Jérôme and C. Alexander, Biomater. Sci., 2017, 5, 532–550 RSC
.
- H. Kulhari, D. Pooja, S. Shrivastava, M. Kuncha, V. G. M. Naidu, V. Bansal, R. Sistla and D. J. Adams, Sci. Rep., 2016, 6, 1–13 CrossRef PubMed
.
- H. Kulhari, D. Pooja, R. Kota, T. S. Reddy, R. F. Tabor, R. Shukla, D. J. Adams, R. Sistla and V. Bansal, Mol. Pharmaceutics, 2016, 13, 1491–1500 CrossRef CAS PubMed
.
- K. A. Szychowski, K. Rybczyńska-Tkaczyk, M. L. Leja, A. K. Wójtowicz and J. Gmiński, Environ. Sci. Pollut. Res., 2016, 23, 12246–12252 CrossRef PubMed
.
- N. Kumar, R. Afjei, T. F. Massoud and R. Paulmurugan, Sci. Rep., 2018, 8, 16363 CrossRef PubMed
.
- F. Q. Cao, M. M. Yan, Y. J. Liu, L. X. Liu, L. Lu, H. Wang, C. Zhang, H. F. Sun, D. L. Kong and G. L. Ma, Biomater. Sci., 2018, 6, 473–477 RSC
.
- B. Yang, K. Wang, D. Zhang, B. Sun, B. Ji, L. Wei, Z. Li, M. Wang, X. Zhang, H. Zhang, Q. Kan, C. Luo, Y. Wang, Z. He and J. Sun, Biomater. Sci., 2018, 6, 2965–2975 RSC
.
- S. Ramesan, A. R. Rezk, C. Dekiwadia, C. Cortez-Jugo and L. Y. Yeo, Nanoscale, 2018, 10, 13165–13178 RSC
.
Footnotes |
| † Electronic supplementary information (ESI) available. See DOI: 10.1039/d0ma00189a |
| ‡ These authors contributed equally. |
| This journal is © The Royal Society of Chemistry 2020 |


