 Open Access Article
Creative Commons Attribution 3.0 Unported Licence
Sulfonated poly(ether sulfone) based sulfonated molybdenum sulfide composite membranes: proton transport properties and direct methanol fuel cell performance†
Vikrant
Yadav
ab,
Nagaraju
Niluroutu
c,
Santoshkumar D.
Bhat
 bc and
Vaibhav
Kulshrestha
 *ab
*ab
aCSIR-Central Salt & Marine Chemicals Research Institute, Gijubhai Badheka Marg, Bhavnagar 364 002, Gujarat, India. E-mail: vaibhavphy@gmail.com; vaibhavk@csmcri.res.in
bAcademy of Scientific & Innovative Research (AcSIR), Ghaziabad 201002, India
cCSIR-Central Electrochemical Research Institute-Madras Unit, Chennai, India
First published on 27th May 2020
Abstract
Composite membranes of sulfonated poly(ether sulfone) (sPES) are prepared in combination with sulfonated molybdenum sulfide (s-MoS2) as an alternative polymer electrolyte for direct methanol fuel cells (DMFC). Hydrothermally prepared MoS2 is functionalized using 1,3-propanesultone as a sulfonating media and confirmed via FTIR and XPS analysis. The synthesized composite membranes are characterized for their water content, ion exchange capacity (IEC), proton conductivity and thermo-mechanical stabilities. The suitability of composite membranes for DMFC applications is assessed in terms of their methanol cross-over resistance. The composite membranes show better methanol permeation resistance compared to pristine sPES membranes, as s-MoS2 acts as a barrier for methanol and provides a conduction path for the proton. Composite membrane with 5 wt% of s-MoS2 shows 91% reduction in methanol crossover and almost four-fold higher electrochemical selectivity compared to a sPES membrane.
1. Introduction
Clean energy for society is a critical issue nowadays. Globally, major energy production is based on fossil fuels that strongly affects the environment. In order to overcome this issue, there is a critical need of alternate means for power generation without disturbing the eco-system.1–3 Fuel cells may be a viable solution as next-generation energy conversion devices. Among the fuel cells, direct methanol fuel cells (DMFC) have been widely accepted and investigated for portable applications due to the high energy density of methanol and its ease of storage compared to hydrogen.4–6 Proton exchange membrane (PEM) with high proton conductivity, thermo-mechanical stability, and low electro-osmotic drag is an ideal candidate as a polymer electrolyte in DMFCs.7,8Perfluorosulfonic acid based Nafion is commercially used PEM for DMFC owing to its unique properties. However, a major drawback associated with it high methanol crossover which poisons the precious Pt catalyst at the cathode, ultimately lowering the performance of membrane electrode assembly.9–11 Furthermore, Nafion is expensive considering the commercial aspects of DMFC. Hence, the development of alternative PEM is important to address the above issues associated with Nafion. Recently, alternative composite membranes based on sulfonated poly(vinylidene fluoride-co-hexafluoropropylene),12 sulfonated poly(ether ether ketone),13,14 sulfonated polybenzimidazole,15 sulfonated poly(ether sulfone),16 and sulfonated polysulfone17 have been extensively investigated as an alternative to Nafion. The above composites are formed by incorporating nanomaterials which will eventually offer high methanol crossover resistance and high proton conductivity.
Poly(ether sulfone) (PES) has received immense attention and is considered as a suitable candidate, as an alternative to Nafion, due to its thermo-mechanical, oxidative and chemical stabilities in a fuel cell environment.18–21 Along with these unique characteristics, poly(ether sulfone) can be easily functionalized. However, high degree of swelling in sPES based membranes with increased sulfonation (DS) levels affects their mechanical properties. For applications, sPES membranes with high DS should be tailored by incorporating nanomaterials to enhance their mechanical stability as well as proton conductivity. Two dimensional (2D) layered materials have unique properties like high surface area, thermal and mechanical stability along with methanol barrier properties. The use of layered 2D materials in polymers have been extensively studied to achieve high-performance polymer composites.22–25 Molybdenum sulfide (MoS2) is one of the important 2D layered nanomaterials, with its lamellar structure, which offers better ionic transport.26–29 Additionally, exfoliated molybdenum disulfide is extensively investigated in energy applications as an additive to polymers, which in turn facilitates proton transfer with additional mechanical strength to the polymer electrolyte. Furthermore, high methanol cross-over resistance for the polymer electrolyte is realized with the incorporation of exfoliated molybdenum disulfide nanosheets.30 Usually, nanomaterials with few surface functionalities aggregate into a polymer matrix, thereby, the properties of both nanomaterials and composites are significantly undermined. The functionalized nanomaterials form additional strong hydrogen bonding and interfacial interactions with polymers; as a result, the overall performance of the polymer improves significantly.31,32
The present study describes the synthesis of sulfonated molybdenum sulfide and preparation of sPES composite membranes (s-MoS2/sPES) as polymer electrolyte for DMFC applications. Improved selectivity of sPES based PEMs by simultaneous enhancement of proton conductivity and methanol cross-over resistance are reported by inclusion of s-MoS2.
2. Experimental section
2.1 Materials
Poly(ether sulfone) was obtained from Solvay Chemicals Pvt. Ltd, India and vacuum dried at 100 °C prior to use. 1,3-Propanesultone was supplied by TCI chemicals. Pt–Ru/C, 60 wt% and Pt/C, 40 wt% at 1![[thin space (1/6-em)]](https://www.rsc.org/images/entities/char_2009.gif) :
:![[thin space (1/6-em)]](https://www.rsc.org/images/entities/char_2009.gif) 1 ratio, and ammonium molybdate tetrahydrate and thiourea were received from Alfa Aesar Johnson Matthey. Nafion ionomer 5 wt% from ion power and gas diffusion layer (GDL) supplied by Sigracet SGL group was used for this study. Deionized (DI) water (resistivity 18.4 MΩ cm) was used for all the experiments.
1 ratio, and ammonium molybdate tetrahydrate and thiourea were received from Alfa Aesar Johnson Matthey. Nafion ionomer 5 wt% from ion power and gas diffusion layer (GDL) supplied by Sigracet SGL group was used for this study. Deionized (DI) water (resistivity 18.4 MΩ cm) was used for all the experiments.
2.2 Synthesis of sulfonated poly(ether sulfone), MoS2 and s-MoS2
The sulfonation reaction on poly(ether sulfone) was carried out in a similar way to the procedure reported in the literature.16 Briefly, vacuum dried poly(ether sulfone) was slowly added to concentrated sulfuric acid (98%) at 30 °C under vigorous stirring to make a (10% w/v) homogenous solution. The reaction mixture was heated at a constant temperature of 60 °C for 6 h, followed by vigorous stirring for 24 h at 30 °C. The reaction mixture was precipitated in ice cold deionized water and filtered, followed by washing with DI water until neutral pH.The degree of sulfonation (DS) for sulfonated poly(ether sulfone) is calculated using the following relation between IEC and DS:33
 | (1) |
![[thin space (1/6-em)]](https://www.rsc.org/images/entities/char_2009.gif) :
:![[thin space (1/6-em)]](https://www.rsc.org/images/entities/char_2009.gif) 2) and mixed by vigorous stirring for 1 h at 30 °C followed by ultrasonication. Furthermore, the resulting solution was transferred to a Teflon-lined stainless-steel autoclave for 12 h at a constant temperature of 220 °C. On cooling, the resultant black powder was filtered and washed several times with DI water. The filtered MoS2 was dried and stored under vacuum for characterization and further modifications. Sulfonation of the as synthesized MoS2 was carried out by using 1,3-propanesultone following the procedure reported in the literature.28 1 g of MoS2 was dispersed in 20 mL of toluene by ultrasonication and 3 g of 1,3-propane sultone was added and the reaction mixture was refluxed at 120 °C for a period of 24 h. On cooling, the reaction mixture was filtered and washed with excess amounts of toluene and water. The resultant black powder termed as s-MoS2 was dried and stored under a vacuum for characterization and further use.
2) and mixed by vigorous stirring for 1 h at 30 °C followed by ultrasonication. Furthermore, the resulting solution was transferred to a Teflon-lined stainless-steel autoclave for 12 h at a constant temperature of 220 °C. On cooling, the resultant black powder was filtered and washed several times with DI water. The filtered MoS2 was dried and stored under vacuum for characterization and further modifications. Sulfonation of the as synthesized MoS2 was carried out by using 1,3-propanesultone following the procedure reported in the literature.28 1 g of MoS2 was dispersed in 20 mL of toluene by ultrasonication and 3 g of 1,3-propane sultone was added and the reaction mixture was refluxed at 120 °C for a period of 24 h. On cooling, the reaction mixture was filtered and washed with excess amounts of toluene and water. The resultant black powder termed as s-MoS2 was dried and stored under a vacuum for characterization and further use.
2.3 Preparation of composite membranes and membrane electrode assembly (MEA)
Composite membranes based on s-MoS2/sPES with ∼0.180 mm thickness were prepared using a simple solution casting technique. For composite membrane synthesis, s-MoS2 was dispersed in DMAc by ultrasonication and mixed with the separately prepared sPES/DMAc homogenous solution (10 wt% in relation to solvent), and further stirred for 12 h at 30 °C. The resultant homogenous mixture was cast on a glass plate and dried in vacuum oven. The composite membranes were peeled off carefully and stored in DI water for further analysis. Composite membranes prepared with 1, 2, 5 and 6 wt% of s-MoS2 in sPES matrix were designated as FCL-1, FCL-2, FCL-5 and FCL-6, respectively. The pristine sPES membrane was designated as FCL.The membrane electrode assemblies (MEAs) with an effective area of 4 cm2 were prepared and considered for the present study. A mixture of Nafion–isopropyl alcohol (1![[thin space (1/6-em)]](https://www.rsc.org/images/entities/char_2009.gif) :
:![[thin space (1/6-em)]](https://www.rsc.org/images/entities/char_2009.gif) 1) as a binder was coated on anode prepared by loading 2 mg cm−2 Pt–Ru/C, 60 wt% and cathode 2 mg cm−2 Pt/C, 40 wt%. The synthesized membranes were placed in between the anode and cathode, and the assembly was subjected to hot press (Flow Mech) at 80 °C with a compaction pressure of 20 kg cm−2 for 2 min to form a typical MEA.
1) as a binder was coated on anode prepared by loading 2 mg cm−2 Pt–Ru/C, 60 wt% and cathode 2 mg cm−2 Pt/C, 40 wt%. The synthesized membranes were placed in between the anode and cathode, and the assembly was subjected to hot press (Flow Mech) at 80 °C with a compaction pressure of 20 kg cm−2 for 2 min to form a typical MEA.
2.4 Characterization of MoS2, s-MoS2 and membranes
The functional group, phase identification and indexing, and morphological analysis for MoS2, s-MoS2, and membranes were carried out using FTIR spectrometer, X-ray diffractometer, and scaning electron microscope, respectively. Morphology for MoS2 and s-MoS2 was further recorded by transmission electron microscope. The XPS analysis for MoS2 and s-MoS2 was carried out using a Thermo Scientific K-alpha+ X-ray photoelectron spectrometer using a monochromatic Al Kα (1486.6 eV) X-ray source and the data were interpreted with the help of the XPS Peak 4.1 software. The chemical structure of PES and sPES was confirmed using 1H NMR using d6-DMSO as the solvent and characterized using a JEOL RESONANCE ECZ600R spectrometer. The mechanical stability study for the membrane samples was carried out using a ZWICK ROELL BT-FR2.5TH.40 Universal Testing Machine (UTM) at room temperature. Thermogravimetric (TG) analysis for the membrane samples was carried out at a heating rate of 10 °C min−1 in the range of 30 to 600 °C using N2 gas on a METTLER TOLEDO STAR SW.2.5 Physicochemical characterization
Water uptake (WU), ion exchange capacity (IEC), and hydration number (λ) for the membranes were determined using a similar procedure to that reported elsewhere.4,13 The details of proton conductivity and linear swelling ratio (LSR) measurements are given in the ESI.†2.6 Methanol permeability measurement
The methanol permeability of the s-MoS2/sPES composite membranes was measured using an in-house built bicompartment (60 cm3 volume of each) diffusion cell at 30 °C.4 The membrane samples were clamped between the compartments and placed on a magnetic stirrer. One compartment (CP-A) was filled with 2 M methanol solution and the other (CP-B) with de-ionized water. The solutions in both compartments are continuously stirred and the concentration difference in compartment CP-B was measured at regular intervals of 1 h using gas chromatography (Thermo scientific Trace GC-Ultra) equipped with a capillary column and a flame ionization detector (FID). Methanol permeability for the test samples was calculated by using the following relation: | (2) |
Electrochemical selectivity (β) of membranes is the ratio of proton conductivity and methanol permeability as shown in the following equation:
 | (3) |
2.7 DMFC performance evaluation
The prepared MEAs were evaluated in a conventional fuel cell fixture with serpentine flow field machined on graphite plates (Fuel Cell Technology, US) with an active area of 4 cm2. The fuel methanol was passed at the anode at a flow rate of 2 mL min−1 and oxygen was passed at the cathode at a flow rate of 300 mL min−1. All the MEAs were tested at 60 °C using an electronic load Model-LCN4-25-24/LCN 50-24 from Bitrode Instruments (USA). Cell polarization studies were performed in the galvanostatic mode wherein constant current was drawn from the cell and the corresponding voltage value is noted in relation to individual current in each step. Furthermore, power density values were calculated by considering the cell voltage, current and active area of the MEA.3. Results and discussion
3.1 Characterization of MoS2, s-MoS2 and membranes
The phase identification and crystal structure of the synthesized MoS2 and s-MoS2 are analysed via XRD technique, and the obtained spectra are shown in Fig. 1. A strong and highly intense 2θ peak at 13.9, which corresponds to (0 0 2) plane and is indexed for layered structure of MoS2 (ICSD collection code: 31067) present in both MoS2 and s-MoS2, is attributed to similar layered structure of s-MoS2.34 Additional 2θ diffraction patterns at 33.19, 39.46, 58.77 and 69.34 with their characteristic planes of (1 0 1), (1 0 3), (1 1 0) and (2 0 1), respectively, confirm that the abovementioned material is a hexagonal crystal system and layer-structured, with D46h crystal system and P63 space group (ICSD collection code: 31067).35 Similar diffraction pattern of s-MoS2 reveals that the crystal structure does not vary on grafting aliphatic hydrocarbon chains carrying acidic groups. The presence of a sulfonic acid group with aliphatic hydrocarbon chains on MoS2 is confirmed by FTIR spectroscopy, and the recorded spectra of MoS2 and s-MoS2 is presented in Fig. 1 (inset). An absorption band at 613 cm−1 is assigned to the Mo–S stretching vibration present in both MoS2 and s-MoS2.33,35 In addition to this, new absorption bands at 1042 and 1212 cm−1 are assigned to the stretching vibrations of sulfonic acid group.36 The absorption band present in between 2800 and 3000 cm−1 is associated with stretching vibrations of the –CH2 group. These new absorption bands in the s-MoS2 spectrum confirm the grafting of sulfonic acid group on MoS2.33,37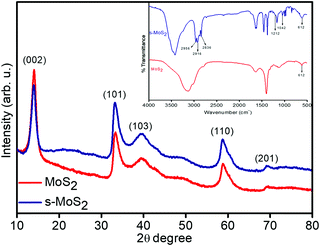 | ||
| Fig. 1 X-ray diffraction patterns of layered flower like MoS2 and s-MoS2 (inset shows FT-IR spectra). | ||
The chemical bonding structures and composition of the synthesized MoS2 and s-MoS2 are further examined by X-ray photoelectron spectroscopy. The detailed XPS survey spectrum of MoS2 and s-MoS2 presented in Fig. S1(a and b) (ESI†) reveals the presence of molybdenum, sulfur, and oxygen in both MoS2 and s-MoS2. The de-convoluted spectrum of Mo 3d (Fig. S2(a), ESI†) exhibits two peaks with binding energies of 229.2 eV and 232.4 eV corresponding to the Mo4+ 3d5/2 and Mo4+ 3d3/2 states, respectively.34 Notably, binding energy at 226.4 eV attributed to S 2s is detected, which is in agreement with previous reports.34,38 Moreover, the peaks at 162.1 eV and 163.3 eV are also observed in the de-convoluted spectrum of S 2p (Fig. S2(b), ESI†) corresponding to S 2p3/2 and S 2p1/2 states of a divalent sulfide ion (S2−), respectively.39 The O 1s (Fig. S2(c), ESI†) at 532.2 eV is assigned to the crystal lattice oxygen in the form of –OH present on the MoS2 surface which is in good agreement with the EDX data. In order to provide unambiguous evidence of covalent bonding between MoS2 particles and 1,3-propane sultone, the Mo 3d, S 2p, C 1s and O 1s peaks are de-convoluted and presented in Fig. 2(a–d). The Mo 3d and S 2p states in s-MoS2 (Fig. 2(a and b)) are identical as observed in the fine fitted Mo 3d and S 2p spectrum of MoS2. Additionally, the de-convoluted spectrum of S 2p with a binding energy in the vicinity of 168.8 eV is associated with the sulfonic acid group.28,40 Moreover, the signals for carbon have also emerged in the spectrum of s-MoS2, and this implies that a carbon chain containing a sulfonic acid group is effectively introduced on the MoS2 surface. The de-convolated spectrum of C 1s (Fig. 2(c)) exhibits binding energies at 284.2 eV, 285.1 eV, and 286.7 eV corresponding to the –C–C bond, –C–S bond, and –C–O bond, while 288.9 eV associated with C![[double bond, length as m-dash]](https://www.rsc.org/images/entities/char_e001.gif) O bond originated from CO2 contamination.41–43 Furthermore, the O 1s spectrum (Fig. 2(d)) with a binding energy at 531.3 eV is attributed to –O–H, and 532.2 eV could be assigned for adsorbed water, and 533.4 eV is associated with the –O–C bond.36,44 These studies confirm the hydrothermal synthesis of MoS2, and the presence of binding energies corresponding to C 1s, S 2p, and O 1s in the XPS survey spectrum of s-MoS2 clearly points towards the existence of a sulfonic acid group present on MoS2 surface.
O bond originated from CO2 contamination.41–43 Furthermore, the O 1s spectrum (Fig. 2(d)) with a binding energy at 531.3 eV is attributed to –O–H, and 532.2 eV could be assigned for adsorbed water, and 533.4 eV is associated with the –O–C bond.36,44 These studies confirm the hydrothermal synthesis of MoS2, and the presence of binding energies corresponding to C 1s, S 2p, and O 1s in the XPS survey spectrum of s-MoS2 clearly points towards the existence of a sulfonic acid group present on MoS2 surface.
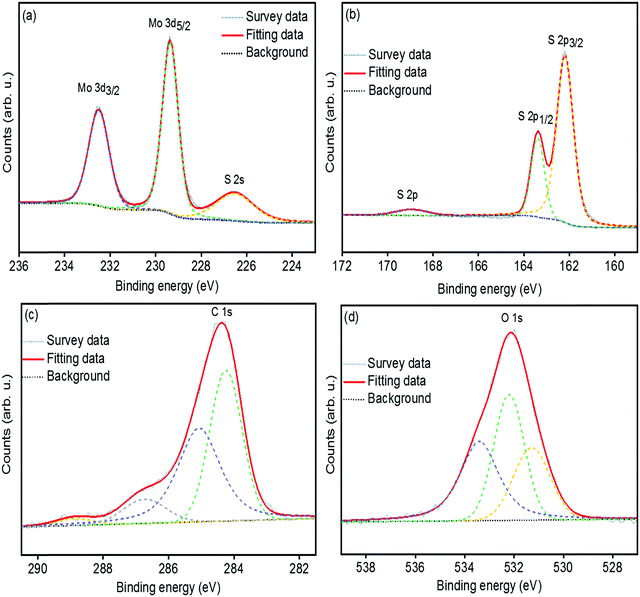 | ||
| Fig. 2 High resolution and de-convoluted XPS spectrum of Mo 3d peak (a), S 2p peak (b), C 1s peak (c), and O 1s peak (d) of sulfonated MoS2. | ||
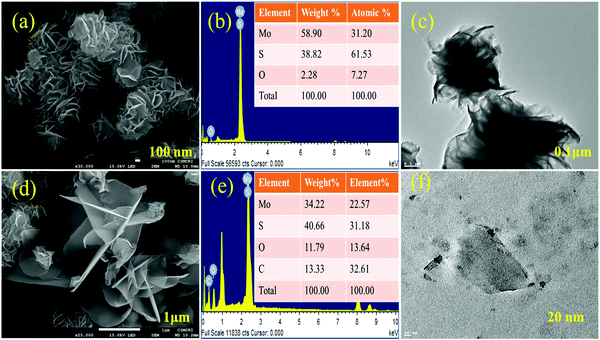
The morphology of hydrothermally synthesized MoS2 is analyzed by micro-scale imaging using SEM and TEM techniques and is presented in Fig. 3. From Fig. 3(a), it is clear that a number of wavy and entangled nanoflakes are assembled together to give rise uniformly distributed spherical flower of MoS2. Spherical flower like MoS2 nanostructure is obtained keeping the stoichiometry of precursors as 1![[thin space (1/6-em)]](https://www.rsc.org/images/entities/char_2009.gif) :
:![[thin space (1/6-em)]](https://www.rsc.org/images/entities/char_2009.gif) 2 (Mo
2 (Mo![[thin space (1/6-em)]](https://www.rsc.org/images/entities/char_2009.gif) :
:![[thin space (1/6-em)]](https://www.rsc.org/images/entities/char_2009.gif) S), and high sulfur ratio with respect to molybdenum suppresses the growth of flower like MoS2.34,45 The TEM microscale images (Fig. 3(c)) of MoS2 flowers show that petals are entangled to form flowers. The TEM results are in good agreement with the SEM results. Sulfonation of MoS2 leads to the separation of a few layers from the MoS2 flower which is clearly observed in Fig. 3(d). The presence of a sulfonic acid group with long alkyl chains on the edge of MoS2 petals increases their dispersion along with interaction with the sPES matrix. Presence of carbon and oxygen content in the EDX analysis and elemental mapping (Fig. S3, ESI†) of s-MoS2 further supports the sulfonation of MoS2.
S), and high sulfur ratio with respect to molybdenum suppresses the growth of flower like MoS2.34,45 The TEM microscale images (Fig. 3(c)) of MoS2 flowers show that petals are entangled to form flowers. The TEM results are in good agreement with the SEM results. Sulfonation of MoS2 leads to the separation of a few layers from the MoS2 flower which is clearly observed in Fig. 3(d). The presence of a sulfonic acid group with long alkyl chains on the edge of MoS2 petals increases their dispersion along with interaction with the sPES matrix. Presence of carbon and oxygen content in the EDX analysis and elemental mapping (Fig. S3, ESI†) of s-MoS2 further supports the sulfonation of MoS2.
Proton NMR spectroscopy is used as a scrutinizing technique to confirm the presence of sulfonic acid on the PES backbone and the corresponding 1H NMR spectra is presented in Fig. S4 (ESI†). It is clear that PES shows only two chemical shifts at δ = 7.3 ppm and δ = 8.0 ppm originating from the “b” protons of the phenyl ring near the ether linkage and “a” protons of the phenyl ring near the sulfone group, respectively. New chemical shifts observed at δ = 8.3 ppm in the sPES spectrum are assigned to the “c” proton located near a grafted sulfonic acid group.46 Meanwhile, the chemical shifts of “d” and “e” protons are also observed at higher chemical shift values of δ = 7.33 ppm and δ = 8.08 ppm, respectively, due to the very high de-shielding effect of the –SO3H group. This down field chemical shift value confirms the presence of the sulfonic acid group on the PES backbone. Sulfonation of PES in terms of functional group has also been characterized by FTIR-ATR and the corresponding spectra of the synthesized membranes are presented in Fig. S5 (ESI†). From the polymer skeleton, absorption bands at 1240 and 1152 cm−1 are assigned to aryl oxide (Ar–O–Ar) and the aromatic sulfone group, respectively. The peaks at 1485 and 1580 cm−1 correspond to the stretching vibrations of aromatic rings. Absorption bands at 1068 and 1102 cm−1 associated with the symmetric and asymmetric stretching vibrations of the O![[double bond, length as m-dash]](https://www.rsc.org/images/entities/char_e001.gif) S
S![[double bond, length as m-dash]](https://www.rsc.org/images/entities/char_e001.gif) O group of the sulfonic acid group confirms the successful grafting of –SO3H over the PES backbone.47
O group of the sulfonic acid group confirms the successful grafting of –SO3H over the PES backbone.47
Fig. 4 represents the XRD spectra of PES, sPES, and 5 wt% composite membrane. Sulfonation reaction of PES leads to poor macromolecular orientations within the polymer chains resulting in the shift of 2θ peaks of sulfonated PES towards lower 2θ values in comparison with PES.48 In addition to the characteristic sulfonation peak, additional 2θ peaks at 13.9, 33.25, 39.43 and 58.56, which are characteristic of s-MoS2 are also present in the s-MoS2/sPES composite membrane, confirming the successful incorporation of s-MoS2 in the sPES matrix. Scanning electron microscopy has been applied to investigate the morphology of the synthesized membrane, and microscale images of the prepared membranes are shown in Fig. 5. From the microscale images of the FCL membrane, it is clear that no cracks are seen in the synthesized membranes and the membranes are homogenous in nature with a smooth surface (Fig. 5(a and b)). Fig. 5(c and d) present the surface and cross-sectional view of the FCL-5 membrane to further confirm the uniform distribution of s-MoS2. The inset of Fig. 5(d) at lower magnification shows that the nanomaterial is uniformly dispersed throughout the membrane matrix. However, at 6 wt% of s-MoS2, agglomeration of s-MoS2 particles is observed (Fig. S6(a and b), ESI†) and aggregation of nanoparticles at high concentrations was reported in many studies.22
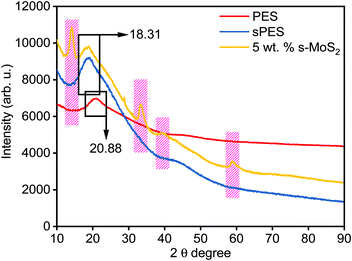 | ||
| Fig. 4 X-ray diffraction patterns of poly(ether sulfone) (PES), sulfonated poly(ether sulfone) (sPES), and 5 wt% s-MoS2/sPES composite membrane. | ||
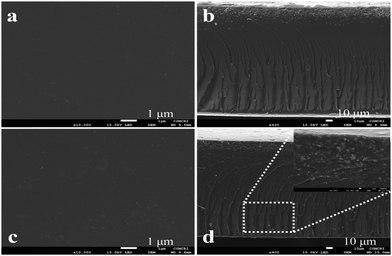 | ||
| Fig. 5 Surface morphology of pristine sPES membrane with surface (a) and cross sectional (b) micrographs, and surface (c) and cross sectional (d) micrographs for the 5 wt% composite membrane. | ||
3.2 Thermal and mechanical stability of the membranes
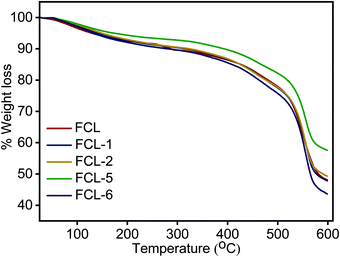
Thermal stability analysis of the membranes is examined in inert atmosphere and the results obtained are presented in Fig. 6. TGA thermograph presents three distinct weight loss regions in the range of 50–150, 250–350 and above 500 °C. The first phase of weight loss below 150 °C is due to the removal of absorbed moisture and bound water present in the membrane matrix. The intermediate weight loss region of 250 °C to 350 °C is associated with thermal decomposition of super acidic sulfonic acid group present.36 The third and major weight loss after 500 °C is associated with the decomposition of the sPES main chain.49 The s-MoS2/sPES composite membranes show lower weight loss at similar temperatures compared to the sPES membrane, which could be attributed to strong intermolecular hydrogen bonding interactions and even distribution of s-MoS2 particles within the sPES matrix.36 The result shows that composite membranes were thermally stable up to 250 °C which is adequate for their use as polymer electrolyte membranes.Mechanical stability for the polymer electrolyte membranes is carried out and presented in Table S1 (ESI†). Elongation at break and tensile strength of FCL membranes are found in the order of 51.47–65.85% and 15.31–24.53 MPa, respectively. As we increase the s-MoS2 content from 1 to 5 wt%, elongation at break, tensile strength, and elastic modulus of the FCL membranes increase and for 6 wt%, the parameters are reduced; moreover, the abovementioned parameters for 6 wt% s-MoS2 composite membrane are higher than that of the pristine sPES membrane. The above data show that addition of s-MoS2 in the sPES matrix significantly enhances the mechanical properties of membranes up to a certain limit, and thereafter on further addition, it reduces due to agglomeration of nanostructures (Fig. S6, ESI†) and results in poor mechanical properties of composite membranes. The FCL-5 membrane showed the highest elongation at break and tensile strength which is 65.85% and 24.53 MPa, respectively. The significant enhancement in tensile strength of the composite membranes in comparison with pristine membrane can be ascribed due to strong interfacial interactions between s-MoS2 and sPES chains and uniform dispersion which in turn reduces the free volume and transfers the mechanical strength to polymer electrolyte.28,30,32 The high dielectric properties and plasticizing nature of water molecules present in the membrane matrix reduce the Van der Waals force of attraction present between the macromolecular chains of the polymer which is elastic in nature.
3.3 Physicochemical properties of membranes
Absorbed water provides indirect measure of proton transport in PEMs. Proton gets transported across the membranes in the form of H3O+ using water molecules present in the membrane as their transport depends on a vehicular or hopping mechanism using bound water present in the membrane.50 The water uptake behavior of pristine and composite membranes is presented in Table 1, and it is envisaged that water uptake for s-MoS2/sPES composite membranes is higher than that of the sPES membrane. This trend is realized by the presence of additional sulfonic acid functionalities in s-MoS2. Presence of s-MoS2 in the sPES matrix creates additional water adsorption channels and available sulfonic acid group over sPES and s-MoS2 interact with water molecules by electrostatic forces or hydrogen bonding. The highest water uptake is seen for the FCL-5 membrane that is 40.73%, which is 67% higher than pristine sPES. Bulk water in the polymer matrix is comprised of free water and bound water. Bound water in the membrane samples is calculated and presented in Table 1. From Table 1, it is presumed that bound water content in composite membranes follow the same trend as followed by water uptake resulted from higher charged groups (–SO3H) present within the polymer matrix with increased s-MoS2 content. Hydration number (λ) indicates the number of water molecules present over repeating unit ionic site in the membranes and is presented in Table 1. Higher amount of water molecules facilitated overall proton transport across the membrane.| Membrane | WU (%) | BW (%) | IEC (meq. g−1) | λ | E a (kJ mol−1) | LSR (%) |
|---|---|---|---|---|---|---|
| FCL | 24.34 ± 0.97 | 1.33 | 1.26 ± 0.03 | 10.73 | 13.13 | 22.92 ± 1.27 |
| FCL-1 | 29.36 ± 1.15 | 1.62 | 1.32 ± 0.02 | 12.35 | 11.88 | 17.58 ± 0.88 |
| FCL-2 | 34.45 ± 0.99 | 1.71 | 1.44 ± 0.02 | 13.28 | 11.97 | 16.47 ± 0.94 |
| FCL-5 | 40.73 ± 1.07 | 1.84 | 1.61 ± 0.03 | 14.04 | 9.39 | 12.34 ± 0.90 |
| FCL-6 | 35.12 ± 1.09 | 1.59 | 1.41 ± 0.03 | 13.82 | 13.13 | 17.12 ± 0.82 |
Ion exchange capacity (IEC) of the proton exchange membranes is directly related to water uptake and it reflects their proton conductivity. The measured ion exchange capacity for membranes is presented in Table 1, and found in the order of 1.26 to 1.61 meq. g−1. The IEC value for the FCL-5 membrane is 28% higher than pristine membrane which resulted from a increase in the number of ionic sites upon addition of s-MoS2 in the sPES matrix. Dimension changes in the hydrated form of membranes determine their mechanical stability. Linear swelling ratio of composite membranes decreases with increase in s-MoS2; two dimensional graphene like structure of s-MoS2 provides high mechanical strength to membranes in addition to higher ion transport channels. The above data reveal that s-MoS2 has a profound effect on the physicochemical parameters of FCL membranes and the above mentioned parameters are significantly enhanced in the presence of s-MoS2 in the sPES matrix. Enhancement in the properties of FCL composite membranes is observed for up to 5 wt% addition of s-MoS2, however, with further increase in s-MoS2 content (6 wt%) the properties are found to be almost similar to FCL-2 membrane and presumably due to the agglomeration of s-MoS2 particles. Aggregation of s-MoS2 in the sPES matrix inevitably suppresses the number of active sulfonic acid sites available for water uptake and exchange of ions.
3.4 Proton conductivity of membranes
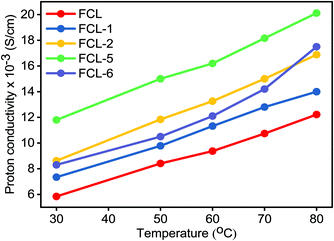
Proton conductivity is one of the critical parameters for DMFC applications and depends upon the concentration of sulfonic acid group present within the membrane matrix. Proton conductivity of the FCL membranes with increased s-MoS2 (1, 2, 5 and 6 wt%) content is assessed at different temperatures as shown in Fig. 7. Proton conductivity of the composite membranes is higher than pristine membrane. Proton conductivity increases from 7.34 to 11.8 × 10⁻³ S cm−1 at 30 °C, with an increase in s-MoS2 content from 1wt% to 5 wt%. The highest proton conductivity is seen for the FCL-5 membrane which is two-fold that of the pristine sPES membrane at 30 oC. Furthermore, FCL-6 displayed lower proton conductivity value as compared to FCL-5, which could be due to the aggregation of ionic groups in the former. It is proven that the Grotthuss mechanism (proton hopping) for proton transport and migration of protons in a hydronium ion (H3O+) form mainly governs the proton conductivity of a proton exchange membrane. In case of s-MoS2/sPES composite membranes, proton conduction takes place via both proton hopping and vehicular mechanisms (Scheme 1).51 From Table 1, we can see that s-MoS2 significantly increases the water content in composite membranes resulting in abundant water molecules in composite membranes for both proton transport mechanisms. Hence significant increase in proton conductivity for composite membranes is seen. In case of composite membranes, proton transport via vehicular mechanism is more favorable because of high water content. A similar response towards proton conductivity of membranes was observed at elevated temperatures. Proton conductivity of membranes linearly increases with an increase in test temperature following the Arrhenius relationship of thermal dependence (Fig. S7, ESI†). Activation energy (Ea) which is minimum energy required for proton transport is presented in Table 1. The FCL-5 membrane shows an activation energy of 9.39 kJ mol−1 which is 40% lower than that of the FCL membrane. The results reveal that s-MoS2 content in the sPES matrix significantly reduces the activation energy for proton transport and facilitates ionic transport across the s-MoS2/sPES composite membranes.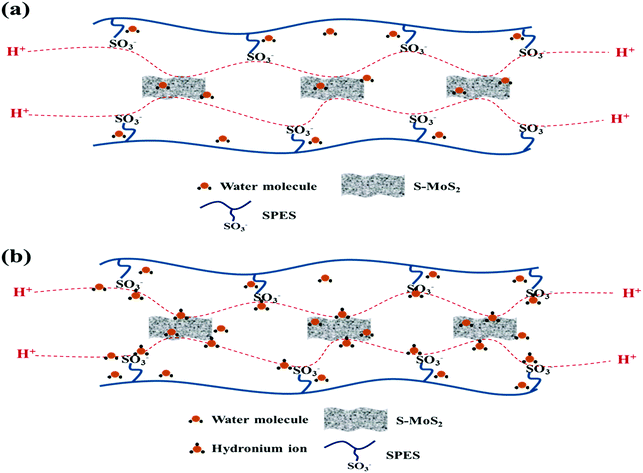 | ||
| Scheme 1 Hopping mechanism (a) and vehicular mechanism (b) of proton transport across the synthesized composite membranes. | ||
3.5 Methanol permeability and direct methanol fuel cell polarization study
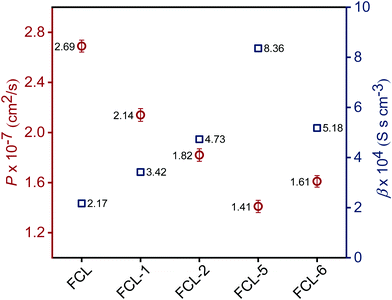
High methanol crossover resistance of PEMs help in achieving high power density and long-term durability for DMFC system. Mitigation of methanol across the test membrane plays a key role in determining the effect of membrane electrode assembly. Methanol crossover from the anode to the cathode poisons the catalyst due to the mixed potential and decreases the power output. Methanol concentration profile validated from the second compartment of the diffusion cell with time is presented in Fig. S8 (ESI†), and the corresponding methanol permeability (P) is presented in Fig. 8. Methanol permeability for the sPES membrane is reduced by 26% with addition of 1 wt% of s-MoS2 in the sPES matrix, whereas reduced by 91% with the addition of 5 wt% of s-MoS2. The transport rate of permeate across a membrane is highly influenced by the channels within the membrane matrix and PEMs exert similar transport channels for methanol and protons. High methanol permeation resistance exerted by composite membranes could be attributed by presence of s-MoS2 in sPES matrix. Abundant acidic –SO3H groups improve the proton conductivity by providing more connective ionic cluster domains and suppress methanol transport via hydrogen bonding interactions between s-MoS2 and sPES, which makes the transport channels more compact and tortuous (Scheme 2). Furthermore, uniform dispersion of s-MoS2 in the sPES matrix creates a highly compact network with much less free-void space, which effectively restricts the passage of methanol molecules across composite membranes.52 Membranes with high electrochemical selectivity are considered to be suitable for DMFC, which is validated by the ratio of proton conductivity and methanol permeability. Selectivity for FCL-5 membrane is 8.36 × 10⁴ S s cm−3 and for FCL membrane it is 2.17 × 10⁴ S s cm−3, which is much lower than FCL-5 membrane (Fig. 8). High electrochemical selectivity for the FCL-5 membrane results from restricted methanol permeability combined with high proton conductivity. This implies that addition of s-MoS2 significantly increases electrochemical selectivity and reduces methanol crossover. The methanol permeability and electrochemical selectivity of FCL-5 membrane is compared with previous literature and presented in Table 2. Low methanol crossover along with high selectivity and proton conductivity makes FCL-5 composite membrane a suitable candidate for DMFC applications.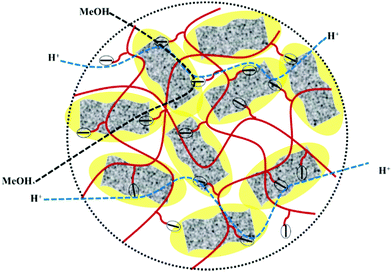 | ||
| Scheme 2 Schematic illustration of improved proton transport via long range ionic clusters and methanol crossover resistance of sPES/s-MoS2 composite membranes. | ||
| Membrane | P × 10−7 (cm2 s−1) | β × 104 (S s cm−3) | Ref. |
|---|---|---|---|
| 1Measured at 30 °C.2Measured at 25 °C.NRNot reported.a Measured with 2 M methanol.b Measured with 20 wt% methanol.c Measured with 2.5 M methanol. | |||
| sPEEK/sGNR–sGQD (1.5 wt%)a,1 | 4.35 | 12.59 | 4 |
| Nafion-117a,1 | 8.11 | 10.04 | 4 |
| SPPEK–SGNF (0.5 wt%)a,1 | 2.79 | NR | 9 |
| SGO-5b,1 | 1.55 | 37.27 | 16 |
| PVA/20 wt% MMTb,2 | 28.50 | 0.71 | 53 |
| SPVDF-co-HFP/SGO-7a,1 | 1.84 | 2.99 | 54 |
| SPEEK/PHTS-20a | 3.82 | 20.26 | 55 |
| S-PSF/S-ZSM-5 15% V/Vc,1 | 8.66 | 0.39 | 56 |
| FCL-5a,1 | 1.41 | 8.36 | This study |
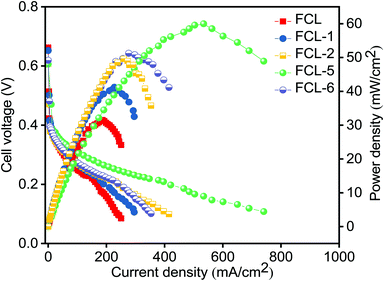
The composite membranes along with pristine sPES membrane are subjected to DMFC (single cell) polarization studies as a function of current density at 60 °C. Fig. 9 represents the DMFC polarization studies of prepared membranes. It is noted that composite membranes show higher power density in comparison with sPES membrane due to improved methanol permeation resistance and high proton conductivity. As the s-MoS2 content increases in the sPES matrix, the DMFC power output significantly increased, and this trend is evident via hydrogen bonding networks between s-MoS2 and sPES that forms a facile path for proton conduction, thereby minimizing the Ohmic resistance of the composite membranes. As a result, the sulfonic acid attached to s-MoS2 becomes more acidic and acts as a solid acid proton conductor, improving the transport of protons. Furthermore, the barrier effect of s-MoS2 increases the tortuosity for methanol transport through the composite membranes leading to better electrochemical selectivity. The peak power density of a cell with optimized s-MoS2/sPES (5 wt%) composite membrane is 60 mW cm−2 at a current density of 534 mA cm−2 which is almost 90% higher than 31.5 mW cm−2 at a current density of 185 mA cm−2 achieved for pristine sPES membrane and equivalent to 59 mW cm−2 at a current density of 280 mA cm−2 reported for Nafion 117 (with 2 M methanol anode feed and DMFC performed at 80 °C).57 Furthermore, the increase in s-MoS2 content with respect to sPES decreases the fuel cell performance due to suppressed proton conductivity and enhanced methanol permeation. The consequences suggest the potential of s-MoS2/sPES (5 wt%) composite membranes as an alternative PEM in direct methanol fuel cells.
4. Conclusions
Layered s-MoS2 with abundant acidic functional groups has been prepared and dispersed in sPES matrix to form composite polymer electrolytes for direct methanol fuel cell application. As prepared proton exchange membranes have been characterized in terms of their physicochemical properties, and the composite membranes showed better water uptake and IEC values which in turn helps in facile proton conduction compared with pristine membrane. Composite membranes with enhanced mechanical stability and proton conductivity showed restricted methanol permeation. FCL-5 membrane exhibited 91% methanol crossover reduction along with 1.9 times high peak power density in DMFC under similar experimental conditions, compared withs PES membrane. The results confirm that the use of s-MoS2 as an effective additive in sPES allows the formation of durable composite polymer electrolyte membranes.Conflicts of interest
There are no conflicts to declare.Acknowledgements
The author VK is grateful to UGC-DAE CSR, Indore, India and Department of Science and Technology, New Delhi, India for providing financial support to carry out this work. VY is grateful to the Council of Scientific and Industrial Research, India for providing him senior research fellowship (SRF). Analytical and Environmental Science Division and Centralized Instrument Facility, CSIR-CSMCRI, Bhavnagar is greatly acknowledged for instrumental support.References
- H. Wang, X. Liang, J. Wang, S. Jiao and D. Xue, Nanoscale, 2020, 12, 14–42 RSC.
- L. J. Yang, Y. Q. Deng, X. F. Zhang, H. Liu and W. J. Zhou, Nanoscale, 2018, 10, 9268–9275 RSC.
- M. S. Whittingham, R. F. Savinell and T. Zawodzinski, Chem. Rev., 2004, 104, 4243–4244 CrossRef CAS PubMed.
- A. Shukla, P. Dhanasekaran, N. Nagaraju, S. D. Bhat and V. K. Pillai, Electrochim. Acta, 2019, 297, 267–280 CrossRef CAS.
- H. Beydaghi, M. Javanbakht, P. Salarizadeh, A. Bagheri and A. Amoozadeh, Polymer, 2017, 119, 253–262 CrossRef CAS.
- S. Mohanapriya, S. D. Bhat, A. K. Sahu, S. Pitchumani, P. Sridhar and A. K. Shukla, Energy Environ. Sci., 2009, 2, 1210–1216 RSC.
- S. Mohanapriya, S. D. Bhat, A. K. Sahu, A. Manokaran, R. Vijayakumar, S. Pitchumani, P. Sridhar and A. K. Shukla, Energy Environ. Sci., 2010, 3, 1746–1756 RSC.
- S. J. Peighambardoust, S. Rowshanzamir and M. Amjadi, Int. J. Hydrogen Energy, 2010, 35, 9349–9384 CrossRef CAS.
- K. Xu, C. Chanthad, M. R. Gadinski, M. A. Hickner and Q. Wang, ACS Appl. Mater. Interfaces, 2009, 1, 2573–2579 CrossRef CAS PubMed.
- V. Neburchilov, J. Martin, H. Wang and J. Zhang, J. Power Sources, 2007, 169, 221–238 CrossRef CAS.
- V. Parthiban, S. Akula, S. G. Peera, N. Islam and A. K. Sahu, Energy Fuels, 2016, 30, 725–734 CrossRef CAS.
- A. U. Devi, A. Muthumeenal, R. M. Sabarathinam and A. Nagendran, Renewable Energy, 2017, 102, 258–265 CrossRef.
- S. Gahlot and V. Kulshrestha, ACS Appl. Mater. Interfaces, 2015, 7, 264–272 CrossRef CAS PubMed.
- S. W. Kim, S. Y. Choi and H. W. Rhee, Nanoscale, 2018, 10, 18217–18227 RSC.
- R. Wycisk, J. K. Lee and P. N. Pintauro, J. Electrochem. Soc., 2005, 152, A892–A898 CrossRef CAS.
- S. Gahlot, P. P. Sharma, V. Kulshrestha and P. K. Jha, ACS Appl. Mater. Interfaces, 2014, 6, 5595–5601 CrossRef CAS PubMed.
- P. Bunlengsuwan, N. Paradee and A. Sirivat, Polym.-Plast. Technol. Eng., 2017, 56, 1695–1703 CrossRef CAS.
- M. A. Hickner, H. Ghassemi, Y. S. Kim, B. R. Einsla and J. E. McGrath, Chem. Rev., 2004, 104, 4587–4612 CrossRef CAS PubMed.
- D. Seo, Y. D. Lim, S. Lee, Y. Jeong, T. Hong and W. Kim, Int. J. Hydrogen Energy, 2010, 35, 13088–13095 CrossRef CAS.
- H. J. Kim, N. N. Krishnan, S. Y. Lee, S. Y. Hwang, D. K. Kyoung, J. Jeong, J. K. Lee, E. Cho, J. Lee, J. Han, H. Y. Ha and T. H. Lim, J. Power Sources, 2006, 160, 353–358 CrossRef CAS.
- M. Ueda, H. Toyota, T. Ouchi, J. Suciyama, K. Yonetake, T. Masuko and T. Teramoto, J. Polym. Sci., Part A: Polym. Chem., 1993, 31, 853–858 CrossRef CAS.
- S. Gahlot and V. Kulshrestha, Int. J. Hydrogen Energy, 2019 DOI:10.1016/j.ijhydene.2019.06.047.
- S. Gahlot, P. P. Sharma and V. Kulshrestha, Colloids Surf., A, 2018, 538, 622–627 CrossRef CAS.
- V. Yadav and V. Kulshrestha, Nanoscale, 2019, 11, 12755–12773 RSC.
- S. Gahlot and V. Kulshrestha, Int. J. Hydrogen Energy, 2018, 43, 21683–21689 CrossRef CAS.
- K. Zhou, S. Jiang, C. Bao, L. Song, B. Wang, G. Tang, Y. Hu and Z. Gui, RSC Adv., 2012, 2, 11695–11703 RSC.
- K. Feng, B. Tang and P. Wu, ACS Appl. Mater. Interfaces, 2013, 5, 13042–13049 CrossRef CAS PubMed.
- J. Li, Y. Zhang, S. Zhang and X. Huang, J. Membr. Sci., 2015, 490, 179–189 CrossRef CAS.
- X. Jiang, Y. Sun, H. Zhang and L. Hou, Carbohydr. Polym., 2018, 180, 96–103 CrossRef CAS PubMed.
- K. Divya, D. Rana, M. Sundaram, S. A. Saraswathi and A. Nagendran, Polymer, 2019, 175, 255–264 CrossRef CAS.
- D. Rana, K. Bagh, S. N. Bhattacharyya and B. M. Mandal, J. Polym. Sci., Part B: Polym. Phys., 2000, 38, 369–375 CrossRef CAS.
- D. Rana, B. M. Mandal and S. N. Bhattacharyya, Macromolecules, 1996, 29, 1579–1583 CrossRef CAS.
- V. Yadav, A. Rajput and V. Kulshrestha, J. Membr. Sci., 2020, 603, 118043 CrossRef CAS.
- A. Arunchander, S. G. Peera and A. K. Sahu, J. Power Sources, 2017, 353, 104–114 CrossRef CAS.
- T. N. Y. Khawula, K. Raju, P. J. Franklyn, I. Sigalas and K. I. Ozoemena, J. Mater. Chem. A, 2016, 4, 6411–6425 RSC.
- X. Zhu, J. Huang, C. Jin, S. Zhang, S. Li and B. Jiang, Polym. Bull., 2018, 75, 3739–3751 CrossRef CAS.
- F. Chekin, S. Bagheri and S. B. Abd Hamid, J. Chin. Chem. Soc., 2015, 62, 689–694 CrossRef CAS.
- J. Shi, Y. Yang, Y. Zhang, D. Ma, W. Wei, Q. Ji, Y. Zhang, X. Song, T. Gao, C. Li, X. Bao, Z. Liu, Q. Fu and Y. Zhang, Adv. Funct. Mater., 2015, 25, 842–849 CrossRef CAS.
- B. Seo, G. Y. Jung, Y. J. Sa, H. Y. Jeong, J. Y. Cheon, J. H. Lee, H. Y. Kim, J. C. Kim, H. S. Shin, S. K. Kwak and K. H. Joo, ACS Nano, 2015, 9, 3728–3739 CrossRef CAS PubMed.
- Y. Heo, H. Im and J. Kim, J. Membr. Sci., 2013, 424–425, 11–22 CrossRef.
- B. Garg, T. Bisht and Y. C. Ling, RSC Adv., 2014, 4, 57297–57307 RSC.
- A. A. Razzaq, Y. Yao, R. Shah, P. Qi, L. Miao, M. Chen, X. Zhao, Y. Peng and Z. Deng, Energy Storage Mater., 2019, 16, 194–202 CrossRef.
- K. Kim, M. Kim, Y. Hwang and J. Kim, Ceram. Int., 2014, 40, 2047–2056 CrossRef CAS.
- D. Sun, Y. Tang, D. Ye, J. Yan, H. Zhou and H. Wang, ACS Appl. Mater. Interfaces, 2017, 9, 5254–5262 CrossRef CAS PubMed.
- C. M. Lee, G. C. Park, S. M. Lee, J. H. Choi, S. H. Jeong, T. Y. Seo, S. Jung, J. H. Lim and J. Joo, J. Nanosci. Nanotechnol., 2016, 16, 11548–11551 CrossRef CAS.
- M. Tang, J. Xue, K. Yan, T. Xiang, S. Sun and C. Zhao, J. Colloid Interface Sci., 2012, 386, 428–440 CrossRef CAS PubMed.
- A. R. Kim, M. Vinothkannan and D. J. Yoo, Bull. Korean Chem. Soc., 2018, 39, 913–919 CrossRef CAS.
- L. Unnikrishnan, S. K. Nayak, S. Mohanty and G. Sarkhel, Polym.-Plast. Technol. Eng., 2010, 49, 1419–1427 CrossRef CAS.
- Y. Zhao, Y. Fu, Y. He, B. Hu, L. Liu, J. Lua and C. Lu, RSC Adv., 2015, 5, 93480–93490 RSC.
- M. M. Nasef and A. A. Aly, Desalination, 2012, 287, 238–246 CrossRef CAS.
- L. Wu, Z. Zhang, J. Ran, D. Zhou, C. Li and T. Xu, Phys. Chem. Chem. Phys., 2013, 15, 4870–4887 RSC.
- M. Sairam, M. B. Patil, R. S. Veerapur, S. A. Patil and T. M. Aminabhavi, J. Membr. Sci., 2006, 281, 95–102 CrossRef CAS.
- C. C. Yang, Y. J. Lee and J. M. Yang, J. Power Sources, 2009, 188, 30–37 CrossRef CAS.
- A. U. Devi, K. Divya, N. J. Kaleekkal, D. Rana and A. Nagendran, Polymer, 2018, 140, 22–32 CrossRef CAS.
- L. Cao, X. Shen, X. Yang, B. Zhang, Z. Li, M. Gang, C. Wang, H. Wu and Z. Jiang, RSC Adv., 2016, 6, 68407–68415 RSC.
- N. Krathumkhet, K. Vongjitpimol, T. Chuesutham, S. Changkhamchom, K. Phasuksom, A. Sirivat and K. Wattanakul, Solid State Ionics, 2018, 319, 278–284 CrossRef.
- N. W. DeLuca and Y. A. Elabd, J. Power Sources, 2006, 163, 386–391 CrossRef CAS.
Footnote |
| † Electronic supplementary information (ESI) available. See DOI: 10.1039/d0ma00197j |
| This journal is © The Royal Society of Chemistry 2020 |

