 Open Access Article
Development of tuneable green-to-red emitting transparent film based on Nafion with TbIII/EuIII β-diketonate complexes modulated by pH and proton flow†
Hajime
Kamebuchi
 *ab,
Taiho
Yoshioka
a and
Makoto
Tadokoro
 *a
*a
aDepartment of Chemistry, Faculty of Science, Tokyo University of Science, Kagurazaka 1-3, Shinjuku-ku, Tokyo 162-8601, Japan
bDepartment of Chemistry, College of Humanities and Sciences, Nihon University, Sakurajosui 3-25-40, Setagaya-ku, Tokyo 156-8550, Japan. E-mail: hkame@chs.nihon-u.ac.jp
First published on 9th June 2020
Abstract
Nafion membranes are recognised as cation exchangers and excellent proton conductors. Emissive LnIII-β-diketonate complexes, [LnIII2(PBA)6] (Ln = Eu, Tb; HPBA = N-(2-pyridinyl)benzoylacetamide), were incorporated into a transparent Nafion film. Upon incorporation, reversible emission by the green light emitter [TbIII2(PBA)6] and red light emitter [EuIII2(PBA)6] could be controlled through pH adjustment. [TbIII2(PBA)6] emitted only under acidic conditions, while [EuIII2(PBA)6] emitted only under basic conditions. Taking advantage of Nafion's high proton conductivity brought about dynamic changes in the wavelengths emitted by the film. When an in-plane external voltage was applied to the film, red wavelength emission appeared to migrate toward the negative electrode. Owing to the proton concentration gradient induced by the electric field, emission by EuIII at 615 nm was enhanced near the positive electrode, whereas proton deficiency suppressed emission by [TbIII2(PBA)6]. Tuneable emission in the transparent Nafion system enhances its potential for use as an energy-saving material.
Transparent luminescent materials that emit intensely under irradiation at specific wavelengths are highly promising energy-saving materials. These materials have potential for applications in light-emitting diodes (LEDs), displays and illuminators, because light scattering and self-absorption are reduced.1 There are currently two ways to fabricate highly transparent and luminescent materials. Fluorescent nanoparticles can be incorporated, such as quantum dots,2 which do not scatter visible light. Alternatively, luminescent ions, organic molecules and metal complexes can be dispersed in transparent glasses3 or polymeric films.4 The latter is a convenient way to produce luminescent materials with arbitrary sizes and shapes for emission at various wavelengths. However, it is difficult to control the emission wavelength in a single glass or film. It is also difficult to tune multicolour luminescence induced by external stimuli.
Tang et al. reported a multicolour-emitting transparent luminescent material with N-(2-pyridinyl)benzoylacetamide (HPBA) and lanthanide ions.5 HPBA is a β-diketone compound containing an amide group and a pyridine ring.5,6 Adding an amide group to β-diketonates would increase its triplet excitation energy, which would facilitate energy transfer from the ligand to the TbIII core. In addition, the pyridine ring in HPBA enables emission wavelength modulation via pH adjustment, because changes to the S1 and T1 level of the β-diketonate ligand are caused by protonation and deprotonation. Therefore, HPBA is well-suited for materials in which luminescence is adjusted with changes in pH. It has been found that spin-coated poly(vinyl pyrrolidone) (PVP) films containing HPBA, TbIII and EuIII emit green light under acidic conditions, whereas red light is emitted by EuIII ions under basic conditions.5
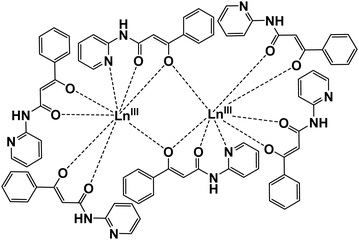
In this study, we employed Nafion as a solid medium for the fabrication of transparent luminescent materials with tuneable emissions. Nafion membranes are quite famous for their ability to conduct protons and exchange cations.7 Nafion is composed of hydrophobic main chains and pendant hydrophilic side chains.7c The side chains are especially important. When Nafion is introduced to a polar solvent, solvent molecules are surrounded by side-chain sulfonic acid groups.7b Cavities ∼4 nm in diameter form in Nafion when it is swollen with water or alcohol, and large molecules can be immobilised within them. Moreover, the proton conductivity of hydrated Nafion is very high and can reach up to 0.1 S cm−1.7d A variety of functional films have been developed by using Nafion to take advantage of these properties.8–16 This time, we first synthesised and crystallised the HPBA–TbIII and HPBA–EuIII complexes [TbIII2(PBA)6] (1) and [EuIII2(PBA)6] (2) as pH-sensitive emitters (Scheme 1). The complexes were easily incorporated into transparent Nafion film, and the excellent proton conduction in Nafion not only made it responsive to pH; the proton gradient within a [LnIII2(PBA)6]@Nafion. We demonstrated a fine tuning of emission colour in the transparent film by adjusting its pH with buffer solutions and manipulating the electric field.
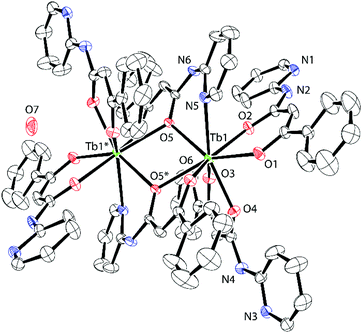
HPBA was prepared with 2-aminopyridine and ethyl benzoylacetate in xylene according to a previously reported procedure.171 and 2 were synthesised and crystallised via slow diffusion of Ln(NO3)3·6H2O, HPBA and NaOH in MeOH. X-ray crystallographic analysis revealed unexpected dinuclear structures bridged by two PBA− ligands, which are quite different molecular structures reported in ref. 11 and 12. Crystalline 1 and 2 were assigned to the orthorhombic Pbca space group. The crystallographic data, bond lengths, bond angles and hydrogen bonds of 1 and 2 are shown in Table 1 and Tables S1–S6 (ESI†). Formation of the isomorphous dinuclear complexes occurred through cross-linking of O(5) and O(5)* in the β-diketone group and N(5) in the pyridine moiety (Fig. 1 and Fig. S1, ESI†). Intermolecular hydrogen bonds formed between nitrogen atoms in the secondary amines (N(2), N(4)) and the uncoordinated pyridine groups (N(1), N(3)) on the four PBA− ligands (Fig. S2 and S5, ESI†). Hydrogen bonds also formed between nitrogen atoms in the secondary amines of the bridging PBA− ligands (N(6)) and H2O (O(7)) as crystallisation water (Fig. S3 and S6, ESI†).
| 1 | 2 | |
|---|---|---|
| Formula | C84H68N12O13Tb2 | C84H68N12O13Eu2 |
| Formula weight | 1789.36 | 1775.44 |
| Crystal system | Orthorhombic | Orthorhombic |
| Space group | Pbca (#61) | Pbca (#61) |
| a/Å | 15.039(8) | 15.0798(7) |
| b/Å | 17.955(9) | 17.9879(9) |
| c/Å | 29.141(15) | 29.0943(14) |
| V/Å3 | 7869(7) | 7891.9(7) |
| Z | 4 | 4 |
| T/K | 173(2) | 173(2) |
| d calc/g cm−3 | 1.510 | 1.494 |
| μ(MoKα)/mm−1 | 1.855 | 1.647 |
| F(000) | 3600 | 3584 |
| Data | 9735 | 9782 |
| Parameters | 513 | 513 |
| R 1 [I > 2σ(I)] | 0.0364 | 0.0344 |
| wR2 (all data) | 0.0942 | 0.0767 |
| G.O.F. | 1.037 | 1.000 |
| Differential peak/e Å−3 | 1.647 | 1.181 |
| Differential Hole/e Å−3 | −0.900 | −0.637 |
| CCDC | 1938544 | 1938545 |
The following hydrogen bond distances were observed in 1: N(1)⋯N(4) = 3.013(5) Å; N(2)⋯N(3) = 3.031(5) Å; N(6)⋯O(7) = 2.913(5) Å. Fig. S4 and S7 (ESI†) show the coordination geometry around the Ln core. Six PBA− ligands completed an 8-coordinated LnO7N1 core to form a rectangular prism. The top and bottom surfaces of the prism exhibited the so-called square antiprismatic geometry (SAP), in which they appeared twisted with respect to each other. The face-to-face distance in the SAP (dpp), the minimum interatomic distance within each face (din) and the angles between the diagonals of the two faces (Φ) are shown in Fig. S4 (ESI†). The upper plane [O(1)O(2)O(3)O(4)] was a flat, nearly square rectangle with a din ranging from 2.719(4) to 2.761(4) Å. The lower plane [O(5)N(5)O(6)O(5)*] was a distorted rectangle with greater variation in din, which ranged from 2.778(4) to 3.330(5) Å. The angle Φ was 40.7(1)–50.1(2)°, while dpp equalled 2.568(2) Å. In compound 2, din in the [O(1)O(2)O(3)O(4)] plane ranged from 2.726(4) to 2.806(4) Å and from 2.785(3) to 3.413(4) Å in the [O(5)N(5)O(6)O(5)*] plane. Φ ranged from 40.4(1) to 51.2(1)°, and dpp = 2.587(2) Å.
1 and 2 were readily introduced into Nafion due to its high cation exchange capacity. The treated Nafion film was referred to as 1/2@Nafion. In contrast to methods like spin-coating and casting, the concentration of molecules absorbed by the Nafion film was not immediately distinct. We therefore needed to quantify the dinuclear lanthanide(III) complexes taken up by the film. We did so indirectly by continuously analysing the soaking solution with a UV-visible spectrometer. We then determined the relationship between complex absorption and time. We expected that after removing the film, the complex concentration in the soaking solution would be lower than it was before soaking the film. Consequently, peak intensity in the UV-vis absorption spectra of the soaking solution would decrease after adding the film. Changes in the absorption spectra thus enabled us to quantify the complexes taken up by 1/2@Nafion. The dependence of the loading weight on soaking time estimated from the UV-vis spectra is shown in Fig. 2. The absorption peak intensity decreased with increasing soaking time. This decrease in intensity began to stabilise after 40 h of soaking. After 90 h, virtually no change in peak intensity was observed. The estimated complex concentration in 1/2@Nafion was 16.08 mg g−1 (Table S7, ESI†).
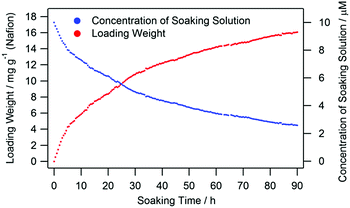 | ||
| Fig. 2 The dependence of loading weight on soaking time (red). The concentration of the soaking solution is shown in blue. | ||
Emission spectra of 1 and 2 in EtOH are shown in Fig. S8 (ESI†). The peaks at 545 and 615 nm originated from the 5D4 → 7F5 and 5D0 → 7F2 f–f transitions in TbIII and EuIII, respectively. 1 emitted green light, and emission was quenched under basic conditions. 2 emitted red light and was quenched under acidic conditions. Focusing on the emission spectrum of 2 here, the intensity of 5D0 → 7F2 is about 7.7 times higher than that of 5D0 → 7F1; 5D0 → 7F2 is an electric dipole transition and is sensitive to site symmetry. Meanwhile, the 5D0 → 7F1 transition is sensitive to the magnetic dipole effect and is actually not subject to the chemical surroundings of EuIII ion. The large intensity ratio I(5D0 → 7F2)/I(5D0 → 7F1) value for compound 2 reflects the low symmetry of the EuIII ion as EuO7N1. For example, a homo-lanthanide 3D-framework, {[EuIII(μ6-ddpp)]·H2O}n (H3ddpp = 2,5-di(2′,4′-dicarboxylpheny)pyridine acid), has a near-perfect SAP local symmetry of EuO8, and its emission intensity ratio I(5D0 → 7F2)/I(5D0 → 7F1) is about three.18
Incorporation of compounds 1 and 2 was carried out by soaking a plastic Nafion film in an EtOH solution that contained 1 and 2 in 1![[thin space (1/6-em)]](https://www.rsc.org/images/entities/char_2009.gif) :
:![[thin space (1/6-em)]](https://www.rsc.org/images/entities/char_2009.gif) 1 molar ratio for 90 h at RT. The appearance and pH dependence of 1/2@Nafion emission in Britton–Robinson buffer (BRB)19 from pH 2 to 12 is shown in Fig. 3. When soaked in pH 2–5 solutions, 1/2@Nafion emitted green light under UV irradiation at 365 nm. After soaking in pH 6–8 solutions, it emitted yellow light, while red light was emitted after soaking at pH 9–12. The peak at 615 nm in the emission spectra in Fig. 3 originating from EuIII (5D0 → 7F2) became less intense as the pH decreased, while the peak at 545 nm originating from TbIII (5D4 → 7F5) increased in intensity. Our observations supported the notion that the green light emitted by 1/2@Nafion under acidic conditions originated from 1, while the red light seen under basic conditions originated from 2. The yellow light observed at pH 6–8 was likely a mixture of red and green light, since the peaks at 545 and 615 nm were both rather intense in the emission spectra. A relevant and important example is the fine tuning of red to green emission in {[Eu3xTb3(1−x)Zn6(bipy)2(Hmimda)7]·mH2O}n (bipy = 4,4′-bipyridine, H3mimda = 2-methyl-1-H-imidazole-4,5-dicarboxylic acid).20 This is a functional material made up of carboxylate bridged LnIII binuclear units with SAP local symmetry of LnO8, where Hminda2− and bipy are able to sensitise both EuIII and TbIII ions. It is demonstrated that the emission intensities of TbIII 5D4 → 7F2 and 5D4 → 7F5 increase with increasing doping of TbIII in this system, while the intensity of EuIII 5D0 → 7F2 gradually decreases. In the case of 1/2@Nafion, on the other hand, the advantage is that the fine tuning of the luminescent colour can be done without changing the amount of lanthanide ions, because the pH was adjusted to determine whether the PBA− ligand sensitises TbIII or EuIII ions. Thus, 1/2@Nafion has a potential application as an insightful pH sensor. A comparison with other reported examples in terms of sensor applications is that of a binary co-doped Tb1−xEux-tcptpy (H3tcptpy = 4-(2,4,6-tricarboxylphenyl)-4,2′:6′,4′′-terpyridine), which behaves as a luminescent thermometer.21 This system has a SAP local symmetry of LnO7N1, and the intensity ratio I(5D0 → 7F2)/I(5D0 → 7F1) is about 10.8 for Eu-tcptpy due to low site symmetry. In particular, Tb0.897Eu0.103-tcptpy with x = 0.103 exhibits the best temperature dependence of the emission, with a linear decrease of 5D4 → 7F5 for TbIII and a linear increase of 5D0 → 7F2 for EuIII in the range 305–340 K. As described above, functional materials that can precisely control the luminescence intensity of TbIII and EuIII have a variety of potential applications.
1 molar ratio for 90 h at RT. The appearance and pH dependence of 1/2@Nafion emission in Britton–Robinson buffer (BRB)19 from pH 2 to 12 is shown in Fig. 3. When soaked in pH 2–5 solutions, 1/2@Nafion emitted green light under UV irradiation at 365 nm. After soaking in pH 6–8 solutions, it emitted yellow light, while red light was emitted after soaking at pH 9–12. The peak at 615 nm in the emission spectra in Fig. 3 originating from EuIII (5D0 → 7F2) became less intense as the pH decreased, while the peak at 545 nm originating from TbIII (5D4 → 7F5) increased in intensity. Our observations supported the notion that the green light emitted by 1/2@Nafion under acidic conditions originated from 1, while the red light seen under basic conditions originated from 2. The yellow light observed at pH 6–8 was likely a mixture of red and green light, since the peaks at 545 and 615 nm were both rather intense in the emission spectra. A relevant and important example is the fine tuning of red to green emission in {[Eu3xTb3(1−x)Zn6(bipy)2(Hmimda)7]·mH2O}n (bipy = 4,4′-bipyridine, H3mimda = 2-methyl-1-H-imidazole-4,5-dicarboxylic acid).20 This is a functional material made up of carboxylate bridged LnIII binuclear units with SAP local symmetry of LnO8, where Hminda2− and bipy are able to sensitise both EuIII and TbIII ions. It is demonstrated that the emission intensities of TbIII 5D4 → 7F2 and 5D4 → 7F5 increase with increasing doping of TbIII in this system, while the intensity of EuIII 5D0 → 7F2 gradually decreases. In the case of 1/2@Nafion, on the other hand, the advantage is that the fine tuning of the luminescent colour can be done without changing the amount of lanthanide ions, because the pH was adjusted to determine whether the PBA− ligand sensitises TbIII or EuIII ions. Thus, 1/2@Nafion has a potential application as an insightful pH sensor. A comparison with other reported examples in terms of sensor applications is that of a binary co-doped Tb1−xEux-tcptpy (H3tcptpy = 4-(2,4,6-tricarboxylphenyl)-4,2′:6′,4′′-terpyridine), which behaves as a luminescent thermometer.21 This system has a SAP local symmetry of LnO7N1, and the intensity ratio I(5D0 → 7F2)/I(5D0 → 7F1) is about 10.8 for Eu-tcptpy due to low site symmetry. In particular, Tb0.897Eu0.103-tcptpy with x = 0.103 exhibits the best temperature dependence of the emission, with a linear decrease of 5D4 → 7F5 for TbIII and a linear increase of 5D0 → 7F2 for EuIII in the range 305–340 K. As described above, functional materials that can precisely control the luminescence intensity of TbIII and EuIII have a variety of potential applications.
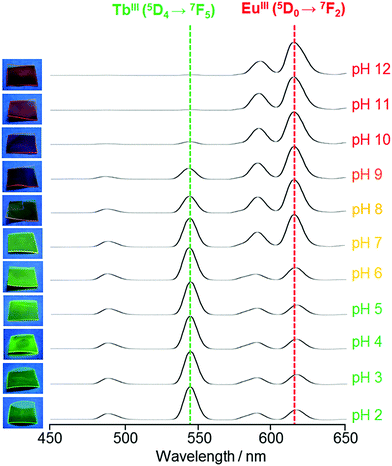 | ||
| Fig. 3 Emission spectra showing pH dependence in 1/2@Nafion. Pictures of the films at the corresponding pH values are shown on the left (λex = 365 nm). | ||
Since Nafion is a highly proton-conductive film, it is possible to create a proton concentration gradient through the membrane by applying an external voltage. To take advantage of this property for control of 1/2@Nafion emission, we manipulated the distribution of protons in the membrane by applying an external voltage. Before testing, 1/2@Nafion was soaked in an acidic BRB solution (pH 3) for 5 min to ensure acidic conditions within the film. Voltage was applied through the film using the setup depicted in Fig. 4. Aluminium foil was attached to two glass slides. The film was held between the slides to ensure contact between it and the Al foil, and the setup was clamped in the upright position to secure the foil and film between the slides. Sandwiching the Nafion film between the glass slides also effectively prevented evaporation of water from the membrane.
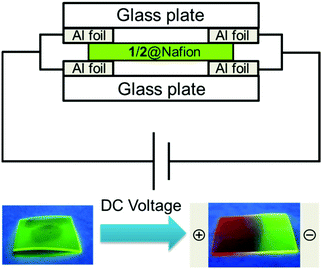 | ||
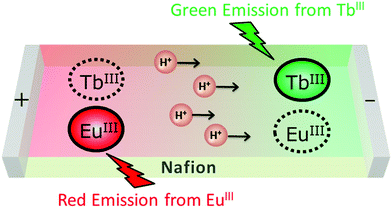
| Fig. 4 Control of 1/2@Nafion (pH 3) emission with proton flow under an applied voltage and irradiation with UV light (λex = 365 nm). | ||
A voltage of 40 V was then applied in plane using a SourceMeter® 2400 source measure unit (Keithley Instruments, USA). The in-plane distance between the electrodes was approximately 1 cm. Luminescence observations were performed by irradiating the films with 365 nm UV light while voltage was applied. Initially, 1/2@Nafion emitted exclusively green light due to the protonation of 1 and 2 at pH 3. Red light emission was observed first at the positive electrode and gradually spread toward the negative electrode. After ∼4 min, the entire film was emitting red light (Movie S1, ESI†). During the reaction, the film emitted green light around the negative electrode, red light around the positive electrode, and yellow light between the electrodes. A conceptual diagram of the experiment is shown in Fig. 5. We could explain the observed phenomena in terms of proton distribution. The membrane was initially acidic, and emission of green light from TbIII was predominant due to the abundance of protons in BRB at low pH. Protons migrated toward the negative electrode upon application of an external voltage. As the region around the positive electrode became deficient in protons, the deprotonated complexes became predominant. This suppressed emission by the TbIII ion in 1, and luminescence originating from the EuIII ion in 2 was activated. This explained why the chromatic ‘flow’ appeared red to the naked eye.
Conclusions
The rationale for this study was the development of several functional transparent films by combining Nafion, a synthetic membrane that is well known for its ability to exchange cations and conduct protons, with functional metal complexes. When soaked in a solution of ionic metal complexes, the cation exchange capacity of Nafion enables spontaneous incorporation of the complexes. This tendency makes the preparation of transparent Nafion films with chromatic, magnetic, or luminescent properties originating in the incorporated molecules exceedingly simple. Most notably, it is possible to tune the functionality of films that contain proton-responsive complexes by applying a voltage through the membrane to induce proton flow. In this study, we controlled the luminescence of a Nafion film with pH and a proton concentration gradient induced by application of an external voltage. Since Nafion is transparent, incorporating luminescent complexes into Nafion films enables fabrication of transparent luminescent materials. Light scattering and self-absorption in the films are minimal, so they have potential for use as energy-saving materials. We are now adding a blue-light emitting complex to our system to fabricate a transparent material that emits light over the entire visible spectrum.Conflicts of interest
The authors declare no competing financial interest.Acknowledgements
H. K. kindly acknowledge funding by the Sasakawa Scientific Research Grant from The Japan Science Society (28-341), Tokyo Institute of Technology Foundation Research and Educational Grants (28-036), a research grant from The Mazda Foundation (16KK-354), a research grant from Izumi Science and Technology Foundation (H29-J-109), a research grant from Iketani Science and Technology Foundation (0301067-A).References
- (a) Luminescent Materials and Applications, ed. A. Kitai, Wiley, Chichester, 2008 Search PubMed; (b) Handbook of Luminescence, Display Materials and Devices, ed. H. S. Nalwa and L. S. Rohwer, American Scientific Publishers, Valencia, 2003 Search PubMed.
- (a) S.-H. Shin, B. Hwang, Z.-J. Zhao, S. H. Jeon, J. Y. Jung, J.-H. Lee, B.-K. Ju and J.-H. Jeong, Sci. Rep., 2018, 8, 2463 CrossRef PubMed; (b) M. K. Choi, J. Yang and D.-H. Kim, npj Flexible Electron., 2018, 2, 10 CrossRef; (c) T. Frecker, D. Bailey, X. Arzeta-Ferrer, J. McBride and S. J. Rosenthal, ECS J. Solid State Sci. Technol., 2016, 5, R3019 CrossRef CAS; (d) E. S. Shibu, M. Hamada, S. Nakanishi, S.-I. Wakida and V. Biju, Coord. Chem. Rev., 2014, 263–264, 2 CrossRef CAS; (e) S. R. Alvarado, Y. Guo, T. P. A. Ruberu, E. Tavasoli and J. Vela, Coord. Chem. Rev., 2014, 263–264, 182 CrossRef CAS; (f) H. Chen, L. Lin, H. Li and J.-M. Lin, Coord. Chem. Rev., 2014, 263–264, 86 CrossRef CAS.
- (a) C. Liu, B. Qian, R. Ni, X. Liu and J. Qiu, RSC Adv., 2018, 8, 31564 RSC; (b) M. Seshadri, V. de Carvalho dos Anjos and M. J. V. Bell, in Luminescence: An Outlook on the Phenomena and their Applications, ed. J. Thirumalai, IntechOpen, London, 2016 Search PubMed.
- (a) L. H. C. Francisco, M. C. F. C. Felinto, H. F. Brito, E. E. S. Teotonio and O. L. Malta, J. Mater. Sci.: Mater. Electron., 2019, 1 Search PubMed; (b) W. Li, P. Yan, G. Hou, H. Li and G. Li, Dalton Trans., 2013, 42, 11537 RSC; (c) J. Deschamps, A. Potdevin, N. Caperaa, G. Chadeyron, S. Therias and R. Mahiou, New J. Chem., 2010, 34, 385 RSC.
- J. Xu, L. Jia, N. jin, Y. Ma, X. Liu, W. Wu, W. Liu, Y. Tang and F. Zhou, Chem. – Eur. J., 2013, 19, 4556 CrossRef CAS PubMed.
- X. Li, H. Chen, A. M. Kirillov, Y. Xie, C. Shan, B. Wang, C. Shi and Y. Tang, Inorg. Chem. Front., 2016, 3, 1014 RSC.
- (a) K. Schmidt-Rohr and Q. Chen, Nat. Mater., 2008, 7, 75 CrossRef CAS PubMed; (b) K. A. Mauritz and R. B. Moore, Chem. Rev., 2004, 104, 4535 CrossRef CAS PubMed; (c) C. Heitner-Wirguin, J. Membr. Sci., 1996, 120, 1 CrossRef CAS; (d) T. A. Zawodzinski Jr., M. Neeman, L. O. Sillerud and S. Gottesfeld, J. Phys. Chem., 1991, 95, 6040 CrossRef; (e) W. Y. Hsu and T. D. Gierke, J. Membr. Sci., 1983, 13, 307 CrossRef CAS.
- H. Kamebuchi, T. Jo, H. Shimizu, A. Okazawa, M. Enomoto and N. Kojima, Chem. Lett., 2011, 40, 888 CrossRef CAS.
- H. Kamebuchi, M. Enomoto and N. Kojima, in Nafion: Properties, Structure and Applications, ed. A. Sutton, Nova Science Publishers, New York, 2016, pp. 119–140 Search PubMed.
- (a) A. Nakamoto, H. Kamebuchi, M. Enomoto and N. Kojima, Hyperfine Interact., 2012, 205, 41 CrossRef CAS; (b) A. Nakamoto, N. Kojima, L. X. Jun, Y. Moritomo and A. Nakamura, Polyhedron, 2005, 24, 2909 CrossRef CAS; (c) Y. Moritomo, Y. Isobe, X. J. Liu, T. Kawamoto, A. Nakamoto, N. Kojima, K. Kato and M. Takata, J. Lumin., 2004, 108, 229 CrossRef CAS; (d) A. Nakamoto, Y. Ono, N. Kojima, D. Matsumura and T. Yokoyama, Chem. Lett., 2003, 32, 336 CrossRef CAS; (e) N. Kojima, S. Toyazaki, M. Itoi, Y. Ono, W. Aoki, Y. Kobayashi, M. Seto and T. Yokoyama, Mol. Cryst. Liq. Cryst., 2002, 376, 567 CrossRef CAS; (f) X. J. Liu, Y. Moritomo, A. Nakamura, T. Hirao, S. Toyazaki and N. Kojima, J. Phys. Soc. Jpn., 2001, 70, 2521 CrossRef CAS.
- (a) W. Kosaka, M. Tozawa, K. Hashimoto and S.-I. Ohkoshi, Inorg. Chem. Commun., 2006, 9, 920 CrossRef CAS; (b) M. Tozawa, S.-I. Ohkoshi, N. Kojima and K. Hashimoto, Chem. Commun., 2003, 1204 RSC.
- (a) H. Hosokawa and T. Mochida, Langmuir, 2015, 31, 13048 CrossRef CAS PubMed; (b) H. Hosokawa, Y. Funasako and T. Mochida, Chem. – Eur. J., 2014, 20, 15014 CrossRef CAS PubMed; (c) Y. Funasako and T. Mochida, Chem. Commun., 2013, 49, 4688 RSC.
- Y. Funasako, A. Takaki, M. Inokuchi and T. Mochida, Chem. Lett., 2016, 45, 1397 CrossRef CAS.
- (a) Y. Zhuang and J. Zhang, Luminescence, 2010, 24, 343 CrossRef PubMed; (b) Z. Cai, Z. Lin, X. Chen, T. Jia, P. Yu and X. Chen, Luminescence, 2010, 24, 367 CrossRef PubMed; (c) M. N. Szentirmay, N. E. Prieto and C. R. Martin, J. Phys. Chem., 1985, 89, 3017 CrossRef CAS; (d) N. E. Prieto and C. R. Martin, J. Electrochem. Soc., 1984, 131, 751 CrossRef CAS.
- (a) F. J. Sainz-Gonzalo, C. Popovici, M. Casimiro, A. Raya-Barón, F. López-Ortiz, I. Fernández, J. F. Fernández-Sánchez and A. Fernández-Gutiérrez, Analyst, 2013, 138, 6134 RSC; (b) S. M. Shilov, K. A. Gavronskaya, A. N. Borisov and V. N. Pak, Russ. J. Gen. Chem., 2008, 78, 1775 CrossRef CAS; (c) A. A. Petushkov, S. M. Shirov, M. V. Puzyk and V. N. Pak, Russ. J. Phys. Chem. A, 2007, 81, 612 CrossRef CAS; (d) A. A. Petushkov, S. M. Shilov and V. N. Pak, J. Lumin., 2006, 116, 127 CrossRef CAS.
- (a) H. Dacres and R. Narayanaswamy, Sens. Actuators, B, 2005, 107, 14 CrossRef CAS; (b) A. G. Ryder, S. Power and T. J. Glynn, Appl. Spectrosc., 2003, 57, 73 CrossRef CAS PubMed; (c) C.-M. Chan, W. Lo and K.-Y. Wong, Biosens. Bioelectron., 2000, 15, 7 CrossRef CAS PubMed; (d) D. García-Fresnadillo, M. D. Marazuela, M. C. Moreno-Bondi and G. Orellana, Langmuir, 1999, 15, 6451 CrossRef; (e) C.-M. Chan, C.-S. Fung, K.-Y. Wong and W. Lo, Analyst, 1998, 123, 1843 RSC.
- B. Zaleska, B. Trzewik, E. Stodolak, J. Grochowski and P. Serda, Synthesis, 2004, 2975 CrossRef CAS.
- X. Feng, R. Li, L. Wang, S.-W. Ng, G. Qin and L. Ma, CrystEngComm, 2015, 17, 7878 RSC.
- H. T. S. Britton and R. A. Robinson, J. Chem. Soc., 1931, 1456 RSC.
- X. Feng, Y. Feng, N. Guo, Y. Sun, T. Zhang, L. Ma and L. Wang, Inorg. Chem., 2017, 56, 1713 CrossRef CAS PubMed.
- X. Feng, Y. Shang, H. Zhang, X. Liu, X. Wang, N. Chen, L. Wang and Z. Li, Dalton Trans., 2020, 49, 4741 RSC.
Footnote |
| † Electronic supplementary information (ESI) available: Detailed experimental procedures, tables for bond angles and distances, emission spectra in solution, and short movie about emission of the film under DC voltage. CCDC 1938544 and 1938545. For ESI and crystallographic data in CIF or other electronic format see DOI: 10.1039/d0ma00237b |
| This journal is © The Royal Society of Chemistry 2020 |

