 Open Access Article
Creative Commons Attribution 3.0 Unported Licence
Cancer cell membrane-derived nanoparticles improve the activity of gemcitabine and paclitaxel on pancreatic cancer cells and coordinate immunoregulatory properties on professional antigen-presenting cells†
Edson J.
Comparetti
 *,
Paula M. P.
Lins
 ,
João V. B.
Quitiba
and
Valtencir
Zucolotto
 *
*
Nanomedicine and Nanotoxicology Group, Physics Institute of São Carlos, University of São Paulo, São Carlos, SP, Brazil. E-mail: zuco@ifsc.usp.br; edsoncomparetti@usp.br
First published on 17th July 2020
Abstract
Human pancreatic carcinoma is among the neoplasias with the highest number of deaths, and the frequency of relapses has demanded novel therapeutic intervention. Currently, the simultaneous application of different chemotherapeutics improves treatment efficiency in patients. However, the low specificity of these molecules may increase the cytotoxic side effects in healthy cells. Nanocarriers conjugated with aptamers and monoclonal antibodies target distinct proteins expressed on cancer cells and can be used to increase drug activity in disease sites. A recent advance in nanoengineering has led to the isolation of cell membrane lipids and proteins from cytoplasmatic organelles by ultracentrifugation, and the double-layer surface is used to coat organic and inorganic nanoparticles to prolong their permanence in the bloodstream. Additionally, plasmatic cell components form lipid nanovesicles that can deliver antineoplastic molecules. The present study aims to isolate the major components from pancreatic tumor cell membranes (PANC-1) to fabricate nanoparticles (MNPs) encapsulating two first-line drugs used in clinical treatment, viz., gemcitabine (GEM) and paclitaxel (PTX). Our results demonstrate that the MNP-GEM-PTX are very stable and induce greater cytotoxic effects on PANC-1 cells, in comparison to the use of pure GEM+PTX. The most interesting finding is that MNPs also interact with monocytes and dendritic cells, increasing the expression of costimulatory molecules CD80, CD83, CD86, and HLA-DR, indicating that the drug-carrier property of MNPs upregulates the activation of white blood cells. Therefore, a novel class of nanoparticles has been used to deliver antineoplastic agents to cancer cells and antigenic material to antigen-presenting cells. We also investigated their ability to modulate immune cells, aiming to promote pro-inflammatory responses in tumor sites.
1. Introduction
Chronic diseases are responsible for 15% of deaths worldwide,1 with 9.5 million casualties registered in 2018 and 17 million new cases expected for 2020.2 Pancreatic cancer represents the 14th most frequent and the 7th highest mortality amid neoplasms, with diagnosis usually confirmed in the late stages when the disease has already progressed in the organism.1,2 Surgery and chemotherapy are the main therapeutic strategies against abnormal cells in the pancreas but patients survive for just a couple of months after initiating the treatments.3,4In chemotherapy, the most common classes of drugs include alkylates to inhibit DNA transcription, antimetabolites – cellular compound analogs – that block metabolic pathways in the S-phase, microtubule-stabilizing agents in the G0/G1 and/or G2/M phases, and topoisomerase inhibitors.5 Gemcitabine (GEM) is an antimetabolite drug used to treat pancreatic cancer because it interferes in DNA replication, inhibiting deoxyribonucleotide synthesis in the S-phase which lead to anti-cancer effects during cell division. In the late stages, pancreatic carcinoma is highly resistant to chemotherapy6 and to improve treatment efficiency, researchers have pointed to the simultaneous application of different drugs, such as the combination of GEM with cisplatin, oxaliplatin, taxol, and capecitabine. However, only therapies using GEM+Taxol demonstrated effects better than monotherapy with GEM in clinical trials.7 Simultaneous administration of GEM and paclitaxel (PTX) increases the survival rate by at least 2 months in patients with metastases,8 being considered a novel therapeutic procedure for pancreatic cancer.
Recent studies revealed the feasibility of nanoparticles (NPs) to deliver a high concentration of drugs within target cells and to reduce undesirable toxicity in other tissues. Nanoparticles can carry antineoplastic agents to improve drug activity in diseased cells, however, their applicability depends on their ability to move through organs and tissues in the human body.9 The “addressing” of primary and metastatic sites is done upon coupling antibodies and aptamers on the nanostructure surface, establishing greater specificity for target tissues.10 Such a strategy increases hydrophobic drug release in disease sites and minimizes the bioavailability to healthy cells. Nanomaterials also inhibit the expulsion of chemotherapeutic molecules from the cytoplasm by ATP carrier proteins (ABC transporters) before producing any cytotoxic effects.11 Liposomes used in drug delivery may reduce the hematological and vascular toxicity observed in clinical treatments with chemotherapeutics, restoring the normal levels of platelets, monocytes and T cells.12,13
A recent breakthrough in nanoengineering uses the major components from the cell membrane to camouflage nanostructures in the organism and to conduct their activity to the cells where the membrane residues came from.14 In the latter strategy, lipids and proteins are isolated by ultracentrifugation and are used to synthesize nanovesicles with immunomodulatory properties.15 Currently, studies already use lipids and proteins from the plasma membrane (MNPs) from red cells, immune cells (macrophages, dendritic cells, and T cells), and cancer cells in the preparation of nanostructures. The presence of cellular adhesion proteins aids interactions with the desired target cells14,16 and membrane lipids (phospholipids, glycolipids, and cholesterol), increasing their stability in biological medium and keeping drugs bioavailable for weeks in the circulatory system.17–19
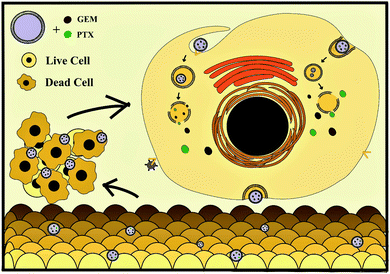
Neoplastic cell growth and expansion begin with their ability to modulate the tumor microenvironment and evade immune surveillance. To use nanoparticles in clinical treatments, it is necessary to investigate their toxicity and phenotypic changes in leukocytes from human peripheral blood. Nanocomposites prevent the production of immunosuppressive cytokines and increase the activity of the main mechanisms of cellular immunity. In this study, we synthesized lipid nanoparticles with the main components from the pancreatic cancer cell membrane (PANC-1) to deliver a large amount of antigenic material to antigen-presenting cells (APCs). The nanoparticles also carried low doses of GEM and PTX to reduce minimal effective doses in malignant cells and side effects in healthy cells. According to our knowledge, this is the first study using this class of nanovesicle to simultaneously deliver two chemotherapeutic drugs. Novel therapeutic approaches administer low and ultra-low doses of chemotherapeutics to inhibit the negative side effects in the organism, like severe immunosuppression and cancer resistance.20 Metronomic therapy has become more attractive than the periodic application of maximum tolerated doses because it reduces the immune suppression of macrophages and lymphocytes in the tumor microenvironment, activating white blood cells against neoplasias.21–23 The MNPs prepared here were tested in vitro in tumor and healthy cell lines to verify the cytotoxic activity of GEM/PTX nanocarriers (MNP-GEM-PTX) (Scheme 1). The ability of the nanoparticles to target specific cells was investigated by exposing them to PANC-1 cells, HEPA-RG cells and peripheral blood monocytes from healthy donors. We observed the excellent stability of MNP-GEM-PTX, which exhibited higher cytotoxic effects than GEM or PTX alone. Therefore, we set out to improve the drug delivery to pancreatic cells and improve antigenic material processing into monocytes and dendritic cells using nanovesicles created from cancer cell membrane components.
2 Methodology
2.1 Nanoparticle synthesis
Plasma membranes from pancreatic carcinoma cells were isolated by ultracentrifugation, as described by Lung et al.,24 and extruded 20 times through a 100 nm membrane for nanovesicle fabrication. Briefly, the cells were detached from culture bottles, washed three times with PBS, lysed in a hypotonic buffer for 20 min at 4 °C and homogenized. The lysed cells were centrifuged at 15![[thin space (1/6-em)]](https://www.rsc.org/images/entities/char_2009.gif) 000 g for 15 min at 4 °C to remove cell debris. The supernatant was collected and centrifuged at 100
000 g for 15 min at 4 °C to remove cell debris. The supernatant was collected and centrifuged at 100![[thin space (1/6-em)]](https://www.rsc.org/images/entities/char_2009.gif) 000 g for 2 h, using an Optima MAX-XP ultracentrifuge (Beckman Coulter, USA). The pellet containing the cell membranes was dispersed in 1 ml of PBS containing Complete Protease Inhibitor (Roche Diagnostics, Mannheim, Germany) and stored at −80 °C. Membrane proteins present in the vesicles were quantified by the Bradford colorimetric assays (Sigma-Aldrich) to determine the protein concentration in the samples.
000 g for 2 h, using an Optima MAX-XP ultracentrifuge (Beckman Coulter, USA). The pellet containing the cell membranes was dispersed in 1 ml of PBS containing Complete Protease Inhibitor (Roche Diagnostics, Mannheim, Germany) and stored at −80 °C. Membrane proteins present in the vesicles were quantified by the Bradford colorimetric assays (Sigma-Aldrich) to determine the protein concentration in the samples.
2.2 Ultraviolet-visible spectroscopy (UV-Vis) and Fourier-transform infrared spectroscopy (FTIR)
A Hitachi UV-Vis spectrophotometer, model U2008, was used to monitor the amount of chemotherapeutic agent encapsulated in MNPs and also its release over 48 h. FTIR analyses were performed in a Nicolet iS-50 spectrophotometer.2.3 Microscopy Analyses
Nanoparticle morphology was analyzed using Field Emission Scanning Electron Microscopy (MEV-FEG, ZEISS, model SIGMA), Transmission Cryo-Electron Microscopy (TEM, JEOL 1400) and Atomic Force Microscopy (AFM, Nanosurf model EasyScan 2 FlexAFM) to measure the external density and dimensions, as well as to verify the presence of adsorbed or incorporated materials. Confocal microscopy (Leica TCS SP8) was also used to evaluate the nanoparticle interaction with the cells.2.4 Nanoparticle stability in aqueous solutions
Dynamic light scattering (DLS) and zeta potential (spectrometer Zetasizer Nano ZS90) were used to evaluate nanoparticle polydispersity, size distribution, and surface potential. Nanoparticle tracking analysis (NTA) was carried out using a Malvern NanoSight NS300 instrument to also study nanoparticle size. DLS analyses were employed to evaluate the stability of the nanoparticles incubated in DMEM culture medium with 10% Fetal Bovine Serum (FBS) under agitation for 4 h, 8 h, 12 h, 24 h, 36 h, and 48 h.252.5 Incorporation of chemotherapeutic drugs into MNPs
Gemcitabine (GEM) and paclitaxel (PTX) were co-extruded with the hepatocellular carcinoma membranes through a 100 nm polycarbonate membrane using a mini-extruder (Avanti Polar Lipids). MNP-GEM and MNP-PTX were prepared by mixing 1 ml of MNPs suspension at 109 particle per ml with 5.2 μl of GEM at 100 μM and 7.12 μl of PTX at 5 nM dissolved in PBS and extruded through a 100 nm membrane in a Malvern nano-extruder at room temperature. The solution was centrifuged at 100![[thin space (1/6-em)]](https://www.rsc.org/images/entities/char_2009.gif) 000g for 2 h and washed with PBS. After the removal of unloaded GEM and PTX, the complexes (MNP-GEM, MNP-PTX, and MNP-GEM-PTX) were re-suspended in 1 ml of PBS under gentle sonication for 30 min at 40 kHz. UV/visible spectroscopy was carried out on pure MNPs and samples with GEM/PTX to estimate the amount of encapsulated chemotherapic molecules.
000g for 2 h and washed with PBS. After the removal of unloaded GEM and PTX, the complexes (MNP-GEM, MNP-PTX, and MNP-GEM-PTX) were re-suspended in 1 ml of PBS under gentle sonication for 30 min at 40 kHz. UV/visible spectroscopy was carried out on pure MNPs and samples with GEM/PTX to estimate the amount of encapsulated chemotherapic molecules.
2.6 MNPs staining with fluorescein isothiocyanate and analysis of their interaction with cells
Nanovesicle labels were prepared by dispersing 1010 particles in 1 ml of PBS and 0.1 mg of fluorescein isothiocyanate (FITC), stirring in the dark at 4 °C for 12 h. MNP-FITC was separated from unconjugated fluorescein by dialysis for 12 h on a 12k Dalton membrane. The suspension was ultracentrifuged and resuspended in PBS. FITC+ nanoparticles were used to prove the preferential uptake of MNPs by mononuclear cells (monocytes) and pancreatic cancer cells (PANC-1), and incubated with 108 particles per ml for 48 h. Flow cytometry (model FACS Calibur) was used to analyze the samples and the results were processed using the FlowJo software, version vX. 10.6.2.7 Tumor cell culture
Pancreatic cancer cells (PANC-1) and hepatic cell lines (HEPA-RG) were cultured in complete medium [DMEM medium supplemented with 10% fetal bovine serum (FBS), 1% sodium pyruvate, 1% non-essential amino acids, 1% antibiotic and antimycotic (Life Technologies), and HEPES (Sigma)] at 37 °C under 5% of CO2. We used 0.05% trypsin-EDTA (Gibco) to release cells from the bottle surface before washing in complete culture medium for use in the assays.2.8 Cytotoxicity assay (MTT)
We analyzed the nanoparticle interactions with the cell lines using MTT (3-[4,5-dimethyl-thiazol-2-yl]-2,5-diphenyltetrazolium bromide) colorimetric assay. This salt was reduced to formazan crystals through mitochondrial metabolism, reflecting the activity of living cells as an indicator of viability. The treatment was performed by adding the particles and chemotherapeutics to cell culture (1 × 10⁴ cells per well) in a flat-bottom plate of 96 wells for 24 and 48 h. As contrasts we tested (a) pure MNPs; (b) MNPs encapsulated with GEM (MNP-GEM); (c) MNPs with PTX (MNP-PTX); (d) MNPs carrying GEM and PTX (MNP-GEM-PTX) and (d) pure GEM and PTX. Cells exposed to DMSO were used as the positive control in the assay (maximal lysis). The living cells were incubated with a solution of MTT for 3 h at 37 °C under 5% of CO2. Dimethyl sulfoxide (DMSO) solubilized formazan crystals in the mitochondria for analysis in the spectrophotometer at 580 nm.2.9 Necrosis and apoptosis assays
Flow cytometry confirmed the cytotoxic activity of MNPs at 108 particles per ml and 10 μM GEM and 10 nM PTX. After incubation for 48 h in 12-well plates, the particles were removed from the supernatant, as well as the cell debris. About 1 × 10⁵ cells were collected and centrifuged at 10![[thin space (1/6-em)]](https://www.rsc.org/images/entities/char_2009.gif) 000 rpm for 30 seconds and re-suspended in isoton (PBS, containing 0.5% BSA) for 20 min at room temperature with Annexin V and 7AAD and analyzed by flow cytometry.
000 rpm for 30 seconds and re-suspended in isoton (PBS, containing 0.5% BSA) for 20 min at room temperature with Annexin V and 7AAD and analyzed by flow cytometry.
2.10 Human monocytes culture
Human monocytes were obtained from the peripheral blood of 3 healthy donors with ages ranging from 20 to 40 years. The investigation was carried out according to the Helsinki Declaration and approved by the Institutional Research Ethics Committee. All the cell donors were informed about the procedures, objectives and risks involved in the study, and signed an agreement form. Human peripheral blood monocytes were separated from red blood cells and plasma by centrifugation at 1600 rpm for 35 min in the Ficoll-Isopaque gradient. The cell suspension was centrifuged in 51% of Percoll gradient to separate monocytes from lymphocytes and dispense mononuclear cells into sterile plates (2 × 10⁵ per well) for performing the interaction assays.2.11 Dendritic cell differentiation
Monocytes from healthy donors were differentiated in dendritic cells (DCs) after being supplemented in culture medium with 80 ng ml−1 of IL-4 and GM-CSF. The positive control group (Control+) was incubated with an activation cocktail composed of IL-1, IL6, TNF, and PGE2 to obtain complete mature DCs differentiation. After 6 days, adherent cells were harvested and washed with complete medium, being concentrated to 2 × 10⁵ per well. DCs were treated with nanoparticles carrying antineoplastic agents to evaluate the cell viability, phenotype, and functional assays.2.12 Evaluation of monocytes and the DC phenotype after exposure to MNPs
We used flow cytometry to analyze surface markers from monocytes and dendritic cells after 48 h of treatment with monoclonal antibodies (BD Bioscience). In monocyte (CD14+) and DC populations (CD11c+), we observed co-stimulation molecules (CD80, CD83, and CD86), major histocompatibility complex class II (HLA-DR), suppressor molecules (PD-L1) and cell viability (7AAD+), with analysis based on quadrant gates of working groups.2.13 Mixed lymphocyte reaction (MLR)
Mixed Lymphocyte Reaction (MLR) investigates the DCs allogeneic response in lymphocyte proliferation. On the 7th day of differentiation, DCs treated with the previously described nanoparticles were co-cultured with lymphocytes. In experiments of allogeneic response, the ratio of 1![[thin space (1/6-em)]](https://www.rsc.org/images/entities/char_2009.gif) :
:![[thin space (1/6-em)]](https://www.rsc.org/images/entities/char_2009.gif) 10 between DCs and lymphocytes was used. The culture was maintained for 5 days and the total of the allogeneic lymphocytes incubated with MTT salt at the end of the period was determined for proliferative analysis.
10 between DCs and lymphocytes was used. The culture was maintained for 5 days and the total of the allogeneic lymphocytes incubated with MTT salt at the end of the period was determined for proliferative analysis.
2.14 Statistical analysis
All assays were repeated at least 3 times and data analysis was submitted to ANOVA, followed by Tukey Mean Difference tests, considering differences with error probability less than or equal to 5% (α ≤ 0.05).3 Results
3.1 Nanoparticle characterization
The plasma membrane-derived nanoparticles were produced by extrusion after membrane extraction from the pancreatic cancer cell line (PANC-1). Dynamic light scattering and nanoparticle tracking analysis revealed particles with an average size between 100–200 nm. All nanoparticles exhibited negative zeta potential when dispersed in PBS at pH 7.4. However, in buffer solution at pH 4.4, only the experimental groups encapsulated with PTX presented a negatively superficial charge (Table 1). A negative charge was expected since the MNP contained antigenic material from PANC-1 in phospholipid bilayers. For example, the MNP zeta potential was −11 mV in saline buffer at pH 7.4 and, in the presence of chemotherapeutics, the MNP-GEM, MNP-PTX and MNP-GEM-PTX had their zeta potentials increased to −4, −5 and −4 mV, respectively. Drug encapsulation did not change the MNPs size drastically, but the presence of GEM and PTX shifted the nanoparticle zeta potential close to zero, which could interfere with the nanoparticle stability. We analyzed MNPs superficial charge in lysosomes pH (4.4) and observed a negative zeta potential in the vesicles loaded with PTX. We also investigated nanoparticle stability in DMEM culture medium (Dulbecco's Modified Eagle's Medium) supplemented with fetal bovine serum (FBS). All groups of nanoparticles were incubated for 4, 8, 12, 24, 36 and 48 h at 37 °C in a shaker before the analyses of size and zeta potential (Fig. 1).| Nanoparticles | pH 4.4 | pH 7.4 | ||||
|---|---|---|---|---|---|---|
| Size (nm) | Zeta potential ζ (mV) | Size (nm) | Zeta potential ζ (mV) | |||
| NTA | DLS | NTA | DLS | |||
| MNPs | 238 ± 4 | 450 ± 50 | 4.33 ± 1 | 187 ± 5 | 242 ± 2 | −11.23 ± 1 |
| MNP-GEM | 155 ± 5 | 410 ± 80 | 1.54 ± 1 | 130 ± 1 | 142 ± 2 | −4.26 ± 2 |
| MNP-PTX | 226 ± 7 | 360 ± 60 | −6.92 ± 1 | 122 ± 2 | 139 ± 3 | −5.02 ± 2 |
| MNP-GEM-PTX | 270 ± 20 | 250 ± 60 | −8.61 ± 1 | 154 ± 5 | 152 ± 4 | −4.15 ± 1 |
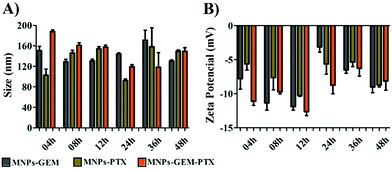 | ||
| Fig. 1 Size (A) and zeta potential (B) of MNP-GEM, MNP-PTX and MNP-GEM-PTX at 4, 8, 16, 24, 36, and 48 h in DMEM supplemented with 10% FBS. | ||
Nanoparticle stability and aggregation phenomena are important parameters to be optimized for biological applications. As shown in Fig. 1, nanoparticles kept in cell culture medium maintained their hydrodynamic diameter despite the adsorption of proteins that created a protein corona on the MNPs surface. The interaction with FBS constituents reduced the MNP-GEM-PTX zeta potential to −13 mV, in contrast to the superficial charge in saline solution at pH 7.4 (−4 mV). After 48 h of interaction with DMEM, we did not observe drastic variations in the size and superficial charge, demonstrating good stability in all experimental groups. Therefore, at physiological pH, the nanoparticles with and without chemotherapeutics are stable in vitro during the period analyzed.
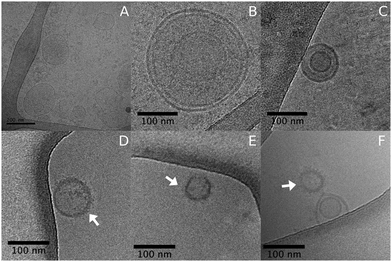
Atomic force microscopy (AFM) and field emission scanning electron microscopy (FEG-MEV) were used to investigate the morphology of the plasma membrane-derived nanoparticles from the pancreatic cancer cell line (Fig. S1, ESI†). Transmission electron microscopy (TEM) images confirmed the results from DLS and NTA, with nanoparticle size around 100–400 nm. We also analyzed MNPs morphology and size distribution by cryo-microscopy (Cryo-TEM). Fig. 2 shows the nanoparticles containing PTX and GEM, which presented a vesicular shape. Additionally, we visualized a fuzzy shade in the lipid bilayer from MNP-GEM-PTX (Fig. 2D–F), indicating an interaction between chemotherapeutics and membrane proteins on the surface of the nanoparticles as verified by the change in the zeta potentials. The distinct dimensions of MNP-PTX and MNP-PTX-GEM are related to the drug retention and adsorption of culture medium proteins on the nanoparticle surface. As demonstrated by cryo-microscopy, the arrows indicate a shade created by protein corona constituents and chemotherapeutic molecules on the lipid bilayer. Protein-stabilizing molecules (PTX) or drugs to interfere in DNA replication (GEM) may affect the MNPs dimensions, folding the polypeptides by the chemotherapeutic agents’ activities. A difference in the MNPs sizes was observed in the first 4 h after dispersion in DMEM as shown in Fig. 1. After 48 h, these differences were no longer observed. In PBS at pH 7.4, the sizes of MNP-PTX and MNP-PTX-GEM were very close after the extrusion (∼139 nm and ∼152 nm, respectively) (Table 1), revealing the effects from the culture medium proteins on the nanoparticle size stability during the in vitro experiments.
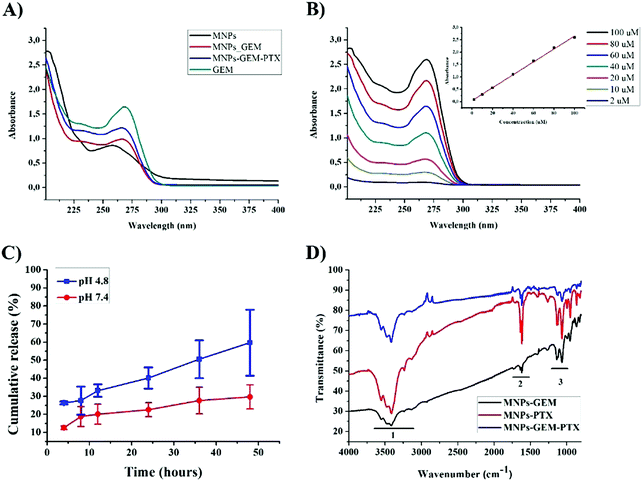
Incorporation of chemotherapeutic agents in MNPs was investigated by UV/Visible spectroscopy using the Beer–Lambert law for pure MNPs, MNP-GEM, and MNP-PTX (Fig. 3A). It was estimated that approximately 50 μM of the drug was loaded in 1 × 10⁹ particles, by measuring the absorbance value of MNPs and GEM at 262 nm and 270 nm, respectively. Drug release was carried out in PBS (pH 4.8 and pH 7.4) and the concentration was determined using GEM standard curves (Fig. 3B and C).
We estimated the protein concentration in the MNPs using Bradford's assay and gel electrophoresis. Approximately 150 μg ml−1 of 50–65 kDa-protein was extracted from 2 × 10⁷ cells. We decided to confirm the MNPs composition by infrared spectroscopy, analyzing the chemical bonds present in polypeptide chains. Because of the high concentration of proteins, bands related to carbon, oxygen, and hydrogen are highlighted in the spectrum, verifying the effectiveness of chemical treatments in functionalized walls. The molecular vibrations of O–H stretches, N–H bonds and secondary amines were assigned in the graph between 3200 cm−1 to 3700 cm−1 in all experimental groups (region 1, Fig. 3D). C–H, secondary amines, angular deformation of N–H and CH2–NH2 bonds were observed in the region from 1500 cm−1 to 1750 cm−1 (region 2). The third region corresponds to carboxylic acid and C–N stretching from primary amines (1100 cm−1 and 1200 cm−1, respectively).
3.2 Interactions of nanoparticles with tumor cells and monocytes from healthy donors
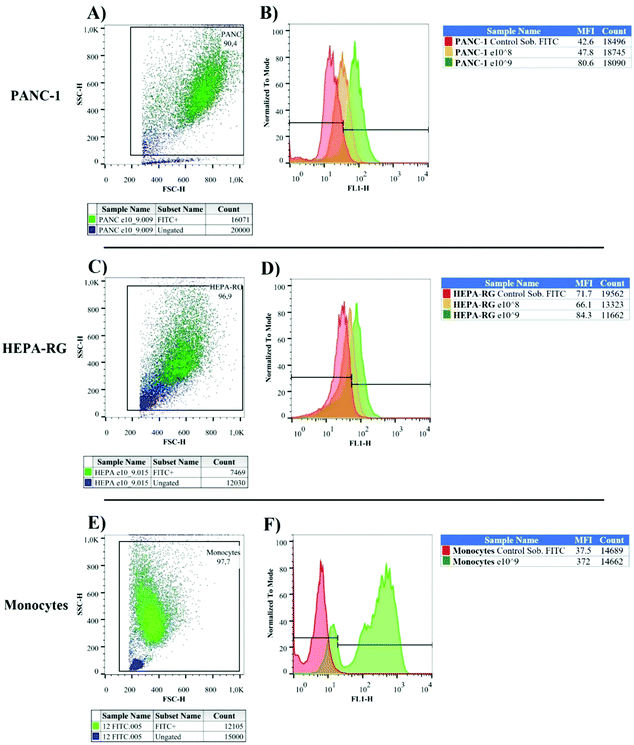
We used nanoparticles previously stained with fluorescein isothiocyanate (FITC) to investigate their interactions with pancreatic cancer cells, healthy liver cells, and immunocompetent cells. FITC fluorochrome emits green light when excited with light at the wavelength of 488 nm, and can be detected by flow cytometry. This assay was performed with only FITC-labeled MNPs to prove their interaction with tumor cells. As a result, we observed a high percentage of tumor cells FITC+, in contrast with the hepatic cell lines (Fig. 4A–D). The frequency of nanoparticles on the cell surface was estimated by examining the median fluorescence intensity (MFI). After treatment with MNPs, pancreatic cancer cells FITC+ doubled the value of MFI over their respective control groups (cells not exposed to MNPs). This result was not observed in HEPA-RG cell lines, indicating less interaction on the surface of hepatic cells and great specificity to PANC-1.Monocytes, macrophages, neutrophils, and dendritic cells captured nanoparticle very quickly, limiting the delivery of chemotherapeutic agents in diseased sites.26,27 Consequently, we decided to investigate MNPs interactions with monocytes from healthy donors to confirm if peripheral blood cell phagocytes contained a large number of fluorescein-labeled particles (Fig. 4E and F). Our results indicate that 97% of monocytes were FITC+ with MFI values 10× greater than white blood cells treated with FITC stock solution in the same molar concentration adsorbed at MNPs (control group = 37.5; FITC+-MNPs = 372).
Confocal microscopy confirmed the specific internalization of MNPs in pancreatic cancer cells (Fig. S2, ESI†). In PANC-1, red fluorescence from the cell membrane surrounded green fluorescence that did not interfere in blue fluorescence from the cell nucleus, suggesting the internalization of MNP-FITC+. The images revealed the nanoparticle distribution in the cytoplasm without membrane residue. Meanwhile, the presence of antigenic material improved the particle association on the pancreatic cell surface, making the intensity of MNPs more regular in the PANC-1 cytoplasm than in the control group with HEPA-RG cells (Fig. S2, ESI†), as previously described by MFI values in Fig. 4B and D.
3.3 Nanoparticle cytotoxicity
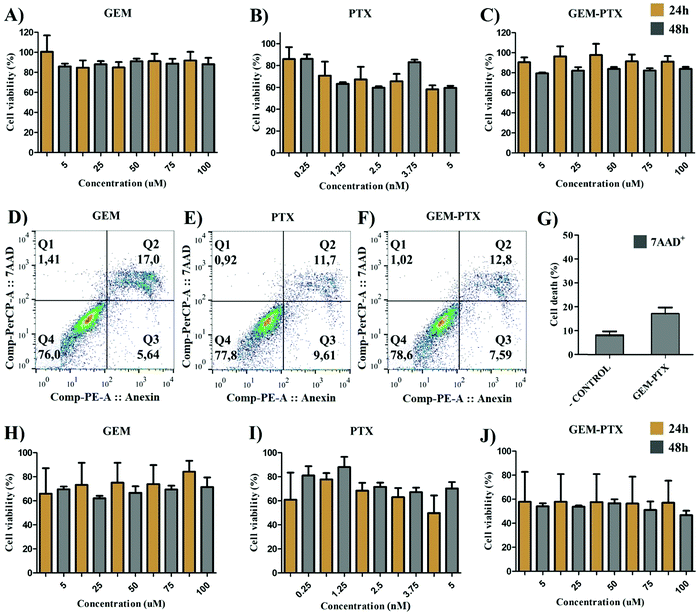
We conducted the methyl tetrazolium (MTT) colorimetric assay to evaluate the toxicity of MNPs and chemotherapeutics in PANC-1 and HEPA-RG cell lines, determining their concentration for use in the in vitro experiments. Our data indicated that the exposure of pancreatic cancer to pure antineoplastic agents (Fig. 5A–C) did not promote the reduction in cell viability in all concentrations tested. These results were confirmed by apoptosis (annexin+) and necrosis (7AAD+) assays performed in the flow cytometer (Fig. 5D–G). In contrast, pure GEM-PTX increased the treatment effectiveness in HEPA-RG (Fig. 5H–J), demonstrating the importance of using nanoparticles to inhibit side effects in untargeted cells.Pure MNPs did not exhibit toxicity after 24 h and 48 h (Fig. S3a, ESI†). Meanwhile, at 1 × 10⁹ particles per ml, MNP-GEM reduced the tumor cell viability by 30% after 24 h of incubation with an increase in toxicity after 48 h (Fig. S3b, ESI†).
For nanoparticles encapsulated with PTX, the cell viability was between 60% and 80% after 24 h, and the low concentration of drugs allowed tumor cells to regrow after 48 h (Fig. S3c, ESI†). The simultaneous delivery of two first-line chemotherapeutics (MNP-GEM-PTX) increased the nanoparticle toxicity, exhibiting greater efficacy at low concentrations in the period of 48 h (Fig. S3d, ESI†). Consequently, we chose to work with 1 × 10⁸ particles per ml in the subsequent tests with cancer cells and healthy peripheral blood cells.
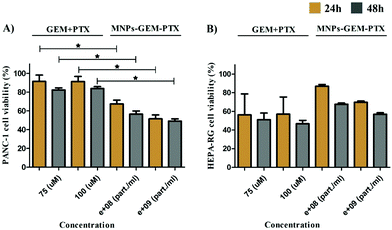
Because the nanoparticles contained parts of pancreatic tumor cell membranes, we determined their specificity upon their incubation with healthy liver cell lines (HEPA-RG). The toxicity of MNP-GEM and MNP-PTX (Fig. S4b and c, ESI†) was similar to PANC-1 after 48 h but MNP-GEM-PTX did not inhibit cell proliferation at low concentrations (Fig. S4d, ESI†). In Fig. 6, we sum up the statistical relevance between PANC-1 and HEPA-RG after treatment with GEM+PTX and nanovesicles loaded with both molecules (MNP-GEM-PTX), demonstrating a higher activity of chemotherapeutics in neoplastic pancreatic cells than in hepatic cell lines when delivered by MNPs at the same molar concentration.
We observed the specificity and the superior cytotoxic effects produced by plasma-membrane-derived nanoparticles in contrast to synthetic lipid nanostructures (Fig. S5, ESI†). Antineoplastic agents were also delivered into pancreatic cancer cells by liposomes synthesized with phosphatidylcholine, phosphatidylserine, and cholesterol (products obtained from Avanti® Polar Lipids). Synthetic liposomes loaded with Gemcitabine and/or Paclitaxel (Lipid-GEM, Lipid-PTX, and Lipid-GEM-PTX) were demonstrated to be less effective than MNPs groups (Fig. S5a–d, ESI†). Interestingly, MNP-GEM-PTX exhibited superior activity in comparison to Lipid-GEM-PTX, indicating that the cell membrane components aid particle interaction in tumor cells.
3.4 Cell death induced via apoptosis and/or necrosis
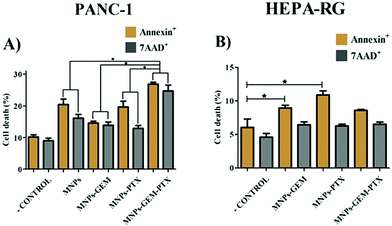
Although MTT experiments indicated metabolic activity in the cells, we decided to verify cancer cell death using the Annexin-V/7AAD assay via flow cytometry. Aiming to investigate whether the MNP-GEM-PTX enhances the effectiveness against pancreatic cancer cells, the induction of apoptosis and/or necrosis cell death was analyzed by labeling Annexin-V and 7-AAD. Annexin-V binds to phosphatidylserine on the cellular membrane. Cells undergoing apoptosis expose this phospholipid on the external surface, enabling the binding of annexin. Moreover, osmotic lysis creates pores on the plasma membrane, allowing 7-AAD to infiltrate and label necrotic cells. After exposure to MNP-GEM-PTX, PANC-1 cells undergo a higher cell death (7AAD+ = 26; Annexin V+ = 27%) (Fig. 7A) than HEPA-RG (7AAD+ = 6%; Annexin V+ = 8%) (Fig. 7B). The combination of PTX and GEM in a single nanoparticle (MNP-GEM-PTX) increased the cytotoxic effects in neoplastic cells in comparison to MNP-GEM and GEM alone, indicating that the microtubule-stabilizing agent favors gemcitabine activity as revealed by previous studies in clinical trials with pure anti-neoplastic drugs.283.5 MNPs effects on monocyte and DCs phenotype from healthy donors
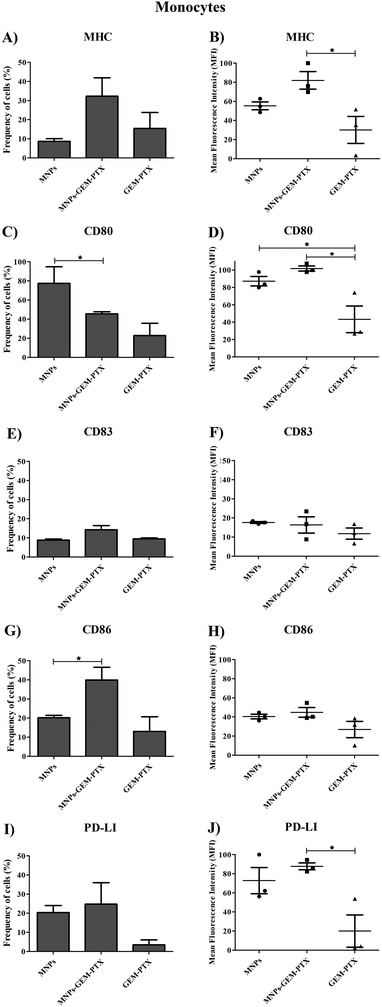
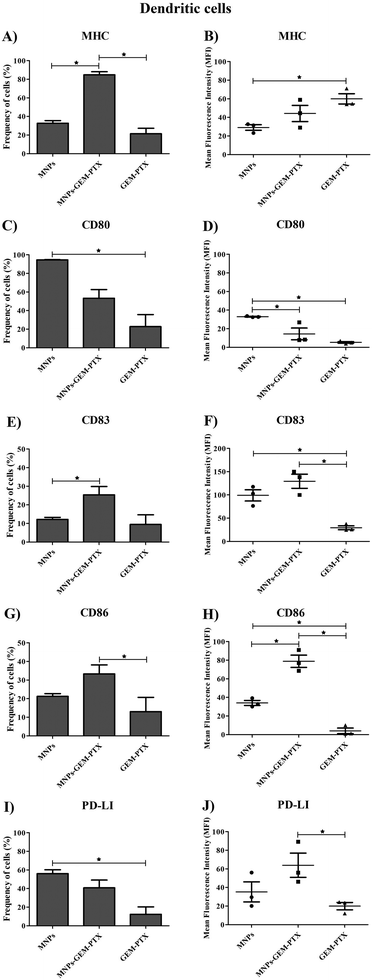
Since monocytes intensely phagocytose MNPs, we examined whether such events would affect cell phenotype and immune responses. Human monocytes and dendritic cells (DCs) were exposed to nanoparticles and the expression of surface markers necessary for antigen-presenting activity was evaluated. Nanoparticles synthesized with GEM and PTX (MNP-GEM-PTX) increased HLA-DR expression while other treatments did not exhibit an equal response (Fig. 8A, B and 9A, B). We also observed that MNPs activated co-stimulatory markers, such as CD80, CD83, CD86, and PD-L1 (Fig. 8C–J and 9C–J), whereas pure GEM-PTX treatment did not exhibit the same effect. The exposure to MNPs promoted an intense phenotype change in APCs, indicating that nanoparticles interfered in immune cell activation, as confirmed by HLA-DR+, CD80+, CD83+, and CD86+ expression.3.6 Mixed lymphocyte reaction (MLR) assays
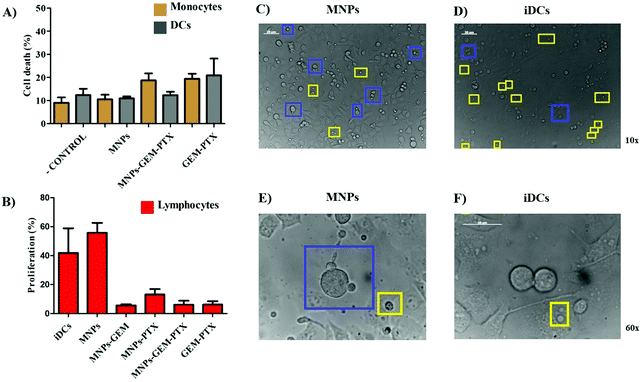
The main function of DCs is to present antigenic material to T lymphocytes. DCs capture foreign antigens, process and express the fragments (epitopes) associated with major histocompatibility complex (MHC) to be recognized by T cells. Since lymphocytes are stimulated to proliferate after binding the alloantigen molecules on DCs, they are co-cultivated in Mixed Lymphocyte Reaction (MLR) assays to reproduce immune cell interactions between MHC and T-cell receptors in vitro. Here, DCs were previously treated with MNPs for 48 h and co-cultured with allogeneic lymphocytes (from different individuals) at the end of this period. After 5 days, we analyzed the total T cell proliferation (CD3+, CD4+, and CD8+), as shown in Fig. 10B, indicating a reduction in DCs ability to induce an allogenic response after exposure to MNP-GEM-PTX, as well as GEM-PTX alone. Although we observed an inefficient allogeneic response from DCs after incubation with nanoparticles carrying chemotherapeutics, MNPs alone increased lymphocyte interaction with pancreatic cancer cell surfaces (Fig. 10C and E). The proteins present in nanovesicles may be processed in DCs and show the antigenic material to total T cells, allowing lymphocytes to recognize pancreatic cell lines. These results were not reproducible in immature DCs (iDCs), immune cells not exposed to antigenic material present in nanovesicles and any other experimental treatments (Fig. 10D and F).4 Discussion
We investigated plasma membrane-derived lipid nanoparticles to transport gemcitabine and paclitaxel, testing their effectiveness on pancreatic cancer cells and also their effects on immunocompetent cells. The toxicity of the experimental groups was evaluated in tumor cells and their immunoregulatory properties in human lymphocytes, monocytes and dendritic cells (DCs) generated in vitro from healthy donors. We synthesized nanovesicles from the main components of neoplastic cell membranes to deliver two first-line chemotherapeutics since the high expression of adhesion molecules favor their association in cancer receptors. Macromolecule residues, e.g., from proteins, contribute to the increased nanoparticle dispersivity in aqueous suspensions, aiding in the avoidance of particle agglomeration and facilitating the encapsulation of additional substances.29To incorporate larger amounts of antineoplastic agents in the nanoparticles, we extruded the real membranes with chemotherapeutic molecules through a polycarbonate membrane of 100 nm.29 After extrusion, physicochemical characterizations were performed to analyze the differences in the nanocarrier structure before and after the incorporation of different agents. Initially, we verified the presence of protein radicals on MNPs by FTIR. Specifically, we observed the bands at 1150, 1625, and 3400 cm−1 corresponding to C–N, CH2–NH2, and CH2–NH–CH2 groups presented in the primary and secondary amines from amino acids.30 The same pattern was also observed in experimental groups encapsulated with GEM and PTX. AFM, SEM and TEM microscopy revealed that no structural changes occurred in the nanoparticles spherical format after the encapsulation of the chemotherapeutics, which exhibited sizes between 100 nm and 250 nm. Additionally, cryo-TEM analysis (Fig. 2) showed a fuzzy smudge in the lipid bilayer of the MNPS-GEM-PTX, which indicated the interaction of the antineoplastic agents with the outer surface of lipid nanoparticles.31 The overshadows in the images of MNPs were intensified due to interactions with proteins, fragments of DNA, and RNA left by this method of isolation.32 The presence of drug molecules on the MNPs surfaces was confirmed by the zeta potential values close to zero in MNP-GEM, MNP-PTX, and MNP-GEM-PTX groups at pH 7.4.
After labeling the MNPs with FITC, we analyzed the interactions between nanoparticles and tumor cell cultures and human monocytes by flow cytometry and confocal microscopy (Fig. 4 and Fig. S2, respectively, ESI†). MNP-FITC+ revealed the interactions between nanoparticles and PANC-1 tumor cells, HEPA-RG cells and primary monocytes from healthy donors, observing a high median fluorescence intensity (MFI) in pancreatic cells FITC+ (whose plasma membranes were extracted to synthesize the nanocomposite) and white blood cells.
Encapsulation efficiency was 50% for GEM, with a cumulative release of 25% in 48 h (109 particle per ml) at pH 7.4. Our data indicated that PANC-1 exposure to pure antineoplastic agents (GEM = 100 μM and PTX = 5 nM) did not reduce cell viability at the same molar concentration used in nanoparticle synthesis (5A to 5F). Previous results indicated a half-maximal inhibitory concentration (IC50) of GEM and PTX above 100 μM and 10 nM, respectively.33,34 A low concentration of nanoparticle (1 × 10⁸ particle per ml) was chosen here to check the improvement produced by MNPs in the treatments. As observed in Fig. 6, pure chemotherapeutics were toxic to HEPA-RG and nanoparticles reduced drug activity in this healthy cell line. Additionally, the liposome nanocarriers showed the same behavior as the free agents when interacting with PANC-1, proving the importance of the plasma membrane proteins for delivery.
The apoptosis/necrosis assay confirmed the low toxicity of MNPs in PANC-1 and HEPA-RG cells (Fig. 7). However, we observed similar toxicity between nanoparticles encapsulated with only one chemotherapeutic agent, indicating the low therapeutic efficiency of the drugs when carried individually in pancreatic cancer cells. PTX incorporation (MNP-GEM-PTX) increased the nanoparticle toxicity, increasing cell death, which leads us to conclude that the presence of PTX improved the cytotoxic capacity of MNP-GEM. Therefore, our results suggest that MNP-GEM-PTX could be more effective than pure GEM and pure PTX in a short period of treatment. This finding is similar to previous studies with nanoparticles conjugated with GEM plus the administration of pure PTX, exhibiting greater toxicity than the simple treatment with GEM on lung,35 mammary, and ovary cancer cells.36,37
The most interesting result was observed in the MNP-GEM-PTX group, indicating that paclitaxel favors MNP-GEM activity in tumor cells (Fig. 7A and Fig. S3, ESI†). Our purpose to deliver antineoplastic agents inside neoplastic cells using plasma membrane-derived nanoparticle was successfully achieved since MNP-GEM-PTX induced more apoptosis/necrosis in PANC-1 than in HEPA-RG. However, it was not sufficient to prevent nanoparticle interaction with monocytes, with MNPs changing their phenotype (Fig. S6 and S7, ESI†) and immune function.
Phagocytic cell engulfment can be used to improve nanocarrier efficiency. In monocytes, MNP-GEM-PTX increased HLA-DR protein and costimulatory molecules CD80, CD83, and CD86 expression, as shown in Fig. 8A–H. This is a relevant result because the nanocomposites can help to re-educate immune-suppressed cells, activating their cytotoxic response in the tumor microenvironment and secondary lymphoid organs. In monocytes, MFI values indicated an increase in HLA-DR expression after exposure to nanoparticles, which did not occur for non-encapsulated PTX-GEM (Fig. 8B). The high expression of HLA-DR is not unexpected since previous studies reported that low doses of GEM and PTX increased the frequency of this activation marker in dendritic cells, increasing immune-cell ability to elicit an anti-tumor response in vitro.38,39 Furthermore, chemotherapeutics delivered by MNPs increased the expression of CD80 and CD86 molecules on the cells. Both molecules are essential in the process of antigen presentation by macrophages and dendritic cells to present antigenic peptides to CD4+ T cells.40 The expression of CD83 (maturation marker protein) was also analyzed and remained constant in monocytes and increased in DCs surface (Fig. 8E, F and 9E, F). Taxol interferes in the assembly and disassembly of microtubules during cell division;41 treatment with MNP-GEM-PTX increases HLA-DR expression on dendritic cells due to the effect on antigen processing and presentation via MHC on the cell surface. Similar to the histocompatibility complex, DCs also increase the frequency of CD83 and CD86 after treatment with MNP-GEM-PTX, suggesting that the expression of costimulatory molecules may be dependent on antigen processing.
Since nanoparticles induce low cytotoxicity in monocytes (Fig. 10A), we evaluated the DCs’ antigen presentation capability induced by MNP-GEM-PTX, observing their influence on DCs in mixed lymphocyte reactions (MLR) (Fig. 10B). Our results demonstrated a high expression of maturation markers, HLA-DR, CD80, CD86, and CD83 after 48 h. This did not inhibit the suppressive effects of chemotherapeutic molecules carried by cancer cell membrane-derived nanoparticles in DCs. The MNPs combined with chemotherapeutics could not prevent lymphocytopenia in future patient treatments, which could be explained by the fact that the agents are interacting in the outer membrane, decreasing the zeta potential values and releasing free working drugs. The depression of allogeneic stimulation may be a consequence of the GEM-PTX cytotoxicity. Since the concentrations examined in this study interfered with lymphocyte proliferation, we reinforce the importance of observing nanoparticle activity in the host immune surveillance cells to achieve a safe antitumor response and to avoid the risk of inducing tolerance.
The antigenic material carried in MNPs seems to promote low allogeneic stimulation. When we examined the activity of lymphocytes co-cultured with DCs treated with MNPs (without chemotherapeutic agents), recognition of total T cells with pancreatic cancer cells was observed (Fig. 10C and E) as a result of the delivery of cell membrane proteins. The same was not observed for DCs without any treatment (iDCs) (Fig. 10D and F).
In summary, we have developed a novel nanostructure for enhancing cancer immunogenicity and modulating the activity of antigen-presenting cells. We synthesized nanoparticles with the main components of pancreatic cancer cell membranes to deliver chemotherapeutics in diseased cells and to transport immunomodulatory agents to carcinoma and immunocompetent cells. Our studies revealed that MNPs are efficient carriers of chemotherapeutics for pancreatic cancer cells, producing cytotoxic effects superior to pure chemotherapy. Although highly phagocyted by monocytes, MNPs did not reveal immune toxicity, inducing the expression of HLA-DR, CD80, CD83, and CD86. Our results contribute to understanding the application of MNPs as antineoplastic agents nanocarriers and their effects on pancreatic cancer and immunocompetent cells. Therefore, this study aids nanomedicine and immunotherapy in complementing each other, encompassing their knowledge to create new therapies to reduce the adverse effects of treatments and to increase clinical results in the future.
Conflicts of interest
The authors declare no competing financial interest.Acknowledgements
This study was funded by the São Paulo Research Foundation (FAPESP) (project number 2018/12670-4) and Brazilian National Council for Scientific and Technological Development (CNPq) (project number 142285/2017-0). The authors acknowledge the Brazilian Nanotechnology National Laboratory (LNNano) for the free use of their facilities (TEM-25144).References
- G. A. Roth, D. Abate, K. H. Abate, S. M. Abay, C. Abbafati, N. Abbasi, H. Abbastabar, F. Abd-Allah, J. Abdela and A. Abdelalim, Lancet, 2018, 392, 1736–1788 CrossRef.
- F. Bray, J. Ferlay, I. Soerjomataram, R. L. Siegel, L. A. Torre and A. Jemal, Ca-Cancer J. Clin., 2018, 68, 394–424 CrossRef.
- A. McGuigan, P. Kelly, R. C. Turkington, C. Jones, H. G. Coleman and R. S. McCain, World J. Gastroenterol., 2018, 24, 4846–4861 CrossRef.
- G. Feldmann, R. Beaty, R. H. Hruban and A. Maitra, Journal of hepato-biliary-pancreatic surgery, 2007, 14, 224–232 CrossRef PubMed.
- M. Abotaleb, P. Kubatka, M. Caprnda, E. Varghese, B. Zolakova, P. Zubor, R. Opatrilova, P. Kruzliak, P. Stefanicka and D. Büsselberg, Biomed. Pharmacother., 2018, 101, 458–477 CrossRef CAS.
- C. Fiorini, M. Cordani, C. Padroni, G. Blandino, S. Di Agostino and M. Donadelli, Biochim. Biophys. Acta, 2015, 1853, 89–100 CrossRef CAS.
- C. Springfeld, D. Jager, M. W. Buchler, O. Strobel, T. Hackert, D. H. Palmer and J. P. Neoptolemos, Presse Med., 2019, 48, e159–e174 CrossRef.
- D. D. Von Hoff, T. Ervin, F. P. Arena, E. G. Chiorean, J. Infante, M. Moore, T. Seay, S. A. Tjulandin, W. W. Ma, M. N. Saleh, M. Harris, M. Reni, S. Dowden, D. Laheru, N. Bahary, R. K. Ramanathan, J. Tabernero, M. Hidalgo, D. Goldstein, E. Van Cutsem, X. Wei, J. Iglesias and M. F. Renschler, N. Engl. J. Med., 2013, 369, 1691–1703 CrossRef CAS PubMed.
- D. J. Lundy, K. H. Chen, E. K. Toh and P. C. Hsieh, Sci. Rep., 2016, 6, 25613 CrossRef CAS PubMed.
- D. Peer, J. M. Karp, S. Hong, O. C. Farokhzad, R. Margalit and R. Langer, Nat. Nanotechnol., 2007, 2, 751 CrossRef CAS PubMed.
- R. W. Robey, P. R. Massey, L. Amiri-Kordestani and S. E. Bates, Anti-Cancer Agents Med. Chem., 2010, 10, 625–633 CrossRef CAS.
- H. Sun, J. Su, Q. Meng, Q. Yin, L. Chen, W. Gu, P. Zhang, Z. Zhang, H. Yu, S. Wang and Y. Li, Adv. Mater., 2016, 28, 9581–9588 CrossRef CAS.
- Z. Chen, P. Zhao, Z. Luo, M. Zheng, H. Tian, P. Gong, G. Gao, H. Pan, L. Liu, A. Ma, H. Cui, Y. Ma and L. Cai, ACS Nano, 2016, 10, 10049–10057 CrossRef CAS PubMed.
- A. V. Kroll, R. H. Fang and L. Zhang, Bioconjugate Chem., 2017, 28, 23–32 CrossRef CAS PubMed.
- A. V. Kroll, R. H. Fang, Y. Jiang, J. Zhou, X. Wei, C. L. Yu, J. Gao, B. T. Luk, D. Dehaini, W. Gao and L. Zhang, Adv. Mater., 2017, 29, 1703969 CrossRef PubMed.
- S. T. Yurkin and Z. Wang, Nanomedicine, 2017, 12, 2007–2019 CrossRef CAS.
- J. J. Moon, H. Suh, A. Bershteyn, M. T. Stephan, H. Liu, B. Huang, M. Sohail, S. Luo, S. H. Um and H. Khant, Nat. Mater., 2011, 10, 243–251 CrossRef CAS PubMed.
- M. Finkelstein and G. Weissmann, J. Lipid Res., 1978, 19, 289–303 CAS.
- T. Kataoka and J. R. W. S. Kinsky, Biochim. Biophys. Acta, Biomembr., 1973, 298, 158–179 CrossRef CAS.
- M. Baghdadi, H. Wada, S. Nakanishi, H. Abe, N. Han, W. E. Putra, D. Endo, H. Watari, N. Sakuragi, Y. Hida, K. Kaga, Y. Miyagi, T. Yokose, A. Takano, Y. Daigo and K. I. Seino, Cancer Res., 2016, 76, 6030–6042 CrossRef CAS.
- X. Luan, Y.-Y. Guan, J. F. Lovell, M. Zhao, Q. Lu, Y.-R. Liu, H.-J. Liu, Y.-G. Gao, X. Dong and S.-C. Yang, Biomaterials, 2016, 95, 60–73 CrossRef CAS.
- Z. Amoozgar, L. Wang, T. Brandstoetter, S. S. Wallis, E. M. Wilson and M. S. Goldberg, Biomacromolecules, 2014, 15, 4187–4194 CrossRef CAS.
- W. Tang, J. Yang, Y. Yuan, Z. Zhao, Z. Lian and G. Liang, Nanoscale, 2017, 9, 6529–6536 RSC.
- R. Lund, R. Leth-Larsen, O. N. Jensen and H. J. Ditzel, J. Proteome Res., 2009, 8, 3078–3090 CrossRef CAS.
- S. Winzen, S. Schoettler, G. Baier, C. Rosenauer, V. Mailaender, K. Landfester and K. Mohr, Nanoscale, 2015, 7, 2992–3001 RSC.
- R. Weissleder, M. Nahrendorf and M. J. Pittet, Nat. Mater., 2014, 13, 125–138 CrossRef CAS PubMed.
- P. Korangath, J. D. Barnett, A. Sharma, E. T. Henderson, J. Stewart, S.-H. Yu, S. K. Kandala, C.-T. Yang, J. S. Caserto, M. Hedayati, T. D. Armstrong, E. Jaffee, C. Gruettner, X. C. Zhou, W. Fu, C. Hu, S. Sukumar, B. W. Simons and R. Ivkov, Sci. Adv., 2020, 6, eaay1601 CrossRef.
- D. D. Von Hoff, T. Ervin, F. P. Arena, E. G. Chiorean, J. Infante, M. Moore, T. Seay, S. A. Tjulandin, W. W. Ma and M. N. Saleh, N. Engl. J. Med., 2013, 369, 1691–1703 CrossRef CAS PubMed.
- R. H. Fang, C. M. Hu, B. T. Luk, W. Gao, J. A. Copp, Y. Tai, D. E. O'Connor and L. Zhang, Nano Lett., 2014, 14, 2181–2188 CrossRef CAS PubMed.
- T. E. Madey and J. T. Yates Jr, Vibrational Spectroscopy of Molecules on Surfaces, Springer Science & Business Media, 2013 Search PubMed.
- C. Corbo, R. Molinaro, F. Taraballi, N. E. T. Furman, M. B. Sherman, A. Parodi, F. Salvatore and E. Tasciotti, Int. J. Nanomed., 2016, 11, 3049 CrossRef CAS.
- J. M. Suski, M. Lebiedzinska, A. Wojtala, J. Duszynski, C. Giorgi, P. Pinton and M. R. Wieckowski, Nat. Protoc., 2014, 9, 312 CrossRef CAS.
- R. A. Fryer, B. Barlett, C. Galustian and A. G. Dalgleish, Anticancer Res., 2011, 31, 3747–3756 CAS.
- Y. Lin, F. Richards, B. Krippendorff, J. Bramhall, J. Harrington, T. Bapiro, A. Robertson, D. Zheleva and D. Jodrell, Br. J. Cancer, 2012, 107, 1692–1701 CrossRef CAS PubMed.
- R. Zhang, J. Yang, M. Sima, Y. Zhou and J. Kopeček, Proc. Natl. Acad. Sci. U. S. A., 2014, 111, 12181–12186 CrossRef CAS.
- M. Lei, S. Sha, X. Wang, J. Wang, X. Du, H. Miao, H. Zhou, E. Bai, J. Shi and Y. Zhu, RSC Adv., 2019, 9, 5512–5520 RSC.
- M. Tachihara, T. Kiriu, A. Hata, Y. Hatakeyama, K. Nakata, T. Nagano, M. Yamamoto, K. Kobayashi, H. Ohnishi and N. Katakami, Cancer Manage. Res., 2019, 11, 7135 CrossRef CAS PubMed.
- P. Correale, M. G. Cusi, M. T. Del Vecchio, A. Aquino, S. Prete, K. Y. Tsang, L. Micheli, C. Nencini, M. La Placa and F. Montagnani, J. Immunol., 2005, 175, 820–828 CrossRef CAS PubMed.
- H. H. Soliman, OncoTargets Ther., 2017, 10, 101 CrossRef CAS.
- G. V. Shurin, N. Amina and M. R. Shurin, Dendritic Cells in Cancer, Springer, 2009, pp. 201–216 Search PubMed.
- X. Shi and X. Sun, Cancer Chemother. Pharmacol., 2017, 80, 909–917 CrossRef CAS.
Footnote |
| † Electronic supplementary information (ESI) available. See DOI: 10.1039/d0ma00367k |
| This journal is © The Royal Society of Chemistry 2020 |

