 Open Access Article
A comparative experimental and theoretical study of the mechanism of graphene oxide mild reduction by ascorbic acid and N-acetyl cysteine for biomedical applications†
Andrea Giacomo
Marrani
 *a,
Alessandro
Motta
ab,
Valentina
Palmieri
cd,
Giordano
Perini
c,
Massimiliano
Papi
 c,
Enrique A.
Dalchiele
e,
Ricardo
Schrebler
f and
Robertino
Zanoni
 a
a
aDipartimento di Chimica, Università degli Studi di Roma “La Sapienza”, Piazzale Aldo Moro 5, I-00185, Rome, Italy. E-mail: andrea.marrani@uniroma1.it
bINSTM UdR Roma, Piazzale Aldo Moro 5, I-00185, Rome, Italy
cDepartment of Neuroscience, Università Cattolica del Sacro Cuore, Largo Francesco Vito, 1, 00168 Rome, Italy
dFondazione Policlinico Universitario A. Gemelli IRCCS, Largo Francesco Vito, 1, 00168 Rome, Italy
eInstituto de Física & CINQUIFIMA, Facultad de Ingeniería, Julio Herrera y Reissig 565, C.C. 30, 11000 Montevideo, Uruguay
fInstituto de Química, Facultad de Ciencias, Pontificia Universidad Católica de Valparaíso, Av. Brasil, 2950, 2340000 Valparaíso, Chile
First published on 1st September 2020
Abstract
A first comparison of the behavior of N-acetyl cysteine (NAC) and ascorbic acid (H2A) towards reduction of graphene oxide (GO) is reported, along with the novel proposition of the associated reaction mechanisms. NAC and H2A are green multi-valent reducing agents, which lead to a mild and biocompatible chemical reduction of oxygenated functional groups in GO. Such reduction has been demonstrated to significantly improve the suitability of GO as a substrate in biomedical applications. A sequence of electrochemical and spectroscopic experiments, theoretical computations and biological tests has been applied to two related series of GO samples mildly reduced with NAC and H2A. These display a downshift of the electrochemical reduction potential characteristic of epoxyl and carbonyl functional groups, associated with an increase in the electron affinity of the substrates. This potential shift, in turn, makes visible a not previously reported reduction feature, associated with hydroxyl groups. Theoretical modelling unveils the reduction mechanisms operating for H2A and NAC on the GO surface, showing their similarity, but also evidencing that NAC remains permanently bonded to the GO surface after reduction, altering the overall reactivity of the reduced GO samples. The mild reduction effect exerted by NAC is stronger in generating attractive biochemical characteristics on GO when compared to H2A. In fact, while administration of NAC to eukaryotic cell lines does not affect the cell viability, this is instead reduced in the case of H2A. The resulting mildly reduced GO materials represent a new step in the direction of GO derivatives with tailored functionalities and oxidation degree for optimized biomedical applications.
Introduction
The use of green reductants for the production of various forms of graphene has been widely reported in the last ten years mainly because it couples a biocompatible chemical route starting from graphene oxide (GO) with low-cost and environmentally friendly production of large-area reduced graphene oxide (rGO). The earliest results were reported with the use of L-ascorbic acid on GO1 and by reducing sugars, such as glucose, fructose and sucrose, on graphene nanosheets.2 These early reports were followed by the use of a number of different green chemicals applied using distinct approaches, as can be found in various reviews appearing in the last few years.3–5In a recent communication, we first proposed a new green method to produce mildly reduced GO (m-rGO), which is based on the use of N-acetyl cysteine (NAC) for different incubation times, as demonstrated by a series of spectroscopic (XPS, Raman, UV-vis), morphological (DLS, AFM, z-potential) and biological results.6 We pioneered the use of NAC in an effort to obtain additional properties of the resulting m-rGO material, which displayed the persistence of NAC at the surface, where it can act as a radical scavenger.6
As reported above, L-ascorbic acid (H2A) has been earlier and widely investigated as a green GO reductant,7,8 but its corresponding mechanism of GO reduction did not receive due attention, apart from tentative hypotheses in two previous reports.3,7 A comparison between H2A and NAC is important and timely, particularly in the light of their distinct behaviour towards GO reduction.
In the present work, we explored in parallel the overall behaviour of NAC and H2A towards GO mild reduction. According to the incubation time, a series of samples has been investigated, which are referred to as NAC 4 h, NAC 24 h, and NAC 72 h and H2A 4 h, H2A 24 h, and H2A 48 h. These samples underwent detailed electrochemical and spectroscopic characterization plus DFT based theoretical modelling of the reduction reaction mechanisms. The resulting behaviours were compared via analysis of cell viability, in order to fully and critically explore the advantages of using mild green reductants in biomedicine.
Experimental
General
All the chemicals used here were of analytical reagent grade and were used as received. Doubly distilled water (ddH2O) was used.Synthesis of GO and mildly chemically reduced GO
A graphene oxide (GO) water dispersion (4 mg mL−1) was purchased from Graphenea (Graphenea Inc., Cambridge, MA, USA) and kept in the dark at room temperature till usage. This GO was synthesized using a modified Hummers oxidation method as indicated by the supplier. The control GO samples were prepared by sonicating the pristine commercial product for 30 min and then diluting it with distilled water down to a concentration of 0.1 mg mL−1. For GO reduction in L-ascorbic acid (Sigma Aldrich, USA) 900 μL of GO (0.1 mg mL−1) was mixed with 100 μL of L-ascorbic acid (H2A) solution in water at a concentration of 10 mg mL−1, for a final concentration of H2A of 1 mg mL−1 and of GO of 0.09 mg mL−1, as reported previously.6 Reduction (partial and complete) was obtained keeping the solution at room temperature for time intervals between 4 hours and 48 hours. At fixed time points (4, 24 and 48 hours) the reaction was stopped by eliminating H2A from the suspension with two centrifugation steps at 14![[thin space (1/6-em)]](https://www.rsc.org/images/entities/char_2009.gif) 000 rpm for 10 minutes. At each step, the pellet was re-suspended in fresh ddH2O. The finally obtained mildly reduced GO (m-rGO) solutions are denominated H2A 4 h, H2A 24 h and H2A 48 h. For the reduction of GO with N-acetyl-L-cysteine (Calbiochem, USA), 100 μL of a solution of 400 mM N-acetyl-L-cysteine (NAC) was mixed with 900 μL of GO solution (0.1 mg mL−1) and then the reduction was performed as described above for H2A, with the only difference being that the incubation time ranged from 4 to 72 hours. Therefore, the m-rGO solutions obtained after reduction with NAC are denominated NAC 4 h, NAC 24 h and NAC 72 h. In all cases, after reduction each sample was sonicated for 5 minutes to obtain homogeneous solutions. The hydrodynamic radius of the samples was assessed by Dynamic Light Scattering (DLS) as previously reported.6 All samples displayed a size below 250 nm after sonication.
000 rpm for 10 minutes. At each step, the pellet was re-suspended in fresh ddH2O. The finally obtained mildly reduced GO (m-rGO) solutions are denominated H2A 4 h, H2A 24 h and H2A 48 h. For the reduction of GO with N-acetyl-L-cysteine (Calbiochem, USA), 100 μL of a solution of 400 mM N-acetyl-L-cysteine (NAC) was mixed with 900 μL of GO solution (0.1 mg mL−1) and then the reduction was performed as described above for H2A, with the only difference being that the incubation time ranged from 4 to 72 hours. Therefore, the m-rGO solutions obtained after reduction with NAC are denominated NAC 4 h, NAC 24 h and NAC 72 h. In all cases, after reduction each sample was sonicated for 5 minutes to obtain homogeneous solutions. The hydrodynamic radius of the samples was assessed by Dynamic Light Scattering (DLS) as previously reported.6 All samples displayed a size below 250 nm after sonication.
Electrochemical study of GO and m-rGO samples
First, GO and m-rGO layers were deposited onto glassy carbon electrodes (GCE), which were pre-treated as follows. Before the modification, the GCE was sequentially polished with 0.3 and 0.05 μm Al2O3 powder and then washed successively with anhydrous ethanol and ddH2O in an ultrasonic bath and dried in air.GO and m-rGO thin films were prepared by casting a 50 μL drop of GO and m-rGO suspensions, previously sonicated for 30 min, onto the GCE surface (diameter of 3 mm), and dried naturally at room temperature in air.
All the electrochemical experiments were carried out in a conventional three electrode glass cell comprised of a working electrode (GO or m-rGO film over GCE), a counter electrode (Pt wire) and a reference electrode (Ag/AgCl (KCl 3.5 M), U = 0.205 V vs. NHE). All the potentials in this study are given with reference to this reference electrode. Electrochemical experiments were performed in 0.1 M phosphate (K2HPO4/KH2PO4) buffered saline (PBS) solution as a supporting electrolyte; the pH was fixed at 7.2. The electrochemical reduction of the GO and m-rGO samples was carried out by cyclic voltammetry (CV) within the potential window 0.2 to −1.6 V, at a 20 mV s−1 potential scan rate. Electrochemical measurements were performed using a Bio-Logic SP-150 potentiostat/galvanostat driven by the Bio-Logic EC-Lab® software.
X-ray photoelectron spectroscopy characterization
In order to perform XPS measurements, GO and m-rGO suspension samples were deposited onto Si(111) surfaces, pre-treated as reported elsewhere.9GO and m-rGO thin films were prepared by casting a 50 μL drop of the corresponding suspension, sonicated for 30 min immediately before use, onto the surface of H-terminated Si(111) substrates, and dried in air under heat (40 °C) for 15 min.
XPS measurements were carried out using a modified Omicron NanoTechnology MXPS system equipped with a monochromatic Al Kα (hν = 1486.7 eV) X-ray source (Omicron XM-1000), operating the anode at 14 kV and 16 mA. All the photoionization regions were acquired using an analyser pass energy of 20 eV, and take-off angles of 21° with respect to the sample surface normal were adopted. The experimental spectra were theoretically reconstructed by fitting the secondary electron background to a Shirley function and the elastic peaks to pseudo-Voigt functions described by a common set of parameters (position, FWHM, Gaussian–Lorentzian ratio) free to vary within narrow limits. The accuracy of the binding energy values was ±0.05 eV, while the error associated with quantitation was ±10%.
Raman spectroscopy characterization
Raman spectra of the m-rGO films deposited onto Si wafers were acquired at room temperature in backscattering geometry with an inVia Renishaw micro-Raman spectrometer equipped with an air-cooled CCD detector and super-Notch filters. The emission line at 488.0 nm from an Ar+ ion laser was focused on the sample under a Leica DLML microscope using a 5× objective. The power of the incident beam was about 5 mW. The spectra were calibrated using the 520.5 cm−1 line of the silicon wafer used as a support for the m-rGO deposits, and 10 s accumulations were used for each spectrum with a resolution of 2 cm−1.UV-vis spectroscopy analysis
Optical UV-vis spectra of GO or m-rGO were obtained using a Cytation 3 (Biotek, USA); at least 3 different measurements per sample were averaged. The UV-vis spectra were used to obtain Tauc plots in order to determine the optical bandgap in selected samples.Cell viability and evaluation of reactive oxygen species (ROS) production
For cell viability measurements, U87 human glioblastoma cells were seeded on 24-well plates at a concentration of 1 × 10⁵ cells mL−1. After 24 hours of incubation at 37 °C, 5% CO2, the cells were treated with GO or m-rGO solutions at a final concentration of 20 μg mL−1 for 24 hours. After the treatment, the medium was carefully washed and replaced with fresh medium containing 20 μL of CellTiter-Blue (Promega) per 100 μL of medium and incubated in the dark at 37 °C in 5% CO2 for 2 hours. The fluorescence intensity was then recorded with a Cytation 3 Cell Imaging Multi-Mode Reader by exciting at 550 nm and reading the emission at 600 nm.For the detection of ROS, the fluorinated derivative of 2′,7′-di-chlorofluorescein (H2DCFDA) was employed. This probe is non-fluorescent until the acetate groups are removed by intracellular esterases and oxidation occurs within cells. Thus, oxidation can be detected by monitoring the increase in fluorescence intensity. This technique allows for the screening of a larger number of cells compared to fluorescence microscopy. Cells were seeded on 24-well plates at a concentration of 1 × 10⁵ cells mL−1. After 24 hours of incubation at 37 °C, 5% CO2, the cells were treated with GO or m-rGO at a concentration of 20 μg mL−1 for 24 hours. After the treatment, the medium was carefully washed and replaced with PBS containing 10 μM H2DCFDA. The cells were incubated for an additional hour at 37 °C, in 5% CO2. PBS containing H2DCFDA was then removed and the cells were resuspended in complete medium. The fluorescence intensity of H2DCFDA was measured by using a Cytation 3 Cell Imaging Multi-Mode Reader by exciting at 495 nm and recording the emission at 528 nm.
Computational details
Calculations were performed adopting the B3LYP hybrid GGA functional. The standard all-electron 6-31G** basis10 was used for all atoms. Molecular geometry optimization of stationary points was carried out without symmetry constraints, by analytical gradient techniques. Frequency analysis was performed to obtain thermochemical information about the reaction pathways at 298 K and 1 atm using the harmonic approximation. All calculations were performed using the G16 code11 on Linux cluster systems. Graphene and graphene oxide were modelled adopting a cluster approach. For the reduction process only basal epoxyl and edge carbonyl groups were considered.Results
The two series of samples produced by contacting GO flakes with NAC or H2A solutions for different extents of time at room temperature were subjected to a sequence of electrochemical and spectroscopic measurements, and to biological tests. The corresponding chemical reduction mechanisms were investigated with theoretical computations as well. The results are reported and discussed in the following sections.Electrochemical study and LUMO levels
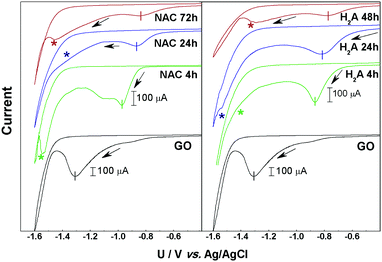
Fig. 1 reports the results from CV measurements made on the two series of m-rGO/GCE electrode samples denoted as NAC 4 h, 24 h, and 72 h and H2A 4 h, 24 h and 48 h, as well as the CV of the control GO/GCE one.In all the current/potential (U) voltammograms, an irreversible cathodic feature is visible in the range −0.8 to −1.35 V, with intensities depending on the samples. As we already reported in the case of GO films, this peak can be associated with the electrochemical reduction of epoxyl and carbonyl groups, respectively bound to the basal plane or at the edges of GO.9,12 After the first voltammetric cycle no significant reduction signal can be detected (see Fig. S1–S7 in the ESI†), suggesting that the reduction of these electroactive groups is quantitative within the first potential scan. The charge exchanged during the reduction process, determined by the area of the main CV peak (see Fig. 1 and Table S1 in the ESI†), decreases along with the reduction time in both the NAC and H2A samples. The current decay trend is strictly related to the abundance of epoxyl and carbonyl functional groups on the GO surface.
Another relevant feature evident in the cyclic voltammograms of the m-rGO samples is a further reduction signal falling in the potential range −1.2 to −1.55 V (indicated by asterisks in Fig. 1), i.e., immediately before the cathodic current rise due to H2 evolution. This feature is clearly evident in the NAC 4 h, NAC 72 h, H2A 24 h, and H2A 48 h samples, and it is still present as a bump in NAC 24 h and H2A 4 h, but it is definitely absent in pristine GO.
In the sequence of m-rGO samples differently treated with NAC and H2A, the onset potential of the first main CV reduction peak progressively moves toward more anodic potentials as the incubation time with the reductant increases (see Fig. 1). This can be ascribed to an increase of the electron affinity values along the series of m-rGO samples, when compared to GO, as demonstrated here below.13 Among other relevant parameters (Fermi level, work function, etc.), the electron affinity is a key ingredient that defines the electronic structure of all interfaces between a material and the environment, and controls the processes of charge exchange and transport across interfaces in all electronic devices.14–16 To estimate the electron affinity from the measured redox potentials, it is necessary to correlate the electrochemical potentials to the vacuum level.16–18 On the basis of the values of the reduction onset potentials (Uonset![[thin space (1/6-em)]](https://www.rsc.org/images/entities/char_2009.gif) vs.
vs.![[thin space (1/6-em)]](https://www.rsc.org/images/entities/char_2009.gif) Ag/AgCl, see Table S1 in the ESI†), the lowest unoccupied molecular orbital (LUMO) energy levels (ELUMO) for the NAC and H2A m-rGO samples were calculated. The LUMO energy can be determined through the following two equations:16,17,19,20
Ag/AgCl, see Table S1 in the ESI†), the lowest unoccupied molecular orbital (LUMO) energy levels (ELUMO) for the NAC and H2A m-rGO samples were calculated. The LUMO energy can be determined through the following two equations:16,17,19,20
ELUMO = −e(Uonset![[thin space (1/6-em)]](https://www.rsc.org/images/entities/char_2009.gif) vs. vs.![[thin space (1/6-em)]](https://www.rsc.org/images/entities/char_2009.gif) NHE + 4.75) NHE + 4.75) |
Uonset![[thin space (1/6-em)]](https://www.rsc.org/images/entities/char_2009.gif) vs. vs.![[thin space (1/6-em)]](https://www.rsc.org/images/entities/char_2009.gif) NHE = Uonset NHE = Uonset![[thin space (1/6-em)]](https://www.rsc.org/images/entities/char_2009.gif) vs. vs.![[thin space (1/6-em)]](https://www.rsc.org/images/entities/char_2009.gif) Ag/AgCl + 0.205 Ag/AgCl + 0.205 |
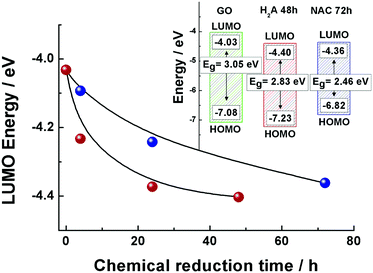
The LUMO positions for both the GO and m-rGO samples are shown in Fig. 2 as a function of the chemical reduction time with H2A and NAC (see Table S1 in the ESI†). It can be seen that upon reduction the LUMO position approaches the Fermi level of graphene, −4.5 eV,13,21–24 apparently more rapidly in the case of reduction exerted by H2A. As each electrode voltammogram only exhibited a main cathodic peak (see Fig. 1), the highest occupied molecular orbital (HOMO) energy levels (EHOMO) for the NAC and H2A m-rGO samples have been calculated through the optical bandgap Eg.25 In fact, the HOMO positions have been extracted using the following equation:13,26
| EHOMO = (ELUMO − Eg) |
Raman spectroscopy analysis
In order to comparatively probe defects in a related series of analysed samples, Raman spectroscopy represents an ideal tool. A comparison of the Raman spectra of GO and of its electrochemically reduced form, erGO, evidenced the large extent of the reduction characteristic of the latter, as already reported by us.6,9,27 We undertook Raman analysis in order to investigate in parallel the effect of the two treatment times (24 and 72 h, respectively, for H2A and NAC) which gave comparable optical absorbance spectra, LUMO energy levels and similar aggregative states for the rGO suspensions. The results of such parallel analysis between H2A and NAC are presented here (Fig. 3), based on the G band, which represents the relative extent of graphitization, and on the so-called “disorder” D and D′ bands, Raman forbidden but activated by defects.28–30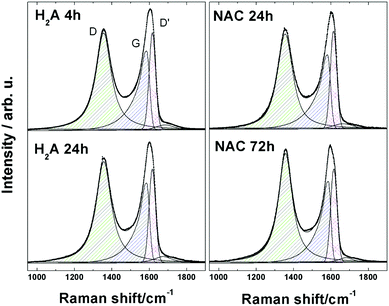 | ||
| Fig. 3 Raman spectra of m-rGO samples: H2A 4 h, H2A 24 h, NAC 24 h and NAC 72 h. Experimental data (dots) have been fitted with symmetric and asymmetric Lorentzian model curves (continuous lines). | ||
Visual inspection of the complex D and G bands for the H2A and NAC m-rGO samples reveals that they are modestly changed in the overall shape, if compared to GO.6 Inspection of the values reported in Table 1 clearly shows that the H2A and NAC samples undergo an evolution from GO to a more reduced state upon extension of the incubation time, as inferred from the corresponding values of the ID/(IG + ID′) height ratio. In fact, following the interpretation given in the literature and reported in our previous papers, an increasing trend of this ratio can be considered as a consequence of an increasing quantity of disorder, which is, in turn, associated with the appearance of new carbon sp2 domains at the expense of carbon–oxygen bonds.6,9,27,31
| Sample | Raman shift (cm−1)/FWHM (cm−1) | ||||
|---|---|---|---|---|---|
| D | G | D′ | I D/(IG + ID′)a | L a (nm) | |
| a Height ratio. b Data taken from ref. 27. | |||||
| H2A 4 h | 1357/99 | 1586/71 | 1616/41 | 0.83 | 16.4 |
| H2A 24 h | 1356/98 | 1586/68 | 1616/41 | 0.85 | 16.0 |
| NAC 24 h | 1355/99 | 1582/73 | 1614/41 | 0.85 | 16.0 |
| NAC 72 h | 1357/90 | 1586/64 | 1615/41 | 0.97 | 13.2 |
| erGOb | 1356/66 | 1592/45 | 1623/30 | 1.27 | 10.7 |
| GOb | 1356/118 | 1607/86 | 0.73 | 18.6 | |
This is further confirmed by the values of the average crystallite size of the sp2 lattice, La, reported in Table 1 and calculated using the equation:32
The most significant point is that the reduction processes of the H2A and NAC samples come to a final extent which is still extra mild, as can be inferred from the trend in FWHM values for peaks D, reported in the literature as a parameter strictly related to the degree of reduction of GO.33 Such values for the H2A and NAC samples fall between those for GO and erGO, but are definitely closer to GO. An analogous trend is consistently followed also by the G and D′ peaks, see Table 2, and by the 2D and D + G peaks, see Fig. S9 and Table S2 in the ESI.†
| Sample | Red. | C–OH | C–O–C | C![[double bond, length as m-dash]](https://www.rsc.org/images/entities/char_e001.gif) O O |
CO2H | C![[double bond, length as m-dash]](https://www.rsc.org/images/entities/char_e001.gif) Cgrb Cgrb |
C![[double bond, length as m-dash]](https://www.rsc.org/images/entities/char_e001.gif) C C |
|---|---|---|---|---|---|---|---|
a Ratios are determined from the area of single components divided by the overall C 1s signal (Ctot). The associated error is ±10%.
b Component at 284.55 eV in m-rGO samples.
c Possible presence of C![[double bond, length as m-dash]](https://www.rsc.org/images/entities/char_e001.gif) O from adsorbed NAC.
d Possible presence of COOH from adsorbed NAC.
e Possible presence of adsorbed H2A. O from adsorbed NAC.
d Possible presence of COOH from adsorbed NAC.
e Possible presence of adsorbed H2A.
|
|||||||
| GO | — | 7.4 | 30.0 | 10.8 | 3.9 | — | 47.9 |
| m-rGO | NAC 4 h | 13.1 | 20.3 | 6.4c | 7.5d | 0.9 | 51.8 |
| m-rGO | NAC 24 h | 10.4 | 15.4 | 11.7c | 9.7d | 7.0 | 47.8 |
| m-rGO | NAC 72 h | 10.3 | 15.7 | 11.5c | 8.0d | 6.9 | 47.6 |
| m-rGO | H2A 4 h | 11.5 | 24.8 | 8.2 | 6.5 | 3.7 | 45.3 |
| m-rGO | H2A 24 h | 8.5 | 24.3 | 7.9 | 5.9 | 6.4 | 47.0 |
| m-rGO | H2A 48 he | 13.8 | 17.9 | 8.8 | 11.6 | 17.3 | 30.6 |
X-ray photoelectron spectroscopy characterization
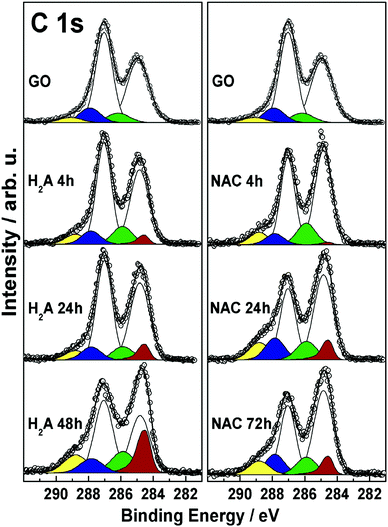
In order to further explore and compare the presence and fate of the various functional groups with the extent of reduction, XPS results coming from the two series of NAC and H2A samples are collected in Fig. 4 and discussed in the following.The C 1s spectra are complex peaks, as expected, and have been subjected to curve fitting in order to extract, assign and quantify the corresponding peak components. The sequence of features obtained is consistent with previous reports,6,9,34,35 and evidences the presence and fate of the distinct C–C and C–O functionalities present at the GO surface at the different reduction steps. In all samples, these functionalities are associated with the following components: sp2-hybridized C atoms (284.85 eV, white), and hydroxyl (285.85 eV, green), epoxyl (287.05 eV, light cyan), carbonyl (287.85 eV, blue), and carboxyl (288.85 eV, yellow) groups.36 In addition, in all m-rGO samples a further component is needed to account for the variation in the low-BE line shape after incubation with H2A and NAC. This asymmetric feature (284.55 eV, red) is related to the restoration of π-delocalized C![[double bond, length as m-dash]](https://www.rsc.org/images/entities/char_e001.gif) C bonds6,9,34,35 upon chemical reduction of GO with the green reductants. Upon reduction with NAC, the XP spectra of the resulting m-rGO samples show several differences compared to pristine GO. The most evident is the decrease of the epoxyl component (light cyan) with increasing incubation time (see Table 2), mostly occurring in the first 24 h period. At the same time, the graphene-like component (C
C bonds6,9,34,35 upon chemical reduction of GO with the green reductants. Upon reduction with NAC, the XP spectra of the resulting m-rGO samples show several differences compared to pristine GO. The most evident is the decrease of the epoxyl component (light cyan) with increasing incubation time (see Table 2), mostly occurring in the first 24 h period. At the same time, the graphene-like component (C![[double bond, length as m-dash]](https://www.rsc.org/images/entities/char_e001.gif) Cgr, red) rises, apparently with the same rate. Other important variations involve the carbonyl and hydroxyl moieties. The former decrease in the short period (NAC 4 h), likely due to consumption after the effect of NAC, but tend to increase again in the long period (see Table 2). Hydroxyl groups, instead, show a discrete but significant increase compared to the parent GO samples.
Cgr, red) rises, apparently with the same rate. Other important variations involve the carbonyl and hydroxyl moieties. The former decrease in the short period (NAC 4 h), likely due to consumption after the effect of NAC, but tend to increase again in the long period (see Table 2). Hydroxyl groups, instead, show a discrete but significant increase compared to the parent GO samples.
When H2A is used to reduce GO, similar effects can be evidenced through the XP spectra in the C 1s region. In fact, the major impact of H2A is on the epoxyl moieties, yet with a significant change after 24 h of incubation, strictly paralleled by an increase in the graphene-like component (red). This latter component in the H2A 48 h sample is found to increase up to 17.3% of the total carbon species (see Table 2), which is in keeping with the above reported rapid decrease of the energy position of the LUMO level. The carbonyl component is quickly reduced to around 8% atomic concentration as a consequence of H2A chemical attack. As to the hydroxyl component, it shows an increase compared to GO, with no apparent trend. In conjunction, an increase in the concentration of –COOH groups is detected, especially for the H2A 48 h sample.
A close correspondence has been found for both series of m-rGO samples between the decreasing concentration trend of the epoxyl C 1s XPS component intensity and the charge exchanged during the first reduction event (around −0.8 V vs. Ag/AgCl) recorded in the CV experiments of Fig. 1 (see Table S1 in the ESI†). This parallelism is depicted in Fig. 5 for both samples reduced with NAC and H2A green reductants. Though the first peak in the electrochemical reduction of GO has been reported to be a convolution of two closely falling signals12 related to epoxyl and carbonyl groups, in the comparison reported in Fig. 5 the XPS atomic percentage of the latter moiety has been discarded, due to the possible contribution from non-electroactive C![[double bond, length as m-dash]](https://www.rsc.org/images/entities/char_e001.gif) O groups of adsorbed NAC molecules. Nevertheless, the decrease of C–O–C significantly parallels the variation of charge exchanged during CV in both series, and further supports the hypothesis of a chemical attack of NAC and H2A towards epoxyl and carbonyl groups of GO.
O groups of adsorbed NAC molecules. Nevertheless, the decrease of C–O–C significantly parallels the variation of charge exchanged during CV in both series, and further supports the hypothesis of a chemical attack of NAC and H2A towards epoxyl and carbonyl groups of GO.
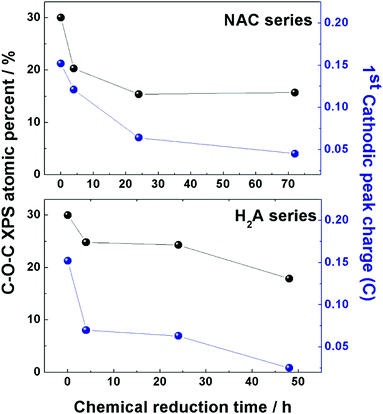 | ||
| Fig. 5 Comparison between the atomic percentage of epoxyl groups (black dots) present in the two series of m-rGO samples, NAC (upper panel) and H2A (lower panel), obtained from elaboration of C 1s XP spectra and reported in Table 2, and the charge exchanged (blue dots) during the first reduction event in the CV experiments of the same two series of samples. Data of charge are reported in Table S1 (ESI†). | ||
Theoretical calculations
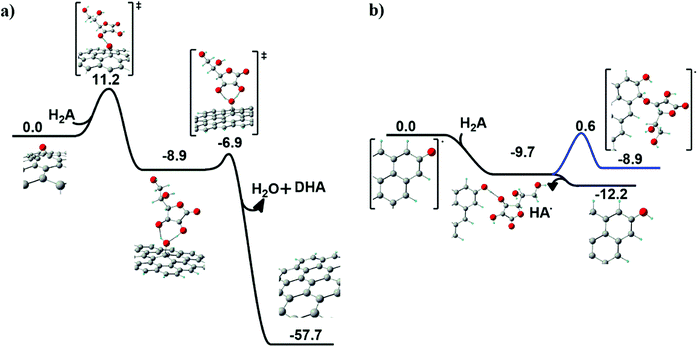
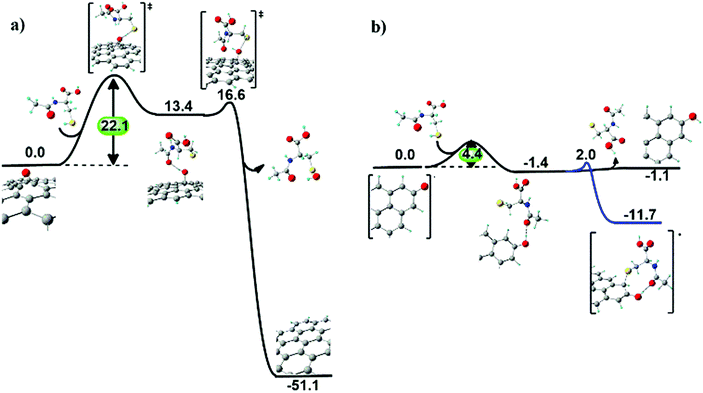
Chemical reduction of graphene oxide (GO) was scrutinized by an unprecedented modelling approach of ascorbic acid (H2A) and N-acetyl cysteine (NAC) on the GO surface. In both cases, the two prototypical oxygenated functional groups at the GO surface were considered for the reduction process: the basal epoxyl and the edge carbonyl groups.Ascorbic acid on the GO surface. When ascorbic acid (H2A) approaches an epoxyl group at the GO surface (see Fig. 6a), a hydrogen transfer occurs first between H2A and the surface, producing a basal hydroxyl group and a HA˙ radical species.
A fast second hydrogen transfer completes the reduction of the epoxide, producing water and dehydroascorbic acid (DHA), both leaving the surface, locally restoring the graphitic domain.
The overall reaction is highly exoergonic (ΔG = −57.7 kcal mol−1). The first step in Fig. 6a is the rate-determining step, with an energy barrier of 11.2 kcal mol−1. The radical intermediate arising from the first H transfer is held by an H-bonding network preparing the correct geometrical arrangement for the second H transfer.
On the other hand, when H2A approaches a carbonyl group at the edge of the GO surface, a barrierless exoergonic (ΔG = −9.7 kcal mol−1) H transfer occurs, producing a hydroxyl group bonded to the edge of GO and a radical HA˙ species (see Fig. 6b), which spontaneously leaves the surface (ΔG = −2.5 kcal mol−1). As a further test, the covalent anchoring of HA˙ at the edge of the GO surface was also taken into account. The HA˙ species can coordinate to the carbon vicinal to the hydroxyl group (blue line in Fig. 6b), an isoergonic (ΔG = 0.8 kcal mol−1) process requiring an energy barrier of 10.3 kcal mol−1 to occur. This step leads to the formation of a new ether group bonded to an sp3 carbon atom.
Notably, the energy profile depicted in Fig. 6b reveals that the most probable fate associated with the reduction of a GO carbonyl group is the formation of a hydroxyl group in association with the release of HA˙.
N-Acetyl cysteine on the GO surface. When NAC approaches an epoxyl group at the GO surface (Fig. 7a), a first hydrogen transfer occurs, producing a basal hydroxyl group and a radical sulphide species, similarly to the ascorbic acid case. The radical sulphide species resides vicinal to the surface, due to hydrogen bonding between the surface hydroxyl and the acetyl groups. The hydroxyl group is eventually extracted from the surface, forming a sulfenic acid derivative of NAC and restoring the graphitic domain.
Also in this case, the kinetics of epoxide reduction is dominated by the first hydrogen transfer step, with an energy barrier of 22.1 kcal mol−1. This value is higher than the energy barrier found in the case of ascorbic acid (11.2 kcal mol−1), suggesting a slower (less favourable) process for NAC.
After reduction of a first epoxyl group, the resulting sulfenic acid molecule can reduce two more epoxyl groups of GO via analogous exoergonic mechanisms, passing from sulfenic acid and leading up to the inactive sulfonic acid (see Fig. S10 in the ESI†).
Reduction of carbonyl groups at the edges of GO involves a first hydrogen transfer producing a hydroxyl group, as for the ascorbic acid case. However, in this case the covalent bond of the sulphide radical species to the hydroxyl vicinal carbon atom (ΔG = −11.7 kcal mol−1) is thermodynamically preferred to the removal of the sulphide radical species (ΔG = −1.1 kcal mol−1) from the GO surface (Fig. 7b).
Overall, the three main outcomes of the computed reduction mechanisms of GO exerted by NAC and H2A are: (i) epoxyl groups are fully reduced, with NAC displaying both slightly lower kinetics than H2A and the capability of reducing three C–O–C groups per molecule; (ii) edge carbonyl groups are partially reduced to hydroxyl groups, and (iii) NAC more favourably binds to rGO (via a C–S bond) compared to H2A (via a C–O bond).
Biological tests
GO has been largely exploited in biomedical applications, from antibacterial formulations to gene therapy and tissue regeneration therapies.37–39 However, a great concern about this nanomaterial is its potential cytotoxicity, which must be evaluated prior to the translation of scientific results in clinical settings. Here, a concentration of GO considered safe for in vitro administration was used on the same cell line,40 and we evaluated whether the reduction with H2A or NAC can change the GO effects on a eukaryotic cell line (U87 human glioblastoma). As already reported in the literature, rGO is more cytotoxic than GO,40 and in our experiments m-rGO reduced by ∼25% the cell viability (Fig. 8a, asterisk indicates p < 0.05) when produced by the H2A method. Since excess NAC or H2A, i.e. the fraction not adhering to the GO surface, has been removed from the rGO formulations with several centrifugations prior to cell treatment, the cytotoxicity observed can be ascribed to the reduced graphene oxide.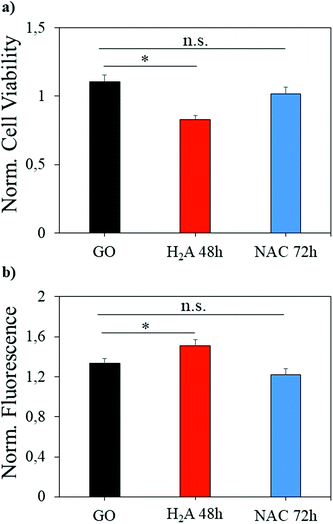 | ||
| Fig. 8 Cell viability (a) and ROS production (b) induced by administration of different samples to the U87 cell line. Significantly different results are highlighted with asterisks (p < 0.05). | ||
It should be noted that the effect is mild, when compared to the literature, since H2A is a green reductant. This effect is mediated by the increase of intracellular ROS production, as it is visible from the H2DCFDA fluorescence increase (Fig. 8b). When NAC is used to perform mild reduction of GO, the viability of cells is restored to levels comparable to GO, and the ROS production is not significantly different from the ROS produced when GO is administered.
Discussion
The overall picture emerging from the above results shows that the electronic properties of the GO surface can be finely and distinctly tuned by a mild chemical reduction process conducted with H2A and NAC. The effects of the NAC and H2A green reductants can be rationalized in terms of partial elimination of epoxyl and carbonyl functional groups, which proceeds further in the time frame of hours and days, and renders more and more facile the electrochemical reduction of the residual oxygenated groups.The not previously reported CV reduction signal of m-rGO, experimentally found before the H2 reduction peak (Fig. 1), suggests that its origin could primarily stem from the modifications induced by the green reductants on the structural electronic properties of GO. In fact, mild chemical reduction induces a partial restoration of the sp2 C network, more efficiently produced by the use of H2A than NAC, as consistently demonstrated by a wide set of experimental data. These include the downshift of the LUMO position associated with an increase in the electron affinity (Fig. 2), together with the increased concentration of sp2 domains observed by Raman spectroscopy (Fig. 3) and the trend of the graphitic component observed in the C 1s XPS region (Fig. 4). Such restoration brings together a downshift of all the reduction potentials. The newly reported reduction signal of m-rGO can then be confidently associated with the reduction of the hydroxyl groups on the GO surface, which are expected to undergo electrochemical reduction at potentials more negative than epoxyl and carbonyl groups.41
The above assignment is further corroborated and refined by theoretical analysis, which contributes to explaining how the mild reducing agents modify the GO surface during the reduction process. In fact, the increasing abundance of hydroxyl groups observed for both the NAC and H2A reductants (Table 2) is related to the fate of the edge carbonyls present on the GO surface, as demonstrated by the modelled energetic profiles of the reduction process of C![[double bond, length as m-dash]](https://www.rsc.org/images/entities/char_e001.gif) O groups due to both the H2A (Fig. 6) and NAC (Fig. 7) reducing agents. In the case of H2A, the reasons for this increase might also be related to the residual presence of H2A (and/or its derivative species) adsorbed at the surface of GO. In this regard, the experimentally found increase of the COOH component (Table 2) may as well be contributed by the lactone group of adsorbed H2A molecules. As a consequence, the appearance of the reduction signal of m-rGO can be attributed to the increasing hydroxyl group abundance in addition to the downshift of all the reduction current potentials, as previously described.
O groups due to both the H2A (Fig. 6) and NAC (Fig. 7) reducing agents. In the case of H2A, the reasons for this increase might also be related to the residual presence of H2A (and/or its derivative species) adsorbed at the surface of GO. In this regard, the experimentally found increase of the COOH component (Table 2) may as well be contributed by the lactone group of adsorbed H2A molecules. As a consequence, the appearance of the reduction signal of m-rGO can be attributed to the increasing hydroxyl group abundance in addition to the downshift of all the reduction current potentials, as previously described.
The distinct modes of operation of GO reduction exerted by H2A and NAC are further evidenced by the spontaneous bonding of NAC to the GO edges, suggested by theoretical calculations. This result is in good agreement with the increase in concentration of C![[double bond, length as m-dash]](https://www.rsc.org/images/entities/char_e001.gif) O groups observed by XPS (Table 2) during the reduction process with NAC, and it is related to the permanence of NAC molecules (bearing an acetyl group), or their derivatives, at the surface of m-rGO. In this regard, a recent report from this group showed that NAC persists at the surface of GO, and demonstrated that it exerts prolonged radical scavenging activity in the form of rGO–NAC adducts.6 As support for this explanation, the carboxyl group signal increases as well, after incubation of GO with NAC (Table 2).
O groups observed by XPS (Table 2) during the reduction process with NAC, and it is related to the permanence of NAC molecules (bearing an acetyl group), or their derivatives, at the surface of m-rGO. In this regard, a recent report from this group showed that NAC persists at the surface of GO, and demonstrated that it exerts prolonged radical scavenging activity in the form of rGO–NAC adducts.6 As support for this explanation, the carboxyl group signal increases as well, after incubation of GO with NAC (Table 2).
The distinct GO reduction mechanisms evidenced for the two green reductants strongly influence the biological response of the different m-rGO samples. In fact, we have demonstrated that, when NAC-reduced m-rGO samples are administered to eukaryotic cells, the ROS production levels are comparable to those related to GO. Therefore, reduction with NAC leads to rGO materials less cytotoxic than those obtained from H2A, which is in full accord with the already reported negligible oxidative capability exerted by NAC on glutathione.6 This opens up new routes in the possible applications of non-cytotoxic rGO materials for biomedical purposes.
Conclusions
A novel and thorough comparison has been presented between the distinct GO reduction behaviours of H2A, the earliest green reductant applied to GO, and of NAC, very recently applied in such a process. For the first time, the reaction mechanisms related to mild GO reduction have been investigated in detail, by making use of results coming from electrochemical, electron affinity, XPS, Raman and cell viability experiments, coupled with a detailed theoretical investigation of the reactivity of NAC and H2A at the GO surface.GO has been shown to undergo a very mild reduction process by either of the two green chemicals, albeit with distinct behaviours. A change in the electron affinity levels of the mildly reduced substrates has been evidenced, quantified, and employed to explain the first experimental observation of an electrochemical feature related to the presence of hydroxyl groups. Relevant and subtler differences between NAC and H2A have been extracted by the combined approach here reported, which can be beneficial for tailoring GO towards its reproducible use as a substrate. Suitable biological tests, here conducted, have enlightened the advantage offered, in such a process, by NAC with respect to the earlier and widely reported use of H2A, which can be particularly beneficial in biomedical advanced applications.
Conflicts of interest
There are no conflicts to declare.Acknowledgements
A. G. M. thanks Sapienza University of Rome for financial support through the Ateneo Projects 2018 (no. RG1181643265D950) and 2019 (no. RM11916B88D8E044). E. A. D. acknowledges CSIC (Comisión Sectorial de Investigación Científica), Universidad de la República, Montevideo, Uruguay, and PEDECIBA – Física. R. S. thanks CONICYT, Chile, through Proyecto FONDECYT No. 1160485, and DII (Pontificia Universidad Católica de Valparaíso, Chile). A. M. acknowledges CINECA award N. HP10CXE6KL 2019 under the ISCRA initiative for the computational resources supporting this work. M. P. and V. P. acknowledge funding from AIRC under IG 2019 – ID. 23124 project. M. P. and R. Z. acknowledge MIUR for funding of PRIN project “ASSEMbLe” 2017RSAFK7.References
- M. J. Fernández-Merino, L. Guardia, J. I. Paredes, S. Villar-Rodil, P. Solís-Fernández, A. Martínez-Alonso and J. M. D. Tascón, J. Phys. Chem. C, 2010, 114, 6426–6432 Search PubMed.
- C. Zhu, S. Guo, Y. Fang and S. Dong, ACS Nano, 2010, 4, 2429–2437 Search PubMed.
- C. Xu, X. Shi, A. Ji, L. Shi, C. Zhou and Y. Cui, PLoS One, 2015, 10, e0144842 Search PubMed.
- M. T. H. Aunkor, I. M. Mahbubul, R. Saidur and H. S. C. Metselaar, RSC Adv., 2016, 6, 27807–27825 Search PubMed.
- K. K. H. De Silva, H. H. Huang, R. K. Joshi and M. Yoshimura, Carbon, 2017, 119, 190–199 Search PubMed.
- V. Palmieri, E. A. Dalchiele, G. Perini, A. Motta, M. De Spirito, R. Zanoni, A. G. Marrani and M. Papi, Chem. Commun., 2019, 55, 4186–4189 Search PubMed.
- J. Gao, F. Liu, Y. Liu, N. Ma, Z. Wang and X. Zhang, Chem. Mater., 2010, 22, 2213–2218 Search PubMed.
- J. Zhang, H. Yang, G. Shen, P. Cheng, J. Zhang and S. Guo, Chem. Commun., 2010, 46, 1112–1114 Search PubMed.
- A. G. Marrani, R. Zanoni, R. Schrebler and E. A. Dalchiele, J. Phys. Chem. C, 2017, 121, 5675–5683 Search PubMed.
- V. A. Rassolov, J. A. Pople, M. A. Ratner and T. L. Windus, J. Chem. Phys., 1998, 109, 1223 Search PubMed.
- M. J. Frisch, et al., GAUSSIAN 16, Revision B.01, Gaussian Inc., Wallingford, CT, 2016 Search PubMed.
- A. G. Marrani, A. Motta, R. Schrebler, R. Zanoni and E. A. Dalchiele, Electrochim. Acta, 2019, 304, 231–238 Search PubMed.
- F. Zheng, W.-L. Xu, H.-D. Jin, X.-T. Hao and K. P. Ghiggino, RSC Adv., 2015, 5, 89515–89520 Search PubMed.
- A. Kahn, Mater. Horiz., 2016, 3, 7–10 Search PubMed.
- S. Lindsay, J. Chem. Educ., 2005, 82, 727–733 Search PubMed.
- F. N. Crespilho, V. Zucolotto, J. R. Siqueira, A. J. F. Carvalho, F. C. Nart and O. N. Oliveira, Int. J. Electrochem. Sci., 2006, 1, 151–159 Search PubMed.
- C. M. Cardona, W. Li, A. E. Kaifer, D. Stockdale and G. C. Bazan, Adv. Mater., 2011, 23, 2367–2371 Search PubMed.
- B. W. Larson, J. B. Whitaker, X.-B. Wang, A. A. Popov, G. Rumbles, N. Kopidakis, S. H. Strauss and O. V. Boltalina, J. Phys. Chem. C, 2013, 117, 14958–14964 Search PubMed.
- D. Gedefaw, M. Tessarolo, M. Bolognesi, M. Prosa, R. Kroon, W. Zhuang, P. Henriksson, K. Bini, E. Wang, M. Muccini, M. Seri and M. R. Andersson, Beilstein J. Org. Chem., 2016, 12, 1629–1637 Search PubMed.
- U. A. Méndez-Romero, S. A. Pérez-García, X. Xu, E. Wang and L. Licea-Jiménez, Carbon, 2019, 146, 491–502 Search PubMed.
- M. Lundie, Ž. Šljivančanin and S. Tomić, J. Mater. Chem. C, 2015, 3, 7632–7641 Search PubMed.
- G. Colherinhas, E. E. Fileti and V. V. Chaban, J. Phys. Chem. Lett., 2015, 6, 302–307 Search PubMed.
- R. Garg, N. Dutta and N. Choudhury, Nanomaterials, 2014, 4, 267–300 Search PubMed.
- M. M. Stylianakis, M. Sygletou, K. Savva, G. Kakavelakis, E. Kymakis and E. Stratakis, Adv. Opt. Mater., 2015, 3, 658–666 Search PubMed.
- L. V. Brownell, K. A. Robins, Y. Jeong, Y. Lee and D. C. Lee, J. Phys. Chem. C, 2013, 117, 25236–25247 Search PubMed.
- T. Majumder, K. Debnath, S. Dhar, J. J. L. Hmar and S. P. Mondal, Energy Technol., 2016, 4, 950–958 Search PubMed.
- A. G. Marrani, A. C. Coico, D. Giacco, R. Zanoni, F. A. Scaramuzzo, R. Schrebler, D. Dini, M. Bonomo and E. A. Dalchiele, Appl. Surf. Sci., 2018, 445, 404–414 Search PubMed.
- A. C. Ferrari, J. C. Meyer, V. Scardaci, C. Casiraghi, M. Lazzeri, F. Mauri, S. Piscanec, D. Jiang, K. S. Novoselov, S. Roth and A. K. Geim, Phys. Rev. Lett., 2006, 97, 187401 Search PubMed.
- L. M. Malard, M. A. Pimenta, G. Dresselhaus and M. S. Dresselhaus, Phys. Rep., 2009, 473, 51–87 Search PubMed.
- A. Eckmann, A. Felten, A. Mishchenko, L. Britnell, R. Krupke, K. S. Novoselov and C. Casiraghi, Nano Lett., 2012, 12, 3925–3930 Search PubMed.
- X. Diez-Betriu, S. Alvarez-Garcia, C. Botas, P. Alvarez, J. Sanchez-Marcos, C. Prieto, R. Menendez and A. de Andres, J. Mater. Chem. C, 2013, 1, 6905–6912 Search PubMed.
- M. A. Pimenta, G. Dresselhaus, M. S. Dresselhaus, L. G. Cançado, A. Jorio and R. Saito, Phys. Chem. Chem. Phys., 2007, 9, 1276–1291 Search PubMed.
- D. S. Lee, C. Riedl, B. Krauss, K. von Klitzing, U. Starke and J. H. Smet, Nano Lett., 2008, 8, 4320–4325 Search PubMed.
- C.-Y. Lin, C.-E. Cheng, S. Wang, H. W. Shiu, L. Y. Chang, C.-H. Chen, T.-W. Lin, C.-S. Chang and F. S.-S. Chien, J. Phys. Chem. C, 2015, 119, 12910–12915 Search PubMed.
- R. Larciprete, P. Lacovig, S. Gardonio, A. Baraldi and S. Lizzit, J. Phys. Chem. C, 2012, 116, 9900–9908 Search PubMed.
- M. P. Briggs and D. Seah, Practical Surface Analysis, J. Wiley & Sons, Chichester, 2nd edn, 1990 Search PubMed.
- V. Palmieri, F. Bugli, M. Cacaci, G. Perini, F. De Maio, G. Delogu, R. Torelli, C. Conti, M. Sanguinetti, M. De Spirito, R. Zanoni and M. Papi, Nanomedicine, 2018, 13, 2867–2879 Search PubMed.
- V. Palmieri, M. Barba, L. Di Pietro, S. Gentilini, M. C. Braidotti, C. Ciancico, F. Bugli, G. Ciasca, R. Larciprete, W. Lattanzi, M. Sanguinetti, M. De Spirito, C. Conti and M. Papi, 2D Mater., 2018, 5, 015027 Search PubMed.
- R. Di Santo, L. Digiacomo, S. Palchetti, V. Palmieri, G. Perini, D. Pozzi, M. Papi and G. Caracciolo, Nanoscale, 2019, 11, 2733–2741 Search PubMed.
- S. Jaworski, E. Sawosz, M. Kutwin, M. Wierzbicki, M. Hinzmann, M. Grodzik, A. Winnicka, L. Lipińska, K. Włodyga and A. Chwalibog, Int. J. Nanomed., 2015, 10, 1585–1596 Search PubMed.
- E. L. K. Chng and M. Pumera, Chem. – Asian J., 2011, 6, 2899–2901 Search PubMed.
Footnote |
| † Electronic supplementary information (ESI) available. See DOI: 10.1039/d0ma00456a |
| This journal is © The Royal Society of Chemistry 2020 |

