 Open Access Article
Creative Commons Attribution 3.0 Unported Licence
Directly linked metalloporphyrins: a quest for bio-inspired materials†
Amrit
Sarmah
 *ab and
Pavel
Hobza
 ab
ab
aInstitute of Organic Chemistry and Biochemistry of the Czech Academy of Sciences, Flemingovo nam. 2, CZ-16610 Prague 6, Czech Republic
bDepartment of Physical Chemistry, Palacký University, CZ-77146 Olomouc, Czech Republic. E-mail: amrit.sarmah@marge.uochb.cas.cz; Tel: +420 731015016
First published on 30th July 2020
Abstract
The directly-linked iron–diporphyrin complexes are appealing candidates and fundamental precursors for an extended metalloporphyrin array that can potentially mimic the biological design of energy-harvesting materials. This encouraged us to appraise the layout for the modular fusion of two iron-porphyrin units. Herein, DFT-based calculations suggest that the electronic environment of diporphyrin systems can be tuned according to the topological attachment between the porphyrin units. Subsequently, a gradual increase in the electronic interaction between the constituent porphyrin units triggers a decrease in the HOMO–LUMO gap. This is essential to achieve higher electric conductivity. The spin-polarized electronic transmission is another interesting aspect of these iron–diporphyrin systems and is promising for spintronic applications. The successive theoretical interpretation of the existence of two-dimensional (2D) metalloporphyrin arrays could be the route to design a graphene analog of the covalent metal–organic framework.
1. Introduction
The overwhelming success in the field of nanoscience has inspired cumulative attempts to mimic the natural photosynthetic system at molecular levels. This new concept has developed the foundation for molecular photonic and electronic devices and incited a quest towards molecular electronics.1–5 A wide range of known molecular pigments are strong contenders for building block elements in molecular devices. Indeed, the versatile optical (absorption and emission), redox, and photochemical behavior of porphyrin and their derivatives manifest great potential as components of nanostructures.6–8 The global scientific community is making great effort to execute rational laboratory protocols for photosynthetic light-harvesting antenna complexes along with exploring their possible applications in molecular conductive wires and optoelectronic devices.9 An efficient low bandgap material is a fundamental requirement of nanoelectronics. Consequently, porphyrin macrocycles are ideal candidates due to the polarisability, optical oscillator strength, and extensive coordination chemistry of the complexes. There is plenty of scope to develop a better understanding of the relationships between the structures of porphyrinoids and their spectroscopic and photophysical properties.10The unparalleled electronic behavior along with their optical linear and non-linear properties, the π-extended porphyrinoid molecules came to prominence and opened up new horizons for technology and medical applications.11–13 In terms of sophisticated technological applications, the π-extended porphyrins are also potential precursors for the fabrication of electron- and energy-transfer devices. Certain important measures that must be tuned for the design and development of these functional porphyrin-based dyes are the nature of the bridges between aromatic components, distance and relative orientation between each chromophore, structural conformation, and the extent of steric interactions.14 It is important to note that in comparison to native porphyrins, π-extended porphyrins display substantial changes in their optical and electrochemical properties. The implications of the covalent linker between essentially coplanar chromophores improve direct conjugation, which induces split Soret and intensively red-shifted Q bands.15
The operational synthetic gateway to sculpt multiporphyrin arrays has been realized with different types of short linkers that are suitable for preparing linear or extended architectures via either meso or β position attachment.16 The fused porphyrin arrays show exciting technological advantages such as rigid and co-planar structures and low HOMO–LUMO gaps. In principle, several different approaches have been adopted to extend porphyrin chromophores without changing the actual number of pyrrole units and methine bridges. The outcome of a practical implementation of this idea is tetrabenzoporphyrin.17–19 The increment in every single benzene unit included in the macrocycle results in a bathochromic shift of about 30 nm. Subsequently, Lash et al. reported a synthetic strategy for the extension of the conjugated aromatic unit in the porphyrin array.20 Along these same lines, an important breakthrough was the preparation of a cross-shaped dye comprising five conjugated porphyrin units reported by Vicente and co-workers.21 In another interesting study, Crossley et al. reported the laboratory synthesis of porphyrin arrays containing one or more pyrazine units.22 Thompson and co-workers, based on their prior experiences on synthetic protocols of fused porphyrins, concluded that meso–meso, β–β, β–β diporphyrin-bearing pyrene moieties are appropriate starting substrates for intramolecular oxidation reactions.23
The feasibility of tetrameric metalloporphyrin sheets has recently been realized,24 indicating the possible existence of 2D infinite metalloporphyrin sheets in experimental conditions. For the first-time, Abel et al. reported the fabrication of a novel two-dimensional (2D) Fe-embedded phthalocyanine (poly-FePc) organometallic porous sheet.25 These newly categorized 2D materials exhibit promising conduction and magnetic properties; however, they are restricted to variable grain boundary conditions. In these 2D systems, the TM (transition metal) atoms are uniformly and separately distributed without clustering and display well-defined geometries and magnetic properties. Subsequently, different TM-Pc monolayers find sophisticated applications in spintronics26–29 and gas capture.30,31 Indeed, due to the unique and regular structural orientation of the TM atoms in the TM-Pc monolayers, these 2D architectures are appealing candidates for single-atom catalysts.32 In this direction, DFT-based theoretical modeling predicted that not-yet-synthesized Co-Pc and Cr-Pc monolayers can be applied as good catalysts for CO oxidation.33,34 However, to date, the electronic properties of the basic building blocks of the 2D metalloporphyrin sheets, i.e., the porphyrin-dimer units, have scarcely been addressed.
In this study, we have extended a systematic investigation to develop a better understanding of the electronic behavior of fused metalloporphyrin moieties based on density functional theory (DFT). In analogy with previous reports, significant modulation in the electronic properties of the hybrid system can be achieved depending on the fusion mode between porphyrin units. Subsequently, we also traced the relative changes in the electronic properties of the systems during the transformation from one-dimensional to two-dimensional arrays, i.e., sheet-like structures. The manuscript is organized in the following way. In Section 2, we address the computational methodologies. The results and discussion in Section 3(a) consist of an analysis of the DFT results for fused porphyrins at the molecular level along with their photophysical behaviors. The essence of electronic transport through the porphyrin dimers in different fusion modes is assayed in Section 3(b). A comprehensive theoretical examination of the electronic behavior of the 2D arrays is featured in Section 3(c). Finally, we summarize the key findings of our theoretical simulation along with some futuristic applications of the model systems in the concluding remarks in Section 4.
2. Theoretical methods
Quantum mechanical (QM) calculations at the molecular level were undertaken using the Gaussian09 software package.35 All structures were optimized with Becke's three-parameter hybrid exchange functional and the Lee–Yang–Parr correlation functional (B3LYP)36,37 without symmetry restriction, employing the correlation-consistent polarized cc-pVTZ basis set38 for all atoms. Additional single-point calculations were performed at the CAM-B3LYP39/cc-pVTZ level to account for the long-range energy correction in the optimized structures. This specific DFT functional effectively coalesces the hybrid qualities of B3LYP and the long-range correction showcased by Tawada et al. Excitation energy calculations were carried out using TDDFT,40–42 as implemented in the Gaussian09 program. TDDFT calculations of the CAM-B3LYP structures were performed utilizing the same basis sets used in the ground-state DFT calculations. The polarizable continuum model (PCM) using the integral equation formalism variant (IEFPCM)43 is the default SCRF method to simulate an H2O solvent environment. The dielectric constant was set as 78.54 for the H2O solvent. All data were obtained using this method unless otherwise mentioned. Multiwfn44 software was employed for the analysis and visualization of various electronic properties of the ground and excited states.The periodic calculations were executed using spin-polarized density functional theory (DFT) under the generalized gradient approximation (GGA)45 in the form envisaged by Perdew, Burke, and Ernzerhof (PBE) as deployed in the Vienna ab initio simulation package (VASP).46 The projected augmented wave (PAW) method47,48 with a plane-wave basis set was used. Subsequently, the spin-polarized calculations were performed under the Vosko–Wilk–Nusair (VWN) modification49 scheme to interpolate the correlation energy. We enforced periodic boundary conditions and a vacuum space of 15 Å along the z-direction in order to avoid interactions between two FeP (iron-porphyrin) images in nearest-neighbor unit cells. All of the structures were relaxed using the conjugate gradient method without any symmetric constraints. To investigate the magnetic coupling between the TM atoms, we considered a 2 × 2 surface unit cell. A 3 × 3 × 1 Monkhorst–Pack50k-point grid centered on the Γ point was used for the calculations. The energy cutoff and convergence criteria for energy and force were set to 400 eV, 1 × 10⁻⁴ eV, and 0.01 eV Å−1, respectively.
3. Results and discussion
(a-i) Electronic structure calculation
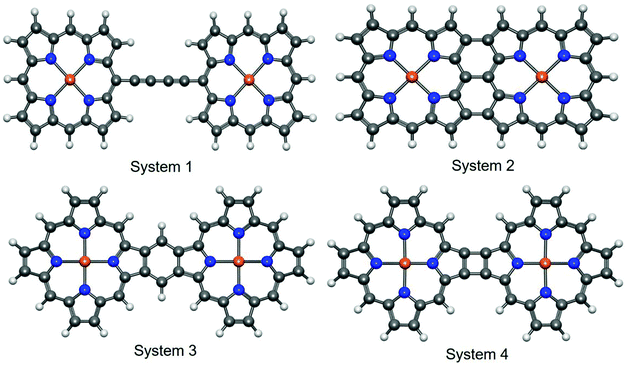
In an excellent review article, Tanaka et al. exclusively discussed the synthetic strategies for obtaining different directly linked porphyrin arrays.51 According to the study, the linked porphyrins are broadly categorized into three types, namely (a) singly-linked porphyrin oligomers, (b) fused porphyrin oligomers, and (c) triply linked porphyrin oligomers. These classifications are primarily based on the different modes of chemical attachment between the porphyrin units. In the present study, we chose four types of porphyrin oligomers with different bonding patterns. Further, the selected iron–porphyrin oligomers have well-defined synthetic protocols, and their promising high-end application prospects have been thoroughly explored (Fig. 1).Here, system 1 consists of a porphyrin dimer linked through a 1,3-butadiyne bridge. Similarly, triply and doubly linked attachment features were explored with system 2 and system 4. Again, a fully conjugated porphyrin dimer was attributed to system 3. The aromatic character of porphyrin, which contains 26 delocalized π electrons, is well established.52 The 1,3-butadiyne bridge between the metalloporphyrin units forms the planar Fe–PP dimeric structure. The planar structural arrangement may increase the possibility that both the porphyrin and butadiyne moieties will contribute to the extended π-electron conjugation over the entire system. Subsequently, the extended π-electron conjugation also improves the electrical conduction performance.53 Higher consistency between experimental findings and calculated values for the planar porphyrin arrays compared to their non-planar analogs is evident from a recent report,54 which encouraged us to concentrate on the planar systems. Similarly, the higher degree of extended π-electron conjugation in the other three fused Fe–PP dimer systems also opens up new avenues to tune and manipulate the characteristic electronic properties of the systems by means of structural orientation. The linked M–PP (M = Cr, Mn, Fe, Zn, Cu) dimer is the simplest building-block for one-dimensional metalloporphyrin nanowires.55 Embedding 3d TM (transition metal) atoms, i.e., Fe, into the porphyrin cores can significantly modulate the electronic properties of the system. The Fe centers are in +2 valence states51 and are coordinated to the nitrogen atoms. The combination of strong coordination interactions and relatively large distances between the two Fe centers (due to the rigid covalent bridging) effectively prevent the aggregation of these atoms. As a result, the Fe atoms can be incorporated separately into the individual porphyrin units, which can endow the Fe–PP dimer with intrinsic magnetic properties; therefore, they are promising probes in the fabrication of nanodevices for spintronics applications.
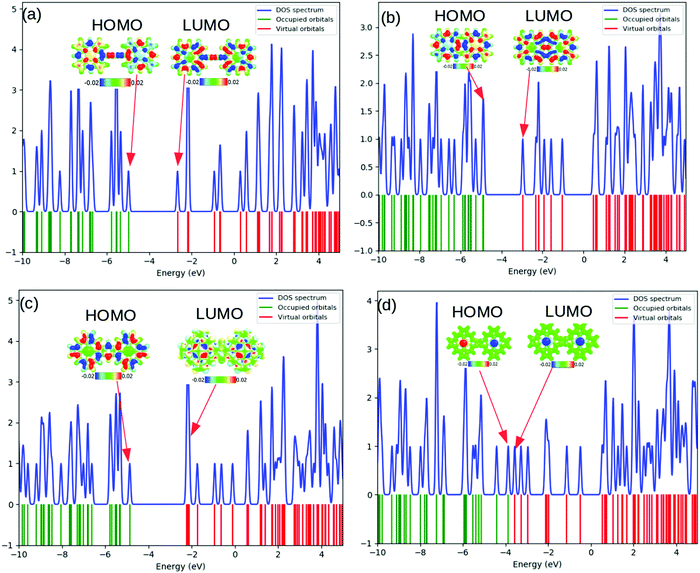
The computed total density-of-states (TDOS) plots along with the location of occupied and virtual orbitals for the four systems are reported in Fig. 2. The green and red lines indicate the occupied and virtual orbitals. The blue line in the plots represents the TDOS of the system.
As can be observed from Fig. 2, the electronic states of the first three systems have close similarities with one another except for small variations near the HOMO level. However, the fourth molecule exhibits significant changes in its electronic states around the HOMO level. A systematic analysis of the plots provides useful insights into the electronic structure. The significant electronic contribution from the p-type atomic orbitals of carbon and nitrogen atoms to the frontier molecular orbitals (FMOs) of the system is evident from the isosurface plots reported in Fig. 2. Subsequently, the corresponding PDOS plots for the model systems are included in the ESI.† The substantial contribution of the iron d-orbitals to the total density of states along with the bonding nature of the MOs constituted from their overlap with the carbon p-orbitals near the HOMO region can be distinguished from the plots. It is important to note that the electronic charge densities on the iron centers at the FMO levels are consistent for all the systems. However, there are some observed deviations from this ideal nature of the metallic centers at the HOMO of the first and the LUMO of the fourth systems. The visual graphics of the corresponding isosurface plots for the frontier molecular orbitals (FMO) (Fig. 3) further confirmed the above observations. Subsequently, we also performed calculations with a higher spin-multiplicity of the systems. The existence of unpaired spins on the central metal atom is clearly evident from the spin-density maps reported in the ESI.†
 | ||
| Fig. 3 Visual graphics of the frontier molecular orbitals (FMO) of the systems. The values in the boxes represent the HOMO–LUMO gaps. | ||
The gradual increase in the electronic interaction between the constituent porphyrin units triggers a decrease in the HOMO–LUMO gap. This is essential to achieve higher electric conductivity. Subsequently, a large number of bridging structures that can enhance the inter-porphyrin conjugation have been intensively exploited.56–58 The 1,3-butadiyne-bridged porphyrin oligomers, i.e., system 1, showed positive cooperative self-assembly (i.e. all-or-nothing assembly) as well as moderate increases in planarity and conjugation, resulting in reduction in the HOMO–LUMO band gaps. A higher degree of conjugation in system 2 facilitated greater electron delocalization, which minimizes the HOMO–LUMO gap. The preferential σ-bonding characteristics in the highest occupied MO levels of systems 1 and 2 are evident from Fig. 2. However, the π-bonding and π-antibonding natures of the HOMO and LUMO orbitals, respectively, in system 3 are associated with an increase in the HOMO–LUMO energy gap. A seemingly different FMO picture is observed for system 4. Here, the HOMO and LUMO are primarily located at the metal centers and are associated with an extremely small electronic bandgap; this indicates the profound metallic nature of the molecule, which correlates well with the DOS plot in Fig. 2.
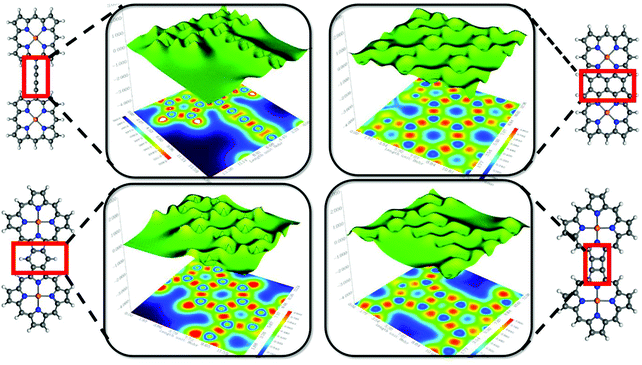
So-called “fused diporphyrin” is an excellent and straightforward synthetic protocol to connect two porphyrin units directly through multiple covalent bonds. Within a coplanar geometrical arrangement, the systems should be quite favorable for electronic π conjugation. As we have seen, diporphyrin is the fundamental unit of an extended 1D metalloporphyrin array. These 1D structures have compelling electronic and magnetic properties and are considered as molecular wires or porphyrin-taps by virtue of their rigid shape and extended electronic conjugation.59 It is now well understood that the extraordinary electronic properties of metalloporphyrin arrays are a consequence of the modular sequence of the diporphyrin units. Therefore, it is important to develop a better understanding of the chemical nature as well as the electronic structure of the ‘linking-zone’ between two single units (Fig. 4).
In the preceding sections, we addressed the findings of different theoretical tools to account for quantitative recognition of the chemical bonding in the diporphyrin systems. It would be useful to obtain some qualitative interpretations of the results in terms of visual graphics. The localized-orbital locator (LOL) is an emergent descriptor of chemical bonding.60 According to the general convention of LOL, the gradients of the localized orbitals are maximized with the increasing extent of overlap in the localized orbitals. Additional theoretical details about LOL are included in the ESI.† Moreover, LOL has a simpler interpretation in terms of fast and slow electron regions. Qualitatively, the high/low LOL values are associated with slow/fast electrons and slow electrons are attributed to the characteristic of localized electrons, such as those in bonds or lone pairs. The light red and yellow regions in the 1,3-butadiene bridge represent two weak covalent C–C π-bonds along with the strong σ-bonding character of the C–C single bond. The bright red spot in the map depicts higher electron localization due to the presence of the C–C single bond. The projection shows spikes around the atomic zone in the 3D surface and distinguishes the blue circles in the 2D map. There are some distinct differences in the nature of chemical bonding for the fused diporphyrin systems. Apparently, the benzofused (system 3) and triple-bridge (system 2) complexes exhibit aromatic ring current due to the fast π-electron cloud at the center of the six-membered ring (the blue region). However, the α–β bridge complex (system 4) does not have this aromatic character, although it has some effective π-conjugations at the four-membered ring. Again, the benzofused and triple-bridge systems show similar bonding characteristics; however, a critical analysis of the bonding pattern on the basis of the LOL map at the fused position reveals certain differences. The regular distributions of blue and red zones for the triple-bridge system are indications of fully conjugated behavior of the π-electrons, and the regular valley-shaped 3D projection also supports this observation. On the other hand, the benzo-fused system has a lower degree of electron delocalization, as evident from the sharp spikes in the 3D projection along with the non-uniform distribution of blue and red zones in the 2D color map. The anti-aromatic character of the meso–meso bridge system was also realized from the LOL map.
(a-ii) Excited state dynamics: a TDDFT analysis
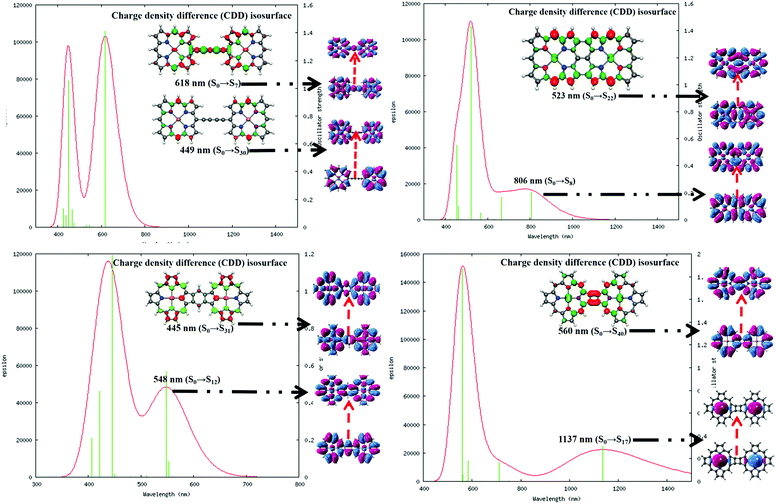
It is important to understand the photophysical behavior of a system to account for its suitable application prospects. The DFT-based simulated UV-VIS absorption spectra of the four complexes in water solvent along with the relevant parameters were executed in graphical form and are included in Fig. 5. The details of the different electronic transitions corresponding to each of the peaks that appear in the absorption spectra are reported in Table 1.| System | Peak maxima (nm) | Oscillator strength | Major orbital contributions |
|---|---|---|---|
| System 1 | 618 (S0 → S7) | 1.41 | HOMO → LUMO (94%) |
| 449 (S0 → S30) | 1.06 | HOMO−1 → LUMO+4 (27%) | |
| System 2 | 806 (S0 → S8) | 0.208 | HOMO−1 → LUMO+1 (83%) |
| 523 (S0 → S22) | 1.43 | HOMO → LUMO (76%) | |
| System 3 | 548 (S0 → S12) | 0.570 | HOMO → LUMO+1 (83%) |
| 445 (S0 → S31) | 1.1927 | HOMO−1 → LUMO (81%) | |
| System 4 | 1137 (S0 → S17) | 0.3081 | HOMO → LUMO (93%) |
| 560 (S0 → S40) | 1.8699 | HOMO−5 → LUMO+2 (60%) | |
It is observed that in the 1,3-butadiene-linked diporphyrin complex (system 1), the low-energy Q-band is a sharper peak compared to those of the other three systems, where the Q-band appears to be a broad peak. The Q-band at λmax = 618 nm for system 1 is mainly the result of a HOMO → LUMO type of electronic transition with a significantly high oscillator strength.60 Similarly, the Q-bands for systems 2 and 4 are largely red-shifted (λmax = 806 and 1137 nm, respectively) due to the increase in delocalized π-electrons and the enlargement of the conjugate surface. However, in the benzo-fused system 3, the Q-band is blue-shifted by 70 nm relative to that of system 1; this is the consequence of a strong interporphyrin interaction mediated by the benzenoid unit.61,62 The substantial Q-band peak broadening in the fused porphyrin complexes is induced by the relative increase in the electronic interaction between the porphyrin units. The characteristic Soret band of the porphyrin is observed at λmax = 449 and 445 nm for systems 1 and 3, respectively, which is associated with their high oscillator strength. However, this particular band appears to be exceedingly red-shifted to λmax = 523 and 560 nm for systems 2 and 4, respectively. The red-shifted absorption bands associated with the fused structures suggest the presence of unusually large electronic interactions between the π orbitals on the two macrocycles. The unobtrusive and efficient intramolecular charge transfer (CT), including the CT from the metal to the ligand, the CT from the ligand to the metal, or the intramolecular CT within ligands is evident from the electron density difference map. A small amount of π–π* of electron transition can be clearly observed, which is the main reason for the large nonlinear optical (NLO) response of organic molecules.
(a-iii) AFM and IETS simulations
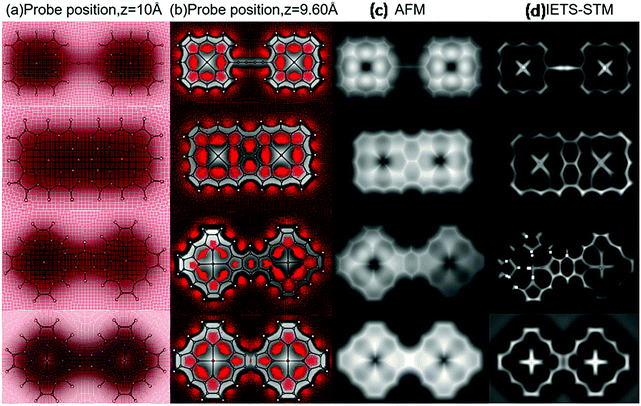
The development of very sophisticated analytical tools such as high-resolution atomic force microscopy (HR-AFM) and inelastic tunnelling microscopy (IETS) provide access to distinctly imaged chemical structures within conjugated molecules. Recently, different techniques have evolved to simulate these analytical images based on the information generated from quantum mechanical calculations.63,64 We simulated the AFM and IETS images with CO probes based on the classical forcefields formalism proposed by Hapala et al.63 According to this model, a probe-particle, which represents a CO molecule, is connected to a tip with a spring and is used to determine the interaction between the tip and sample in AFM measurements. The simulation parameters will be obtained from a specific molecular adsorption geometry of the model system as defined by DFT beforehand. The simulated images are presented in Fig. 6.Initially, the molecule was deposited on a Ag(111) surface, and total energy DFT calculations were performed with the VASP package to obtain the relaxed geometry of the adsorbed molecule. The adsorbed molecule was found to be located around 2.75 Å above the metal surface, and it appears to remain planar. More details about the DFT calculations are included in the ESI.† To the best of the authors’ knowledge, one-to-one correlations between the simulated images and experimental data for all the model systems included in our study are non-viable. However, we explored various experimental reports with similar porphyrin motifs to account for the relevance of our theoretical modeling.
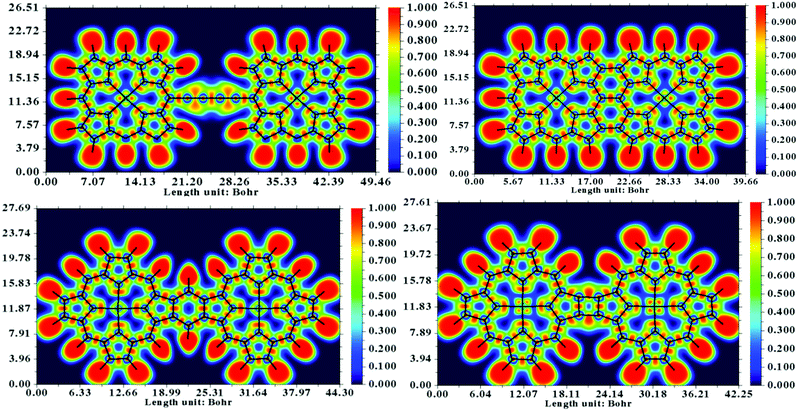
In the reported literature, the 8-hydroxyquinoline tetramer has been extensively investigated from both experimental and theoretical aspects. For this particular system, high-resolution AFM and STM images based on experiments as well as DFT calculations are well documented.65,66 The bond contrast in the AFM images has been qualitatively compared to the bond order, where a higher local electron density leads to stronger Pauli repulsion exerted on the tip. Subsequently, it is conclusive to extend qualitative interpretations to the nature of the existing bonding patterns in the system. It is evident from the study by Zhang et al.66 that the electron localization function (ELF) is directly related to the contrast of a chemical bond appearing in the AFM image. The computed ELF maps of the four systems are depicted in Fig. 7. A significantly localized electron density donation from N to Fe in the ELF of the dimers is evident from the graphics, whereas the electrons between the β–β and meso–meso position bonding are rather delocalized. These characteristics are attributed to the fact that the bonding features in the central regions of the dimer are dative and the fused or linked positions are covalent in nature. On the basis of ELF, it can be argued that the Fe–N bond is significantly polarized and that the shared electrons are preferably localized near the N atom; thus, the AFM contrast is negligible at the metal center.
Inelastic electron tunneling spectroscopy (IETS) has re-emerged as an efficient analytical tool for understanding nanoscale and molecular junctions. Subsequently, the mapping of the intensity of the IETS feature can contribute to the understanding of the spatial distribution of the functional groups. According to our theoretical model, a CO molecule is attached to the tip, and the bonding between two atoms in the porphyrin dimer can be sensed by a particular vibrational mode of the tip CO. When we perform a gradual scanning of the adsorbed molecule with the CO-terminated tip, there should be a significant modulation in the energy and intensity of the hindered translational vibration of CO, which can be traced by inelastic electron tunneling spectroscopy (IETS) with STM.67 A systematic account of the relative variation in low-energy CO vibration can manipulate the potential energy landscape of the molecule and its surroundings. The primary advantage of the IETS-STM technique is the real-space spectroscopy and imaging of the probe. The AFM technique basically detects the local density of states (LDOS), whereas IETS based on STM has proven to be a versatile technique for the real-space imaging of molecular structures and chemical bonding of single molecules on surfaces. Comparison of IETS spectral features between experiments and simulations offers detailed information about chemical conformation, electron–vibration coupling, etc.
The comprehensive discussions of these two sophisticated analytical techniques in terms of computer simulation provide useful insights into the chemical structures of porphyrin dimers.
(b) Electronic transport behavior of the porphyrin dimers
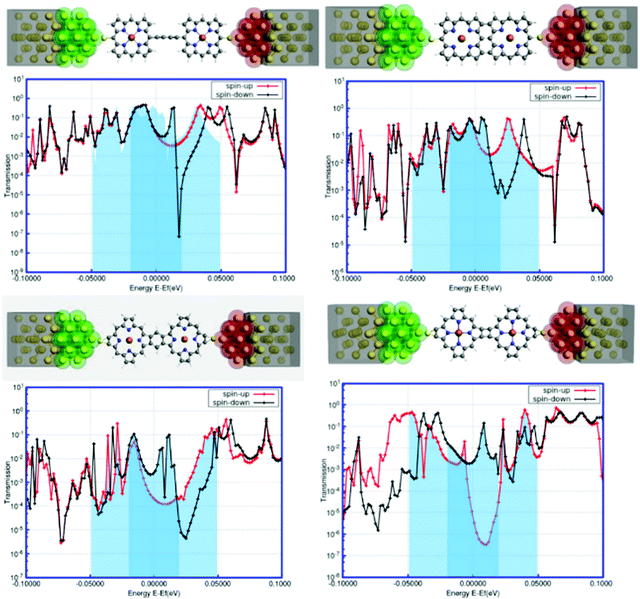
In recent years, the density-functional theory (DFT) and nonequilibrium Green's function (NEGF) formalism has provided an excellent interface for the theoretical modeling of molecular transport properties in connection with the accomplishments of single-molecule nanodevices.68,69 It is encouraging to note that the NEGF + DFT formalism, at the GGA level of theory, shows promising results for transport in the strongly coupled regime69 and through off-resonant transport levels.70,71The transport calculations were performed based on the NEGF + DFT formalism as implemented in the ADF-BAND periodic DFT code.72,73 Comprehensive details about the calculations are available in the ESI.† This is indeed an efficient tool to investigate the electronic transport behavior of a novel single-molecular junction with metallic electrodes. In our present study, we modeled a gold–(porphyrin dimer)–gold (Au–PorD–Au) junction. The contacts were designed with Au(111) faces consisting of 3 × 3 atoms, as represented in Fig. 8. The calculations were performed at the PBE level with an SZ basis on the Au contacts and a TZP basis on the molecule, except where stated otherwise. More theoretical details are available in the ESI.†
The foremost observation from the plots reported in Fig. 8 is that there are substantial variations in the electronic transmission with the changes in the position as well as the orientation of attachment between the two porphyrin units. Another important observation is that the manifestation of spin-polarized electronic transmission, i.e., electronic transmission through the two spin-channels, is different. The extensive research work of Harmann et al. on spin-resolved transport through organometallic complexes revealed important implications of electron transport in nanoscale devices.74 In a molecular bridge, the decrease in conductance due to the appearance of destructive quantum interference (DQI) favors ferromagnetic coupling between two spin centers, while increased conductance through the bridge can favor antiferromagnetic coupling.75 It was observed that in the case of a π-conjugated system, destructive interference could block the electronic transmission, contrary to partial cancellation for the saturated system.76 Similarly, the local transmission through the complexes and their molecular orbitals shows substantial dependencies on the various components of the molecular structure that mediate electron transport.77 It is worth mentioning here that the electronic behavior of a system around the Fermi level determines the versatility of that molecule for nanoscale device fabrication. The present study accounts for a significant modulation of electronic transmission at the two spin states around the Fermi level for all the systems. From Fig. 8, it can be assumed that the origin of spin-dependent electronic transport in the system is due to the spin asymmetry of the electronic structure caused by the presence of paramagnetic metal centers in each porphyrin unit. The findings of spin-polarized calculations in the next segment suggested the presence of spin asymmetry in the model systems. This suggests that the spin-filtering capacity is inherent in the hybrid systems, not in the interface. All systems show the metallic nature of transmission associated with a sharp kink around the Fermi level. The first three systems exhibit an intense peak for the down-spin electrons close to the Fermi zone, whereas the fourth system defines the possibility of a sharp increase in the transmission through the up-spin channel at the Fermi level. The shapes and positions of these transmission peaks signify low-bias electronic conductance for these junctions. The analysis of the NEGF–DFT-based findings in terms of transmission plots uncovers certain important interpretations. Another striking feature is the quantum interference effects in the electronic transport of these systems.78–81 It appears that the electronic transmission through the spin-down channel exhibits significant quantum interference around the Fermi level. The transmission spectra exhibit a smooth regression around the Fermi energy for spin-up (red line in Fig. 8), while for spin-down (black line in Fig. 8), the transmission exhibits a sharp dip near the Fermi energy; this suggests a destructive pattern of quantum interference.82 The interference features are dramatic and in many cases dominate the characteristic transmission spectrum around the Fermi level. Here, the quantum interference patterns are different according to the topological changes in the model systems. It is worth mentioning here that the interference features arise from antiresonances (sharp dips in the transmission). The interference pattern, an antiresonance, is exclusively associated with the down-spin electronic current and affects the system transmission close to the Fermi energy. Antiresonances are simply the opposite of transmission resonances; consequently, the transmission coefficient goes to zero. One condition for the appearance of antiresonances in the transmission is the presence of nonspanning nodes in the wave function. Subsequently, these analyses also indicated some qualitative similarities in the transmission behavior of the four systems at the Fermi level, such as spin-polarized electronic transmission, distinguished broad peaks for the up-spin electrons, and sharp kinks for the down-spin electrons. This information enhances our conceptual understanding of the effects of structural orientation on the electronic transport phenomena. Further, we can argue that the electronic transmission through the junction can be tuned by varying the position as well as the orientation of attachment between the two porphyrin units, which is crucial for strategic development in the fabrication of nanoscale devices based on linked or fused porphyrin dimers.
(c) The electronic structures of the 2D sheets
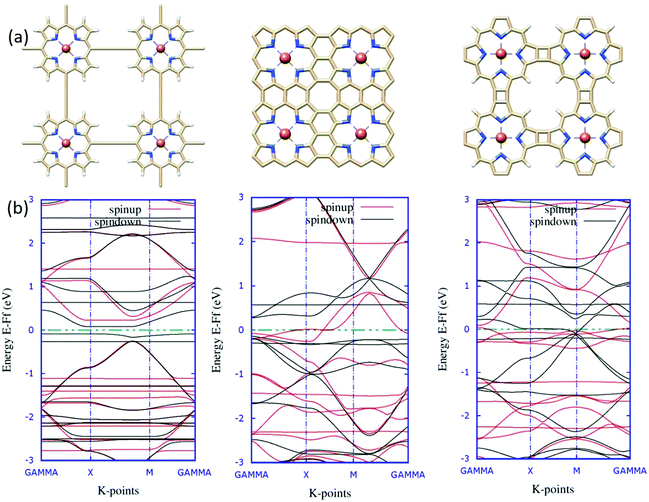
In contemporary research, substantial efforts have been made to successfully synthesize a series of two-dimensional (2D) transition metalorganic materials (MOMs) via metal-directed surface reactions.83,84 As a consequence of their extended systems, these 2D MOMs possess appealing features, such as better stability and conductivity than their molecule counterparts. The experimental realization of tetrameric metalloporphyrin sheets has been achieved recently,85 indicating that 2D infinite metalloporphyrin sheets are experimentally feasible. From the application aspect, these materials are primarily investigated for catalytic purposes, such as the oxygen reduction reaction (ORR), as a substitute for Pt-containing complexes.86 Further, the success in the synthesis of porphyrin oligomers87,88 triggers future attempts of obtaining porphyrin-based molecular nanowires (PNWs) for their extraordinary electro-optical and nonlinear optical properties resulting from the π-conjugation systems.89In light of realistic application, the molecular design should be extended further to periodic models. Previous reports encouraged us to explore the possibilities of viability and the electronic structures of the 2D sheet-like orientation of fused porphyrin-based materials. Taking an analogy from earlier results, intuitively, we designed three novel 2D structures for the porphyrin oligomers. The single unit cell of these three systems is reported in Fig. 9(a). Here, we considered the unit cell to be composed of four porphyrin molecules attached in a different fashion, which should be the minimal unit to account for the relative electronic modulations. The significant differences in the electronic environments of the systems are evident from their corresponding spin-polarized band structures reported in Fig. 9(b). As can be seen from the band diagrams, although four metal centers are present in the unit cell, the systems are slightly magnetic. This is due to the strong anti-ferromagnetic interaction between the metal centers.90 The electronic behaviors of the three systems are entirely different from one another. A critical analysis of the band structure reveals that system 1 is semi-conducting in nature with a specific band-gap. Similarly, system 2 is seemingly half-metallic; one spin-channel is in the metallic region, and the other one is insulating. These characteristic electronic properties of TM-Pc monolayers affirm the promising aspects of the material for spintronics.91 Eventually, system 3 shows typical metallic behavior, with the accumulation of flat bands around the Fermi level. To obtain some better insights into the electronic levels and to trace the contribution of the Fe metal centers, we mapped the total and partial densities of states (TDOS and PDOS) for the systems, and the plots are reported in Fig. 10.
The computed TDOS shows almost symmetric distributions with some distinct deviations around the Fermi level. This correlates well with the lower magnetic moment values of the system. The contribution of electronic states of the metal centers toward the TDOS around the Fermi level (the yellow and purple shades in the plots) leads to the existence of spin-polarity in the systems. Additionally, the introduction of metal centers induced disturbance of the spin states of the p orbitals, and the plot became unsymmetrical. In the case of system 1, the electrons from iron and d and nitrogen p orbitals occupy the spin-down states just below the Fermi level, and no occupied state can be found across the Fermi level; therefore, system 1 is a semiconductor. Subsequently, system 2 shows half-metallic nature, as the p-electrons from nitrogen in the up-spin channel spread across the Fermi level and the iron d-electrons in the down-spin channel located just below the Fermi level create a gap for the down-spin channel. Meanwhile, system 3 exhibits metallic nature, with significant contributions from the iron d-electrons in the up-spin channel in the occupied states, and the down-spin channel is mostly occupied by the p-electrons from nitrogen (Fig. 11).
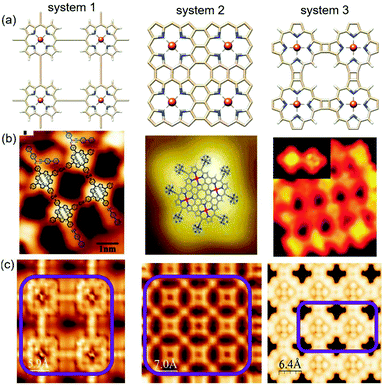 | ||
| Fig. 11 Comparison between experimental and simulated STM images of the three systems generated based on the Tersoff–Hamann method92 within the DFT framework. (a) The relaxed structures of the three different systems, (b) relevant experimental STM images reported in previous studies, and (c) simulated STM maps; the purple box represents the molecular zone that appeared in the graphics. | ||
The most efficient approach to obtaining a direct correlation between theoretical atomistic models and experimental systems is scanning tunneling microscopy (STM). With the rapid progress in modern ab initio methods, it is now possible to accommodate ever-larger structures. Subsequently, the constant improvement of experimental STM leading to higher resolution images (i.e. smaller structures). Due to its simplicity, the Tersoff–Hamann (TH) method has been incorporated into most existing DFT codes. Although the TH method cannot explain the origin of atomic resolution in STM measurements, it often provides a reasonably good qualitative prediction of the experimental observations.93 On the other hand, there are certain complications with the implementation of the NEGF approach for the theoretical analysis of STM.94 The main obstacle is positioning the STM tip at an arbitrary offset with respect to the surface plane. Due to this, together with the fact that tip and sample materials are highly inhomogeneous, it is highly problematic to represent the combined substrate-tip interface within the same supercell.95 Therefore, we are currently in a position to make some sensible comparisons between experimental and calculated STM images based on the Tersoff–Hamann (TH) method. The experimental STM map has many advantages; however, it is blind to the atomic species observed in the STM images. This weak point can be covered up by comparison to the calculated STM images. If the calculated and experimentally observed STM images show close similarities, one can very reasonably assume that the underlying geometry is the same. To account for the relevance of our simulated STM images to the experimental reality, we obtained sophisticated experimental results from some recent reports.
Zhang and co-workers studied the Sonogashira cross-coupling reactions on an Au(111) surface with three different metal-coordination structures and used scanning tunneling microscopy to resolve the products formed at the successive reaction steps.96 The observed STM images of the butadiene bridge Cu–porphyrin oligomers show reasonable agreement with our simulated map. Further, the STM images reported by Nakamura et al.86 and Grill et al.97 in their respective studies manifested excellent correlation with our calculated STM surfaces for similar systems. The comprehensive electronic structure calculations in combination with the extensive analytical simulations strongly suggest the experimental feasibility of linked metalloporphyrin two-dimensional (2D) arrays and are assumed to be the porphyrin analogs of graphene.
4. Conclusions
In the present study, we have systematically analyzed the electronic properties of the smallest building block of a metalloporphyrin-based covalent metal–organic framework. Subsequently, two iron–porphyrin units are linked together in four different patterns and constitute a homologous series of molecular wires or porphyrin taps. The one-dimensional array encompasses tunable electronic coupling between its ends and often provides an interface to the electronic conjugation that extends over a significant part of the molecule. Our theoretical calculations exquisitely crafted a correlation between the type of linker and the porphyrin linkage topology (β or meso) that governs the inter-porphyrin electronic coupling in these arrays and, hence, governs their photophysical properties. Apparently, the present theoretical strategies on diporphyrin linkages are analogous to a “Rubik's Cube”. A single metalloporphyrin unit can be considered as a block of a particular color, and a different-colored block can be fixed between two adjacent metalloporphyrin units by shuffling the cube. This spontaneously triggers a series of changes in the arrangement of the colored patterns within the cube. This is a symbolic representation of the modulations in the electronic properties of the diporphyrin systems due to the different modes of attachment between two metalloporphyrin units. A critical analysis of the electronic modulations revels that the α–β fused diporphyrins are supposed to exert the strongest electronic interactions and the smallest optical HOMO–LUMO gaps (0.31 eV) among the fused diporphyrins studied to date. Similarly, the triply linked diporphyrins have highly symmetric structures and are likely to be free from acute structural distortion. On the other hand, the benzo-fused diporphyrin system exhibits a modest blue shift in the Q-band relative to that of the other systems, which is the consequence of a strong interporphyrin interaction mediated through the benzenoid unit. Additionally, the manifestation of spin-polarized electronic transmission is an appealing aspect of these model systems for future spintronics. Moreover, the higher probability of existence of two-dimensional (2D) metalloporphyrin arrays under experimental conditions could be graphene analogs of covalent metal–organic frameworks. Therefore, the extension of this simulation strategy to the experimental realization of higher oligomeric and polymeric porphyrin arrays is expected to be a fascinating project for next-generation molecular electronics.Conflicts of interest
There are no conflicts to declare.Acknowledgements
This work was supported by research project RVO 61388963 of the Czech Academy of Sciences. We acknowledge the financial support of the Czech Science Foundation (AS, PH: P208/12/G016 and 19-27454X). This work was supported by the Ministry of Education, Youth and Sports from the Large Infrastructures for Research, Experimental Development and Innovations project ‘‘IT4Innovations National Supercomputing Center – LM2015070’’ as well as from project LO1305 (PH).References
- B. M. Hoffman and J. Ibers, Acc. Chem. Res., 1983, 16, 15–21 CAS.
- P. Turek, P. Petit, J. J. Andre, J. Simon, R. Even, B. Boudjema, G. Guillaud and M. J. Maitrot, J. Am. Chem. Soc., 1987, 109, 5119–5122 CrossRef CAS.
- M. A. Ratner and J. Jortner, Molecular Electronics, IUPAC, Blackwell Science, Cambridge, MA, 1997, ch. 1 Search PubMed.
- M. P. Debreczeny, W. A. Svec and M. R. Wasielewski, Science, 1996, 274, 584–587 CrossRef CAS.
- K. Susumu and M. J. Therien, J. Am. Chem. Soc., 2002, 124, 8550–8552 CrossRef CAS PubMed.
- M. R. Wasielewski, in Chlorophylls, ed. H. Scheer, CRC Press, Boca Raton, FL, 1991, p. 269 Search PubMed.
- A. Osuka and K. Maruyama, J. Am. Chem. Soc., 1988, 110, 4454–4456 CrossRef CAS.
- K. M. Kadish, G. Moninot, Y. Hu, D. Dubois, A. Ibnlfassi, J. M. Barbe and R. Guilard, J. Am. Chem. Soc., 1993, 115, 8153–8166 CAS.
- D. Holten, D. F. Bocian and J. S. Lindsey, Acc. Chem. Res., 2002, 35, 57–69 CrossRef CAS PubMed.
- P. F. Schwab, M. D. Levin and J. Michl, Chem. Rev., 1999, 99, 863–1934 Search PubMed.
- T. van der Boom, R. T. Hayes, Y. Zhao, P. J. Bushard, E. A. Weiss and M. R. Wasielewski, J. Am. Chem. Soc., 2002, 124, 9582–9590 CrossRef CAS PubMed.
- R. Takahashi and Y. Kobuke, J. Am. Chem. Soc., 2003, 125, 2372–2373 CrossRef CAS PubMed.
- A. K. Sahoo, S. Mori, H. Shinokubo and A. Osuka, Angew. Chem., Int. Ed., 2006, 45, 7972–7975 CrossRef CAS PubMed.
- M. Nath, M. Pink and J. M. Zaleski, J. Am. Chem. Soc., 2005, 127, 478–479 CrossRef CAS PubMed.
- N. Sprutta, M. Swiderska and L. Latos-Grazynski, J. Am. Chem. Soc., 2005, 127, 13108–13109 CrossRef CAS.
- D. P. Arnold, G. A. Heath and D. A. James, J. Porphyrins phthalocyanines, 1999, 3, 5 CrossRef CAS.
- O. S. Finikova, S. E. Aleshchenkov, R. P. Brin, A. V. Cheprakov, P. J. Carroll and S. A. Vinogradov, J. Org. Chem., 2005, 70, 4617–4628 CrossRef CAS PubMed.
- R. B. M. Koehorst, J. F. Kleibeuker, T. J. Schaafsma, D. A. de Bie, B. Geurtsen, R. N. Henrie and H. C. van der Plas, J. Chem. Soc., Perkin Trans. 2, 1981, 1005–1009 RSC.
- S. Ito, T. Murashima, H. Uno and N. Ono, Chem. Commun., 1998, 661–1662 Search PubMed.
- J. D. Spence and T. D. Lash, J. Org. Chem., 2000, 65, 1530–1539 CrossRef CAS PubMed.
- M. G. H. Vicente, M. T. Cancilla, C. B. Lebrilla and K. M. Smith, Chem. Commun., 1998, 2355–2356 RSC.
- M. J. Crossley, P. L. Burn, S. S. Chew, F. B. Cuttance and I. A. Newson, J. Chem. Soc., Chem. Commun., 1991, 1564–1571 RSC.
- V. V. Diev, K. Hanson, J. D. Zimmerman, S. R. Forrest and M. E. Thompson, Angew. Chem., Int. Ed., 2010, 49, 5523–5526 CrossRef CAS PubMed.
- Y. Nakamura, N. Aratani and H. Shinokubo, et al. , J. Am. Chem. Soc., 2006, 128, 12640–12641 CrossRef PubMed.
- M. Abel, S. Clair, O. Ourdjini, M. Mossoyan and L. Porte, J. Am. Chem. Soc., 2011, 133, 1203–1205 CrossRef CAS PubMed.
- J. Zhou and Q. Sun, J. Am. Chem. Soc., 2011, 133, 1203–1205 CrossRef PubMed.
- J. Zhou, Q. Wang, Q. Sun, Y. Kawazoe and P. Jena, J. Phys. Chem. Lett., 2012, 3, 3109–3114 CrossRef CAS PubMed.
- J. Zhou and Q. Sun, J. Chem. Phys., 2013, 138, 204706 CrossRef PubMed.
- J. Zhou and Q. Sun, Nanoscale, 2014, 6, 328–333 RSC.
- Y. Wang, H. Yuan, Y. Li and Z. Chen, Nanoscale, 2015, 7, 11633–11641 RSC.
- K. Lü, J. Zhou, L. Zhou, X. S. Chen, S. H. Chan and Q. Sun, J. Chem. Phys., 2012, 136, 234703 CrossRef PubMed.
- X. F. Yang, A. Q. Wang, B. T. Qiao, J. Li, J. Y. Liu and T. Zhang, Acc. Chem. Res., 2013, 46, 1740–1748 CrossRef CAS PubMed.
- Q. Deng, L. Zhao, X. Gao, M. Zhang, Y. Luo and Y. Zhao, Small, 2013, 9, 3506–3513 CrossRef CAS PubMed.
- Y. Li and Q. Sun, Sci. Rep., 2013, 4, 4098 CrossRef PubMed.
- M. J. Frisch, et al., Gaussian 09, revision D.01, Gaussian, Inc., Pittsburgh, PA, 2009 Search PubMed.
- A. D. Becke, Phys. Rev. A: At., Mol., Opt. Phys., 1988, 38, 3098–3100 CrossRef CAS PubMed.
- C. Lee, W. Yang and R. G. Parr, Phys. Rev. B: Condens. Matter Mater. Phys., 1988, 37, 785–789 CrossRef CAS PubMed.
- T. H. Dunning, J. Chem. Phys., 1989, 90, 1007–1023 CrossRef CAS.
- T. Yanai, D. P. Tew and N. C. Handy, Chem. Phys. Lett., 2004, 393, 51–57 CrossRef CAS.
- R. Bauernschmitt and R. Ahlrichs, Chem. Phys. Lett., 1996, 256, 454–464 CrossRef CAS.
- M. Casida, C. Jamorski, K. C. Casida and D. R. Salahub, J. Chem. Phys., 1998, 108, 4439–4445 CrossRef CAS.
- R. E. Stratmann, G. E. Scuseria and M. J. Frisch, J. Chem. Phys., 1998, 109, 8218–8226 CrossRef CAS.
- E. Cances, B. Mennucci and J. Tomasi, J. Chem. Phys., 1997, 107, 3032–3041 CrossRef CAS.
- T. Lu and F. W. Chen, J. Comput. Chem., 2012, 33, 580–592 CrossRef CAS PubMed.
- J. P. Perdew, K. Burke and M. Ernzerhof, Phys. Rev. Lett., 1996, 77, 3865–3868 CrossRef CAS PubMed.
- G. Kresse and J. Furthmüller, Phys. Rev. B: Condens. Matter Mater. Phys., 1996, 54, 11169–11186 CrossRef CAS PubMed.
- P. E. Blochl, Phys. Rev. B: Condens. Matter Mater. Phys., 1994, 50, 17953–17979 CrossRef PubMed.
- G. Kresse and D. Joubert, Phys. Rev. B: Condens. Matter Mater. Phys., 1999, 59, 1758–1775 CrossRef CAS.
- S. H. Vosko, L. Wilk and M. Nusair, Can. J. Phys., 1980, 58, 1200–1211 CrossRef CAS.
- H. J. Monkhorst and J. D. Pack, Phys. Rev. B: Condens. Matter Mater. Phys., 1976, 13, 5188–5192 CrossRef.
- T. Tanaka and A. Osuka, Chem. Soc. Rev., 2015, 44, 943–969 RSC.
- J. J. Zheng, Q. Z. Li, J. S. Dang, W. W. Wang and X. Zhao, AIP Adv., 2016, 6, 015216 CrossRef.
- D. H. Yoon, S. B. Lee, K. H. Yoo, J. Kim, J. K. Lim, N. Aratani, A. Tsuda, A. Osuka and D. Kim, J. Am. Chem. Soc., 2003, 125, 11062–11064 CrossRef CAS PubMed.
- G. Sedghi, V. M. Garcia-Suarez, L. J. Esdaile, H. L. Anderson, C. J. Lambert, S. Martin, D. Bethell, S. J. Higgins, M. Elliott, N. Bennett, J. E. Macdonald and R. J. Nichols, Nat. Nanotechnol., 2001, 6, 517–523 CrossRef PubMed.
- D. Kim and A. Osuka, Acc. Chem. Res., 2004, 37, 735–745 CrossRef CAS PubMed.
- R. W. Wagner, T. E. Johnson and J. S. Lindsey, J. Am. Chem. Soc., 1996, 118, 11166–11180 CrossRef CAS.
- R. E. Martin and F. Diederich, Angew. Chem., Int. Ed., 1999, 38, 1350–1377 CrossRef PubMed.
- H. L. Anderson, Chem. Commun., 1999, 2323–2330 RSC.
- M. Gilbert and B. Albinsson, Chem. Soc. Rev., 2015, 44, 845–862 RSC.
- H. L. Schmider and A. D. Becke, THEOCHEM, 2000, 527, 51–61 CrossRef CAS.
- F. Koch, M. Kullmann, U. Selig, P. Nuernberger, D. C. G. Gotz, G. Bringmann and T. Brixner, New J. Phys., 2013, 15, 025006 CrossRef.
- L. Wang, J. Ye, H. Wang, H. Xie and Y. Qiu, Sci. Rep., 2017, 7, 1–11 CrossRef PubMed.
- P. Hapala, G. Kichin, C. Wagner, F. S. Tautz, R. Temirov and P. Jelínek, Phys. Rev. B: Condens. Matter Mater. Phys., 2014, 90, 085421 CrossRef.
- C. S. Guo, M. A. Van Hove, X. Ren and Y. Zhao, J. Phys. Chem. C, 2015, 119, 1483–1488 CrossRef CAS.
- E. P. D. Vanpoucke and G. Brocks, Phys. Rev. B: Condens. Matter Mater. Phys., 2010, 81, 35434 Search PubMed.
- J. Zhang, P. Chen, B. Yuan, W. Ji, Z. Cheng and X. Qiu, Science, 2013, 342, 611–614 CrossRef CAS PubMed.
- B. C. Stipe, M. A. Rezaei and W. Ho, Science, 1998, 280, 1732–1735 CrossRef CAS PubMed.
- N. Agraït, A. L. Yeyati and J. M. van Ruitenbeek, Phys. Rep., 2003, 377, 81–279 CrossRef.
- E. A. Osorio, K. O’Neill, M. Wegewijs, N. Stuhr-Hansen, J. Paaske, T. Bjørnholm and H. S. J. van der Zant, Nano Lett., 2007, 7, 3336–3342 CrossRef CAS PubMed.
- J. L. Mozos, P. Ordejón, M. Brandbyge, J. Taylor and K. Stokbro, Nanotechnology, 2002, 13, 346–351 CrossRef CAS.
- C. Li, I. Pobelov, T. Wandlowski, A. Bagrets, A. Arnold and F. Evers, J. Am. Chem. Soc., 2008, 130, 318–326 CrossRef CAS PubMed.
- G. te Velde, F. Bickelhaupt, S. van Gisbergen, C. Fonseca Guerra, E. Baerends, J. Snijders and T. Ziegler, J. Comput. Chem., 2001, 22, 931–967 CrossRef CAS.
- G. Wiesenekker and E. J. Baerends, J. Phys.: Condens. Matter, 1991, 3, 6721–6742 CrossRef.
- C. Herrmann, J. Phys. Chem. A, 2019, 123, 10205–10223 CrossRef CAS PubMed.
- C. Herrmann and J. Elmisz, Chem. Commun., 2013, 49, 10456–10458 RSC.
- G. C. Solomon, C. Herrmann, T. Hansen, V. Mujica and M. A. Ratner, Nat. Chem., 2010, 2, 223–228 CrossRef CAS PubMed.
- C. Herrmann, G. Solomon and M. A. Ratner, J. Phys. Chem. C, 2010, 114, 20813–20820 CrossRef CAS.
- G. C. Solomon, D. Q. Andrews, R. H. Goldsmith, T. Hansen, M. R. Wasielewski, R. P. V. Duyne and M. A. Ratner, J. Am. Chem. Soc., 2008, 130, 17301–17308 CrossRef CAS PubMed.
- Y. Zheng, T. Lu, C. Zhang and W. Su, Physica E, 2004, 24, 290–296 CrossRef CAS.
- A. Chakrabarti, Phys. Rev. B: Condens. Matter Mater. Phys., 2006, 74, 205315 CrossRef.
- M. L. L. de Guevara and P. A. Orellana, Phys. Rev. B: Condens. Matter Mater. Phys., 2006, 73, 205303 CrossRef.
- T. A. Papadopoulos, I. M. Grace and C. J. Lambert, Phys. Rev. B: Condens. Matter Mater. Phys., 2006, 74, 193306 CrossRef.
- S. Stepanow, A. L. Rizzini and C. Krull, J. Am. Chem. Soc., 2014, 136, 5451–5459 CrossRef CAS PubMed.
- T. Kambe, R. Sakamoto and K. Hoshiko, et al. , J. Am. Chem. Soc., 2013, 135, 2462–2465 CrossRef CAS PubMed.
- Z. Shi, J. Liu and T. Lin, et al. , J. Am. Chem. Soc., 2011, 133, 6150–6153 CrossRef CAS PubMed.
- Y. Nakamura, N. Aratani and H. Shinokubo, et al. , J. Am. Chem. Soc., 2006, 128, 4119–4127 CrossRef CAS PubMed.
- G. Luo, Y. Wang and Y. Li, Sci. Bull., 2017, 6, 1337–1343 CrossRef.
- A. Tsuda and A. Osuka, Science, 2001, 293, 79–82 CrossRef CAS PubMed.
- G. Sedghi, V. M. Garcia-Suarez, L. J. Esdaile, H. L. Anderson, C. J. Lambert, S. Martin, D. Bethell, S. J. Higgins, M. Elliott, N. Bennett, J. E. Macdonald and R. J. Nichols, Nat. Nanotechnol., 2011, 6, 517–523 CrossRef CAS PubMed.
- J. Stanek n and K. Dziedzic-Kocurek, J. Magn. Magn. Mater., 2010, 322, 999–1003 CrossRef.
- J. J. Zheng, Q. Z. Li, J. S. Dang, W. W. Wang and X. Zhao, AIP Adv., 2016, 6, 015216 CrossRef.
- J. Tersoff and D. R. Hamann, Phys. Rev. Lett., 1983, 50, 1998–2001 CrossRef CAS.
- K. S. Thygesen and K. W. Jacobsen, Chem. Phys., 2005, 319, 111 CrossRef CAS.
- T. Frederiksen, M. Brandbyge, N. Lorente and A. P. Jauho, 2004, arXiv:cond-mat/0410700.
- W. A. Hofer, A. S. Foster and A. L. Shluger, Rev. Mod. Phys., 2003, 75, 1287–1331 CrossRef CAS.
- R. Zhang, G. Lyu, D. Y. Li, P. N. Liu and N. Lin, Chem. Commun., 2017, 53, 1730–1734 Search PubMed.
- L. Grill, M. Dyer, L. Lafferentz, M. Persson, M. V. Peters and S. Hecht, Nat. Nanotechnol., 2007, 2, 687–691 CrossRef CAS PubMed.
Footnote |
| † Electronic supplementary information (ESI) available. See DOI: 10.1039/d0ma00461h |
| This journal is © The Royal Society of Chemistry 2020 |

