 Open Access Article
Binary treatment of PEDOT:PSS films with nitric acid and imidazolium-based ionic liquids to improve the thermoelectric properties†
Temesgen Atnafu
Yemata
abc,
Yun
Zheng
a,
Aung Ko Ko
Kyaw
 ad,
Xizu
Wang
a,
Jing
Song
a,
Wee Shong
Chin
 *b and
Jianwei
Xu
 *ab
*ab
aInstitute of Materials Research and Engineering, Agency for Science, Technology and Research (A*STAR), 2 Fusionopolis Way, Singapore 138634, Republic of Singapore. E-mail: jw-xu@imre.a-star.edu.sg
bDepartment of Chemistry, National University of Singapore, 3 Science Drive 3, Singapore 117543, Republic of Singapore. E-mail: chmcws@nus.edu.sg
cChemical Engineering Department, Bahirdar University, Bahirdar P.O. Box 26, Ethiopia
dDepartment of Electrical and Electronic Engineering, Southern University of Science and Technology, Shenzhen 518055, P. R. China
First published on 7th October 2020
Abstract
Poly(3,4-ethylenedioxythiophene):poly(styrenesulfonate) (PEDOT:PSS) is one of most prominent organic conductive polymer-based thermoelectric (TE) materials. Numerous combinations of doping and dedoping processes have been demonstrated to optimize the doping level of PEDOT:PSS films, and subsequently enhance electrical conductivity (σ) and Seebeck coefficient (S) of PEDOT:PSS films. This work established that binary post-treatment with nitric acid and imidazolium-based ionic liquids improved the σ and S. The σ of PEDOT:PSS film was significantly improved from 0.30 to 1260 ± 61 S cm−1 and its corresponding S was simultaneously increased from 16 ± 1.2 to 34.8 ± 1.8 μV K−1, giving rise to a power factor of 152 ± 11.2 μW m−1 K−2 at optimal conditions. The thermal conductivity (κ) concurrently declined from 0.6 to 0.3 W m−1 K−1 for the untreated and treated PEDOT:PSS films, correspondingly, achieving a figure of merit (ZT) value of ∼0.12 at 300 K. The TE performance enhancement of PEDOT:PSS films was largely attributable to the change in the doping level of PEDOT as evidenced by the overall increase in mobility and carrier concentration, and hence resulted in concurrent increase in the σ and S, which were corroborated by different characterization methods. Studies on long-term stability of PEDOT:PSS films at 70 °C and 75% RH for 20 days showed that more than 85% σ and S was retained, showing potential applications for this binary post-treatment method.
1. Introduction
The emerging global need for a variety of efficient energy-harvesting materials has been quickly increasing because of the significant industrialization and gradual depletion of fossil fuels. Recently, TE materials that convert thermal energy into electricity, and vice versa, have been paid a great deal of attention.1,2 TE modules play a vital role in sustainable development as they enable direct conversion between thermal energy and electrical energy by employing holes and electrons as energy transport carriers. Traditional TE materials are predominantly based on inorganic bulk material, for example, PbTe-based compounds3,4 and Bi2Te3-based alloys.5,6 However, they have a few drawbacks such as some toxicity, high-cost, non-flexibility and relatively large thermal conductivity.7 In general, these inorganic materials are mainly applied with rigid bulk forms, making it difficult to be used on curved surfaces. Moreover, PbTe-based materials perform efficiently only at high temperatures and are not appropriate for harvesting low-temperature waste heat. Nevertheless, huge amounts of low-grade waste heat, i.e. the temperature of less than 200 °C,8–10 is generated by various processes. Hence, conductive polymer TE materials with potential to provide high TE conversion efficiency at low temperature have attracted much attention in harvesting vast quantities of low-temperature waste heat.11 This is because conductive polymer TE materials possess intrinsically low κ, big σ, large-area fabrication, easy preparation, affordable cost as well as mass production.12Recently, among the conductive polymer-based TE materials, PEDOT:PSS is in particular attractive due to its excellent thermal stability, good water processability, superior flexibility and high σ. However, a plethora of obstacles for this material have to be solved before extensive TE applications. For example, both the σ and the S of PEDOT:PSS need further enhancement to accomplish good TE performance.13 Several approaches have been reported such as post treatment with ethylene glycol and dimethyl sulfoxide,14 a sequential dipping process using polyethylenimine ethoxylated/ethylene glycol and H2SO4,15 dimethyl sulfoxide-vapor annealing16 and PEDOT:PSS/MoS2 thin film with 4 wt% MoS2 exfoliated in an N,N-dimethylformamide (DMF) solution.17 The magnitude of TE materials’ conversion efficiency is defined as a unitless quantity, the figure of merit (ZT), ZT = S2σT/κ. In many cases, TE performance of a material can be assessed using power factor (PF = S2σ) and it acts as an alternative to ZT when the TE material has a very low k. Both high PF and a low k are necessary to obtain a big ZT value, but the conflicting relationship between the σ and S limits the further improvement of ZT. As a whole, high charge carrier concentration (n) and/or high carrier mobility (μ) enable to achieve a high σ value. However, a high n value tends to decrease the S.18–20 It has been demonstrated that the σ value of PEDOT:PSS films could be greatly enhanced through a variety of post-treatment approaches.8,21–30 These post-treatment approaches increase the amount of n and bipolarons which are the predominant charge carriers, but a large degree of the doping level usually leads to reduction in the S on account of the presence of additional charge carriers.31 Therefore, apposite approaches that are able to improve the S are strongly required. Furthermore, earlier investigation established that the PF could be enhanced by modulating the oxidation level via a chemical post-treatment means,32,33 achieving the optimization of TE properties via the modulation of the n value. For example, Lee et al. studied a multiple-step post-treatment method by employing ultrafiltration and dedoping PEDOT:PSS with hydrazine (NH2NH2), and eventually a maximum PF of 115.5 μW m−1 K−2 was achieved.34 Also, Park's group described that PEDOT:PSS film underwent treatment with a mixture of dimethyl sulfoxide and NH2NH2 to afford a PF of 112 μW m−1 K−2.31 Fan et al. post-treated the PEDOT:PSS films with H2SO4 and NaOH, resulting in an enhanced PF of 334 μW m−1 K−2 at ambient temperature.35 In their recent work, they used ionic liquid to treat PEDOT:PSS films, and obtained an extremely high PF of 754 μW m−1 K−2,36 being much greater than that obtained by Saxena et al. using a same ionic liquid (PF = 170 μW m−1 K−2).37 Recently, we reported a series of work on post-treatment of PEDOT:PSS film using a combination of chemicals including a variety of reagents such as formamide,8 formic acid,38 trifluoroacetic acid,19 trifluoromethanesulfonic acid,24 hydrazine,38 formaldehyde sulfoxylate39 and ionic liquid.40 For example, PEDOT:PSS films were post-treated with formamide and ionic liquids, and it was found that treatment only marginally had effect on the σ but remarkably increased the S, achieving an overall PF up to ∼239.2 μW m−1 K−2.40
In addition to having outstanding TE performance, excellent long-term environmental stability is necessary for PEDOT:PSS film to be applied for useful TE modules,41–45 but limited studies have been reported. In this paper, we reported binary post-treatment with nitric acid (HNO3) and ionic liquid to improve the σ and S values of PEDOT–PSS films as well as its environmental stability. Additionally, we chose one type of ionic liquid 1-butyl-3-methylimidazolium (bmim) with two different anions (trifluoromethanesulfonate (OTf) and tetrafluoroborate (BF4)). Upon binary post-treatment of HNO3 and bmim-OTf in methanol, a highest PF of 152 ± 11.2 μW m−1 K−2 was achieved.
2. Experimental
2.1. Materials
PEDOT![[thin space (1/6-em)]](https://www.rsc.org/images/entities/char_2009.gif) :
:![[thin space (1/6-em)]](https://www.rsc.org/images/entities/char_2009.gif) PSS suspension with a weight ratio of PEDOT to PSS of 1
PSS suspension with a weight ratio of PEDOT to PSS of 1![[thin space (1/6-em)]](https://www.rsc.org/images/entities/char_2009.gif) :
:![[thin space (1/6-em)]](https://www.rsc.org/images/entities/char_2009.gif) 2.5 and the weight concentration of PEDOT:PSS of 1.3% (Clevios PH 1000) was purchased from Heraeus. HNO3 (70%) and ionic liquids ([bmim][OTf]) and [bmim][BF4] were bought from Sigma-Aldrich. Other chemicals and reagents were used as received. Scheme 1 illustrates chemical structures of PEDOT:PSS and ionic liquids.
2.5 and the weight concentration of PEDOT:PSS of 1.3% (Clevios PH 1000) was purchased from Heraeus. HNO3 (70%) and ionic liquids ([bmim][OTf]) and [bmim][BF4] were bought from Sigma-Aldrich. Other chemicals and reagents were used as received. Scheme 1 illustrates chemical structures of PEDOT:PSS and ionic liquids.
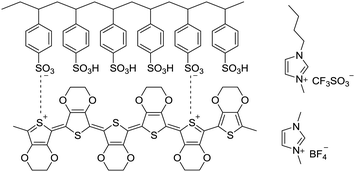 | ||
| Scheme 1 Chemical structures of PEDOT:PSS, 1-ethyl-3-methylimidazolium (bmim) tetrafluoroborate and 1-butyl-3-methylimidazolium trifluoromethanesulfonate. | ||
2.2. Sample preparation
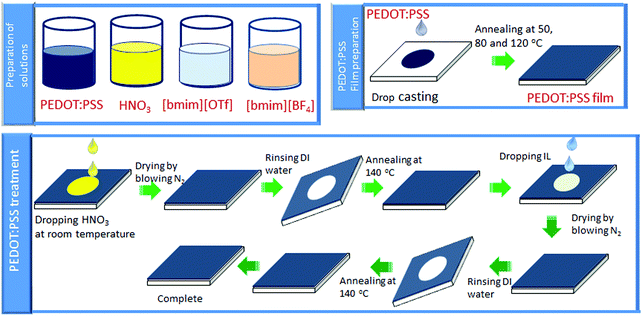
Scheme 2 illustrates the overall procedures of film fabrication and post-treatment of PEDOT:PSS film. The pre-treatment of glass substrates and film preparation of the untreated PEDOT:PSS was conducted according to the reported procedures.29,393. Results and discussion
3.1. Thermoelectric properties
TE properties of pristine and treated PEDOT:PSS films including the σ and S were studied. The untreated PEDOT:PSS film exhibited a small σ value of ∼0.03 ± 0.003 S cm−1 and an S value of ∼17.5 ± 1.6 μV K−1. Post-treatment of PEDOT:PSS film with HNO3 for three times (designated as N-PEDOT:PSS, thereafter) resulted in an significant enhancement in the σ from 0.03 to 3200 ± 89 S cm−1, which approximately matches previously published data,43,48 and the S value is merely marginally reduced from 17.5 ± 1.6 to 16.0 ± 1.2 μV K−1. The N-PEDOT:PSS film was then subject to a similar treatment with ionic liquid to improve the S value. The σ, S, and PF values of the untreated, N-PEDOT:PSS, [bmim][BF4]-N-PEDOT:PSS and [bmim][OTf]-N-PEDOT:PSS films are summarized in Fig. 1 as well as in Table S1 (ESI†). From the Fig. 1, it was found that the PF was increased to 76.0 ± 5.3 μW m−1 K−2 for the N-PEDOT:PSS film, mainly attributable to the remarkably enhanced σ value.46,47 The N-PEDOT:PSS film treated with an ionic liquid [bmim][OTf] or [bmim][BF4] caused the decline in σ value from 3200 ± 89 to 1260 ± 61 and 1188 ± 45 S cm−1, respectively. The S of the N-PEDOT:PSS film was 16 ± 1.2 μV K−1, which was faintly smaller than that of the untreated PEDOT:PSS film. However, the S was greatly increased to 34.8 ± 1.8 and 33.9 ± 1.9 μV K−1 for the N-PEDOT:PSS films treated with [bmim][OTf] and [bmim][BF4], respectively. The N-PEDOT:PSS films dedoped with [bmim][OTf] and [bmim][BF4] exhibited both increase in σ and S in comparison with the untreated PEDOT:PSS film, thus resulting in an enhanced PF. The highest PFs of ∼152 ± 11.2 and 137 ± 12.5 μW m−1 K−2 were obtained from [bmim][OTf]-N-PEDOT:PSS and [bmim][BF4]-N-PEDOT:PSS, respectively. The two PF values obtained from both HNO3 and ionic liquid treatment are comparable favourably to these reported in literatures (Table S2, ESI†).34,49–51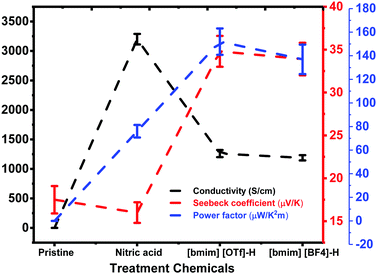 | ||
| Fig. 1 The σ, S and PF of the untreated, N-PEDOT:PSS, [bmim][OTf]-N-PEDOT:PSS and [bmim][BF4]-N-PEDOT:PSS films. | ||
3.2. Characterization of TE properties of PEDOT:PSS films
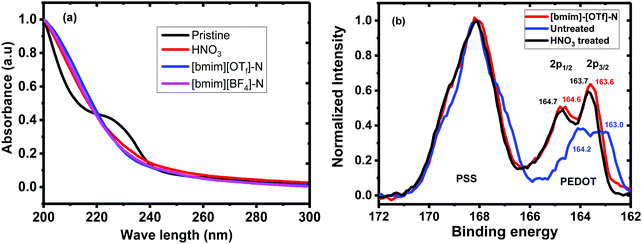
To understand the mechanism of the enhanced thermoelectric properties, the untreated, N-PEDOT:PSS, [bmim][OTf]-N-PEDOT:PSS and [bmim][BF4]-N-PEDOT:PSS films were further characterized by UV-vis-NIR absorption spectroscopy, X-ray photoemission spectroscopy (XPS), Raman spectroscopy, X-ray diffraction (XRD) and atomic force microscopy (AFM).The UV-vis absorption spectra and XPS spectra of the untreated, HNO3 and ionic liquid-treated PEDOT:PSS films were given in Fig. 2. The shoulder absorption peak centred at 225 nm corresponds to the phenyl groups of the PSS (Fig. 2a). The decline in the intensity of this absorption peak of the N-PEDOT:PSS, [bmim][OTf]-N-PEDOT:PSS and [bmim][BF4]-N-PEDOT:PSS films showed the loss of PSS from the films which is in accordance with previous report.47 To further confirm the removal of PSS from the untreated PEDOT:PSS, N-PEDOT:PSS and [bmim][OTf]-N-PEDOT:PSS films, the X-ray photoemission spectra of S2p core levels were characterized (Fig. 2b). The doublet peaks with binding energy in the range of 163 and 167 eV are ascribed to the S 2p signal of the sulphur atoms in PEDOT, whereas the XPS peaks with binding energy from 167 and 170 eV correspond to the S 2p signal of the sulphur atoms in –SO3H of PSS (Fig. S4, ESI†).36,40,52 It was noteworthy that, compared with PSS, the relative intensity of S 2p in PEDOT significantly enlarged because of the loss of PSS in the N-PEDOT:PSS and [bmim][OTf]-N-PEDOT:PSS films.53 Compared with HNO3 treated sample, the S 2p signals of the PEDOT film after dedoping with [bmim][OTf] slightly moved to the lower binding energy correspondingly, signifying the reduction in the doping level after treatment with [bmim][OTf] in conductive polymers unvaryingly causes a reduced σ54 compared to films treated with HNO3. Since the S increases at a lower doping level, the σ has a tendency to decrease, and the PF of PEDOT:PSS film can attain its optimal value at a particular doping level.
UV-vis-NIR absorption spectra of the untreated, N-PEDOT:PSS and N-[bmim][OTf]-PEDOT:PSS films and three intermediate structures that are composed of neutral (PEDOT), polaron (PEDOT+˙) and bipolaron (PEDOT2+), are illustrated in Fig. 3. These three PEDOT intermediate structures correspond to three absorption bands spanning from the visible to the near infrared (NIR) region: PEDOT2+ shows a wide absorption band from the infrared region at about 1200 nm to larger NIR wavelengths. In contrast, PEDOT+˙ exhibits an absorption band centred at near 900 nm and the neutral PEDOT shows an absorption band centred at around 600 nm.55–58 The untreated film appears a wide absorption band starting from the visible region to the infrared region domain (Fig. 3). In contrast, the HNO3-treated PEDOT:PSS film appears a similar spectral profile to the untreated PEDOT:PSS film, but with stronger absorption than that in the untreated film, especially in NIR region, suggesting that the number of charge carriers (polaron and bipolaron) increases upon poste-treatment with HNO3, and polaron and bipolarons are primary charge carriers. This result in fact agrees with the observation showing the increase in the σ and the reduction in the S. After further treatment of N-PEDOT:PSS film with [bmim][OTf], the broad IR absorption appears more pronounced at ∼900 nm associating with very obvious decrease in the absorption band centred at ca. 1200 nm that belongs to the absorption of bipolaron, revealing that PEDOT2+ can be gradually dedoped with post-treatment with [bmim][OTf], and subsequently cause the substantial increase in the S from around 16 to ∼35 μV K−1 (Fig. 1). Actually this observation is consistent with the downshift of the binding energy of S2p in comparison with HNO3-treated PEDOT:PSS film. In general, the binding energy of an atom decreases with increasing electron density about the atom. The less amount of bipolaron (PEDOT2+) in ionic liquid-treated PEDOT:PSS film than in HNO3-treated PEDOT:PSS film means that the electron density of the overall sulphur atom increases after the post-treatment with ionic liquid, and therefore the binding energy of sulphur S 2p is downshifted.
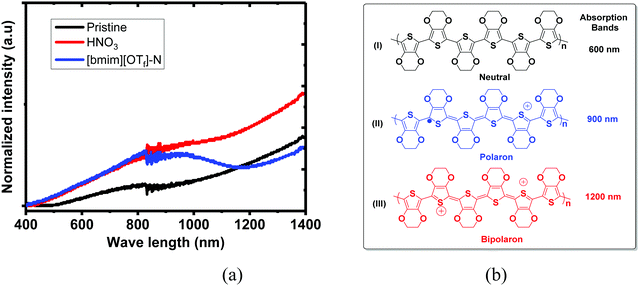 | ||
| Fig. 3 UV-vis-NIR absorption spectra of the untreated, N-PEDOT:PSS and [bmim][OTf]-N-PEDOT:PSS films. Polymer PEDOT state: (I) neutral; (II) polaron and (III) bipolaron. | ||
To further investigate the doping mechanism, Raman spectra of the untreated, N-PEDOT:PSS, [bmim][OTf]-N-PEDOT:PSS and [bmim][BF4]-N-PEDOT:PSS films were examined and are shown in Fig. 4. Three vibrational bands at around 987, 1130 and 1257 cm−1 were observed, which were attributed to the deformation of the OCH2 ring, the PSS part and the symmetric inter-aromatic ring vibrations of Cα–Cα′ stretching, correspondingly.51,58–61 However, the low-intensity bands centred at 1130 cm−1 for HNO3-treated PEDOT:PSS film was weaker than that of untreated PEDOT:PSS film (Fig. S5, ESI†), indicative of the loss of PSS after HNO3 treatment. Results extracted from UV-vis-NIR absorption and XPS spectra reveal that ionic liquid treatment dedopes the PEDOT to increase the polaron concentration, which is consistent with the increase in the S and the drop in the σ.62,63 Moreover, untreated PEDOT:PSS contains both benzoid and quinoid structures. The vibrational signal at 1421 cm−1 is ascribed to the stretching vibration of the C![[double bond, length as m-dash]](https://www.rsc.org/images/entities/char_e001.gif) C double bond of thiophene group of the untreated PEDOT film. These vibrational peaks were moved to approximately 1411 cm−1 for the N-PEDOT:PSS indicating an alteration from a predominate coil alignment of benzoid configuration to a diverse linear-coil conformation of quinoid configuration in the PEDOT chain,59,64 leading to a quinoid dominant conformation. The PSS polymer chains are coupled with the PEDOT chains via attractive coulombic interactions to show core–shell structure thanks to repulsion among long PSS polymer chains.54,65–77 These treatments could deteriorate the ionic interaction between PSS and PEDOT. As a result, the phase separation between the PEDOT and PSS chains as well as the PEDOT chains with a linear conformation will be formed, thus eventually enabling σ to become large with the assistance of the strong chain interactions. The stretching vibration of the C
C double bond of thiophene group of the untreated PEDOT film. These vibrational peaks were moved to approximately 1411 cm−1 for the N-PEDOT:PSS indicating an alteration from a predominate coil alignment of benzoid configuration to a diverse linear-coil conformation of quinoid configuration in the PEDOT chain,59,64 leading to a quinoid dominant conformation. The PSS polymer chains are coupled with the PEDOT chains via attractive coulombic interactions to show core–shell structure thanks to repulsion among long PSS polymer chains.54,65–77 These treatments could deteriorate the ionic interaction between PSS and PEDOT. As a result, the phase separation between the PEDOT and PSS chains as well as the PEDOT chains with a linear conformation will be formed, thus eventually enabling σ to become large with the assistance of the strong chain interactions. The stretching vibration of the C![[double bond, length as m-dash]](https://www.rsc.org/images/entities/char_e001.gif) C double bond of thiophene group in N-PEDOT:PSS at 1411 cm−1 was red-shifted to 1402 cm−1 for [bmim][OTf]-N-PEDOT:PSS film but blue-shifted to 1416 cm−1 for [bmim][BF4]-N-PEDOT:PSS film. Unlike the absorption spectra that give a clear evidence on dedoping of PEDOT by ionic liquids, the Raman spectra provide an inconsistent result, which is similar to a reported example.35 In our case, the exact reason of inconsistency on dedoping between Raman and absorption spectra might be due to the presence of different negative anions associated with [bmim].
C double bond of thiophene group in N-PEDOT:PSS at 1411 cm−1 was red-shifted to 1402 cm−1 for [bmim][OTf]-N-PEDOT:PSS film but blue-shifted to 1416 cm−1 for [bmim][BF4]-N-PEDOT:PSS film. Unlike the absorption spectra that give a clear evidence on dedoping of PEDOT by ionic liquids, the Raman spectra provide an inconsistent result, which is similar to a reported example.35 In our case, the exact reason of inconsistency on dedoping between Raman and absorption spectra might be due to the presence of different negative anions associated with [bmim].
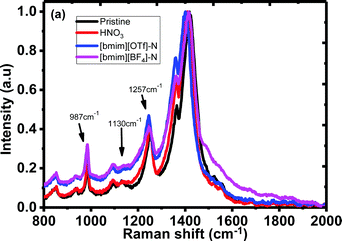 | ||
| Fig. 4 Raman spectra of the untreated, N-PEDOT:PSS, [bmim][OTf]-N-PEDOT:PSS and [bmim][BF4]-N-PEDOT:PSS films. | ||
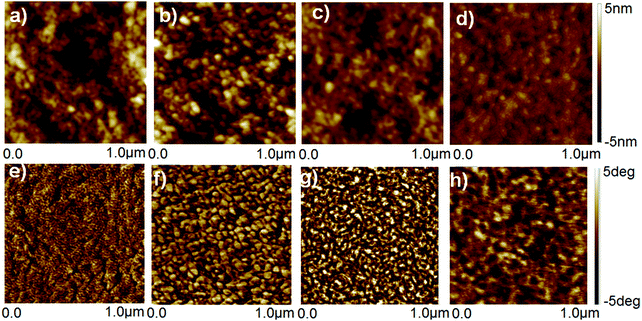
The untreated, HNO3 and ionic liquid treated-PEDOT:PSS films was examined by AFM, and the height and phase AFM images are shown in Fig. 5. The roughness of height images of the untreated and HNO3-treated PEDOT:PSS films was similar to be 1.39 and 1.42 nm, respectively, while the roughness of the height images for the corresponding PEDOT:PSS films was decreased to 0.98 and 0.80 nm after dedoping with [bmim][OTf] and [bmim][BF4], respectively. The N-PEDOT:PSS and ionic liquid-treated N-PEDOT:PSS film surfaces exhibited very non-uniform, probably owing to an increase in the size of the PEDOT aggregates, making charge transport easier and hence increase in the σ value. Similar to previous reports, the phase image of the untreated PEDOT:PSS film does not exhibit any apparent grains (Fig. 5), indicating that the PEDOT polymer chains are well inter-entangled with the PSS polymer chains and the film is mainly sheltered by the PSS-rich domains. The phase images of the N-PEDOT:PSS and ionic liquid-treated N-PEDOT:PSS were observed to be interconnected with large aggregates, inferring that the interconnection of the PEDOT-rich aggregates were originated from the significant phase separation between the PSS-rich shells and the PEDOT-rich cores.67–69 Fig. S6 (ESI†) presents the scanning electron microscope images of top-view and cross-section SEM images of the untreated, N-PEDOT:PSS, and ionic liquid treated N-PEDOT:PSS films. Contrary to the flat and smooth surface of the untreated PEDOT:PSS, it could be found that the cross-section SEM images of the ionic liquid-treated films demonstrated a layer-by-layer structure, which is in good agreement with the enhanced σ.33,69
In an organic p-type semiconductor, the σ value can be calculated according to the formula: σ = enμ, where e, and μ stand for the electronic charge and carrier mobility, respectively. In terms of the formula, it is clearly shown that the σ value is proportional to both the n and μ.63 The n and μ values of the untreated, N-PEDOT:PSS, [bmim][OTf]-N-PEDOT:PSS and [bmim][BF4]-N-PEDOT:PSS films were measured, and are given in Table 1. It was found that the σ of the ionic liquid-dedoped N-PEDOT:PSS films decreased by roughly 60% relative to that of the N-PEDOT:PSS film. The computed σ of the untreated and treated-PEDOT:PSS films acquired from the product of the two-competing physical quantities μ and n is the approximately same as the magnitude determined by the well-known four-point probe method (Table 1). As seen from Table 1, the largely reduced σ of ionic liquid-dedoped PEDOT:PSS film was principally due to almost an order of magnitude reduction in the n. This perhaps stems from the interaction between the ionic liquid and the PSS components, hence suppressing the function of PSS as a carrier supplier of PEDOT. Post-treatment with ionic liquids with two different anions does not lead to the significant difference for the σ, μ and n values, suggesting that the anions associated with the imidazolium cation play litter role in modulating the TE parameters, which in fact agrees well with the measured PF values (vide supra). Contrary to the big gap among the n values with a difference of more four thousand times, the μ showed relatively less variation between 0.42–1.04 (cm2 V−1 s−1) with a difference of 2.5 times only for all samples.
| Post-treatment conditions | |||||||||||||||||||||||||||||||||||||||||||||||||||||||||||||||||||||||||||||||||||||||||||||||||||
|---|---|---|---|---|---|---|---|---|---|---|---|---|---|---|---|---|---|---|---|---|---|---|---|---|---|---|---|---|---|---|---|---|---|---|---|---|---|---|---|---|---|---|---|---|---|---|---|---|---|---|---|---|---|---|---|---|---|---|---|---|---|---|---|---|---|---|---|---|---|---|---|---|---|---|---|---|---|---|---|---|---|---|---|---|---|---|---|---|---|---|---|---|---|---|---|---|---|---|---|
| Code | HNO3 | Ionic liquid | μ (cm2 V−1 s−1) | n (cm−3) | σ (S cm−1) | σ (S cm−1) | |||||||||||||||||||||||||||||||||||||||||||||||||||||||||||||||||||||||||||||||||||||||||||||
| a Calculated values in terms of σ = enμ. b Obtained from the 4-point probe method. | |||||||||||||||||||||||||||||||||||||||||||||||||||||||||||||||||||||||||||||||||||||||||||||||||||
| Untreated | No | No | 0.42 ± 0.03 | 4.1 ± 0.32 × 10¹⁸ | 0.3 ± 0.1 | 0.29 ± 0.11 | |||||||||||||||||||||||||||||||||||||||||||||||||||||||||||||||||||||||||||||||||||||||||||||
| N-PEDOT:PSS | Yes | No | 1.04 ± 0.10 | 1.67 ± 0.15 × 10²² | 2778 ± 196 | 3200 ± 89 | |||||||||||||||||||||||||||||||||||||||||||||||||||||||||||||||||||||||||||||||||||||||||||||
| [bmim][OTf]-N-PEDOT:PSS | Yes | Yes | 0.65 ± 0.05 | 1.12 ± 0.13 × 10²¹ | 1164 ± 112 | 1260 ± 61 | |||||||||||||||||||||||||||||||||||||||||||||||||||||||||||||||||||||||||||||||||||||||||||||
| [bmim][BF4]-N-PEDOT:PSS | Yes | Yes | 0.56 ± 0.03 | 1.21 ± 0.31 × 10²¹ | 1084 ± 103 | 1188 ± 45 | |||||||||||||||||||||||||||||||||||||||||||||||||||||||||||||||||||||||||||||||||||||||||||||
XRD analysis was performed to examine the crystallinity of the PEDOT:PSS films (Fig. 6). For the untreated film, the patterns display two very weak characteristic signals at 2θ = 6.5° and 25.9° which are assigned to the lattice d spacing of 13.0 and 3.4 Å calculated based on Bragg's law, 2d![[thin space (1/6-em)]](https://www.rsc.org/images/entities/char_2009.gif) sin
sin![[thin space (1/6-em)]](https://www.rsc.org/images/entities/char_2009.gif) θ = λ. The d spacing of 13.0 Å (2θ ∼ 6.5°) corresponds to the lamella stacking distance d(100) of the two distinct alternate ordering of PEDOT and PSS polymer chains. The d spacing of 3.4 Å spotted at 2θ = 25.9° corresponds to the inter-chain planar ring-stacking distance d(010) of PEDOT chains.39,70 The N-PEDOT:PSS film shows an enormous change in intensity of d(100) associating with obvious appearance of the second order diffraction of d(100) at 2θ = 13.0°, while a slight change in the lamella stacking distance of the two distinct alternate alignments of the PEDOT and PSS chain from 13.0 to 13.4 Å was observed, and the π–π stacking distance also was marginally increased from 3.4 to 3.5 Å (Fig. 6). Upon HNO3 treatment, the increase in π–π stacking distance indicates the transformation of the PEDOT chains from benzoid configuration to quinoid configuration, which results in the formation of a more planar structure. Moreover, the intensity of the diffraction peak d(100) significantly increased after treatment with HNO3. A similar observation was also observed in H2SO4-treated PEDOT:PSS, suggesting that PEDOT:PSS favours a particular lamella stacking between the two distinct alternate orderings of PEDOT and PSS.71 The remarkable enhancement in its crystallinity was also supported by the AFM images, being in good agreement with the reported results.46,47,71,72 By comparison, for the [bmim][OTf]-N-PEDOT:PSS and [bmim][BF4]-N-PEDOT:PSS films, both diffractions of d(100) at the low angle are slightly shifted to ∼6.6°, corresponding to the lattice d spacing of 13.2 Å, and a fairly reduction in diffraction signal intensity is found, causing the reduction in crystallinity which is likely relevant to the decrease of the σ after treatment with ionic liquids. The d(100) diffraction peak intensity increased significantly, which was attributed to the increase in the number of ordered aggregates with interchain π–π stacking between the PEDOT chains, as well as the increase in the crystallinity of the PEDOT:PSS film. Moreover, the addition of an ionic liquid selectively enhanced the π–π coupling of the PEDOT:PSS chains, resulting in the improvement of crystallinity (i.e. reduction of disorder) and enhancing the charge carrier mobility.73,74 Consequently, the N-PEDOT:PSS, [bmim][OTf]-N-PEDOT:PSS and/or [bmim][BF4]-N-PEDOT:PSS films exhibit improved interchain coupling of PEDOT:PSS chains with more densely packed PEDOT and lamella stacking between two types of assemblies, leading to enhanced S of the PEDOT:PSS films through interface scattering.71,73,74 Interface scattering includes surface scattering and grain boundary scattering. The interface scattering mechanism of charge carriers transport in PEDOT:PSS film plays a role in the Seebeck coefficient and conductivity of PEDOT:PSS film. The post-treatment promotes the crystallinity of PEDOT and removes PSS at the same time, resulting in changes in the grain boundaries and grain size of PEDOT, and hence enhancing TE properties.
θ = λ. The d spacing of 13.0 Å (2θ ∼ 6.5°) corresponds to the lamella stacking distance d(100) of the two distinct alternate ordering of PEDOT and PSS polymer chains. The d spacing of 3.4 Å spotted at 2θ = 25.9° corresponds to the inter-chain planar ring-stacking distance d(010) of PEDOT chains.39,70 The N-PEDOT:PSS film shows an enormous change in intensity of d(100) associating with obvious appearance of the second order diffraction of d(100) at 2θ = 13.0°, while a slight change in the lamella stacking distance of the two distinct alternate alignments of the PEDOT and PSS chain from 13.0 to 13.4 Å was observed, and the π–π stacking distance also was marginally increased from 3.4 to 3.5 Å (Fig. 6). Upon HNO3 treatment, the increase in π–π stacking distance indicates the transformation of the PEDOT chains from benzoid configuration to quinoid configuration, which results in the formation of a more planar structure. Moreover, the intensity of the diffraction peak d(100) significantly increased after treatment with HNO3. A similar observation was also observed in H2SO4-treated PEDOT:PSS, suggesting that PEDOT:PSS favours a particular lamella stacking between the two distinct alternate orderings of PEDOT and PSS.71 The remarkable enhancement in its crystallinity was also supported by the AFM images, being in good agreement with the reported results.46,47,71,72 By comparison, for the [bmim][OTf]-N-PEDOT:PSS and [bmim][BF4]-N-PEDOT:PSS films, both diffractions of d(100) at the low angle are slightly shifted to ∼6.6°, corresponding to the lattice d spacing of 13.2 Å, and a fairly reduction in diffraction signal intensity is found, causing the reduction in crystallinity which is likely relevant to the decrease of the σ after treatment with ionic liquids. The d(100) diffraction peak intensity increased significantly, which was attributed to the increase in the number of ordered aggregates with interchain π–π stacking between the PEDOT chains, as well as the increase in the crystallinity of the PEDOT:PSS film. Moreover, the addition of an ionic liquid selectively enhanced the π–π coupling of the PEDOT:PSS chains, resulting in the improvement of crystallinity (i.e. reduction of disorder) and enhancing the charge carrier mobility.73,74 Consequently, the N-PEDOT:PSS, [bmim][OTf]-N-PEDOT:PSS and/or [bmim][BF4]-N-PEDOT:PSS films exhibit improved interchain coupling of PEDOT:PSS chains with more densely packed PEDOT and lamella stacking between two types of assemblies, leading to enhanced S of the PEDOT:PSS films through interface scattering.71,73,74 Interface scattering includes surface scattering and grain boundary scattering. The interface scattering mechanism of charge carriers transport in PEDOT:PSS film plays a role in the Seebeck coefficient and conductivity of PEDOT:PSS film. The post-treatment promotes the crystallinity of PEDOT and removes PSS at the same time, resulting in changes in the grain boundaries and grain size of PEDOT, and hence enhancing TE properties.
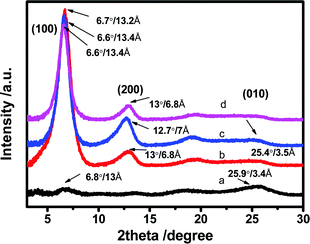 | ||
| Fig. 6 X-ray diffraction (XRD) patterns of (a) untreated (b) HNO3 treated, (c) [bmim][OTf]-N treated, and (d) [bmim][BF4]-N treated PEDOT:PSS films. | ||
Table 2 presents density (ρ) and thermal properties including thermal effusivity (e), specific heat capacity (Cp) and cross-plane thermal conductivity (κ⊥) of the untreated and [bmim][OTf]-N-PEDOT:PSS films. The cross-plane thermal conductivity (κ⊥) is given by the equation κ = e2/ρCp where the e is the thermal effusivity, which is measured by pulsed light heating thermoreflectance method at ambient temperature.21 This means renders the e value of the film by determining the alternation in reflectance with pulsed light heating. Details of this method are elaborated in our earlier reports.29 Fig. S7 (ESI†) displays the thermal reflectance signals of the untreated and [bmim][OTf]-N-PEDOT:PSS films. The thermal reflectance signals were monitored by the probe beam after the nanosecond-pulse heating. The untreated PEDOT:PSS film shows a quicker signal decay than the treated PEDOT:PSS film. This fast signal decay in the untreated film indicates that the cooling rate through the [bmim][OTf]-N-PEDOT:PSS film is slower than that through the untreated film and hence results in a faster thermal diffusion in the untreated PEDOT:PSS film. The effusivity values obtained from the curve fitting are summarized in Table 2. The κ⊥ of [bmim][OTf]-N-PEDOT:PSS (∼0.30 W m−1 K−1) was dropped in comparison with the κ⊥ of the untreated PEDOT:PSS film (∼0.60 W m−1 K−1) due to the selective loss of PSS, which is collectively confirmed by the UV-vis-NIR absorption, XPS and Raman spectra. The earlier investigation demonstrated that taking away the PSS from the PEDOT:PSS improved the σ, and only faintly lessened the κ as well as decreased the ρ, but no close relationship between the κ and σ was found.34,76 The thermal anisotropy factor is equal to κ‖/κ⊥ where κ‖ and κ⊥ stand for in-plane and cross-plane κ, respectively. The κ‖/κ⊥ value was found to be roughly ranging from 1.40 ± 0.2257 to 3.57,66 Therefore, the calculated κ‖ ranged from 0.84 to 1.8 W m−1 K−1 and from 0.42 to 0.9 W m−1 K−1 for the untreated and [bmim][OTf]-N-PEDOT:PSS films, respectively. Therefore, by utilizing the calculated κ‖ of 0.42–0.9 W m−1 K−1, the ZT value at 300 K is estimated to be between from ∼0.12 to ∼0.05 for [bmim][OTf]-N-PEDOT:PSS film. While the ZT value of untreated PEDOT:PSS film ranges from ∼3.6 × 10⁻⁶ to ∼1.7 × 10⁻⁶ at 300 K based on the estimated κ‖ of 0.84–1.8 W m−1 K−1 and PF of 0.01 μW m−1 K−2, confirming the effectiveness of our post-treatment method in improving the TE properties of PEDOT:PSS film.
| Code | e (J s−0.5 m−2 K−1) | C p (J g−1 K−1) | ρ (g cm−3) | κ ⊥ (W m−1 K−1) | |||||||||||||||||||||||||||||||||||||||||||||||||||||||||||||||||||||||||||||||||||||||||||||||
|---|---|---|---|---|---|---|---|---|---|---|---|---|---|---|---|---|---|---|---|---|---|---|---|---|---|---|---|---|---|---|---|---|---|---|---|---|---|---|---|---|---|---|---|---|---|---|---|---|---|---|---|---|---|---|---|---|---|---|---|---|---|---|---|---|---|---|---|---|---|---|---|---|---|---|---|---|---|---|---|---|---|---|---|---|---|---|---|---|---|---|---|---|---|---|---|---|---|---|---|
| Untreateda | 1196 | 1.50 | 1.60 | 0.60 | |||||||||||||||||||||||||||||||||||||||||||||||||||||||||||||||||||||||||||||||||||||||||||||||
| [bmim][OTf]-N-PEDOT:PSSa | 856 | 1.40 | 1.59 | 0.30 | |||||||||||||||||||||||||||||||||||||||||||||||||||||||||||||||||||||||||||||||||||||||||||||||
3.3. Stability study of PEDOT:PSS films
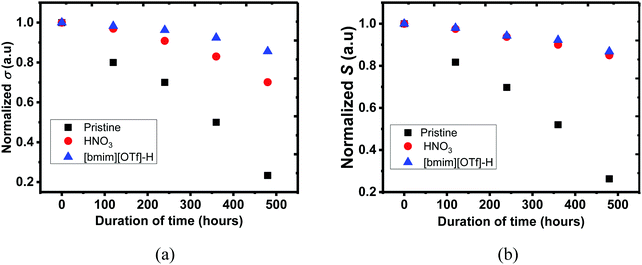
Environmental stability of PEDOT:PSS films were investigated, and the untreated, N-PEDOT:PSS and [bmim][OTf]-N-PEDOT:PSS films were exposed to air at 70 °C and a humidity of 75% RH for 480 hours (20 days), and then the σ, S and κ values were regularly recorded throughout 20 days. As illustrated in Fig. 7, the σ and S of all PEDOT:PSS films progressively reduced with the increase in exposure time. After the PEDOT:PSS film was exposed to air at 70 °C and 75% RH for 20 days, the σ of the untreated, N-PEDOT:PSS and [bmim][OTf]-N-PEDOT:PSS was reduced to 85, 70, and 30% of the original data, correspondingly, apparently implying that HNO3 treated PEDOT:PSS film has much better σ stability than the untreated, and further treatment with [bmim][OTf] additionally improves its σ stability and 85% of the original σ is retained. Likewise, great improvement in S was observed in HNO3 treated sample in comparison with the untreated sample, but the further treatment with ionic liquid did not lead to a notable change in the S (Fig. 7b). It is noteworthy that, compared to the untreated PEDOT:PSS, remarkable improvement in both the σ and S of PEDOT:PSS film is primarily due to the great reduction of hygroscopic and strong acidic PSSH absorbing H2O easily.77,78 A less amount of the PSS in the treated PEDOT:PSS film leads to less H2O uptake and then the film becomes more intact even in wet conditions.68 Moreover, as demonstrated by XRD, the treated samples exhibited a much higher crystallinity than the untreated sample, hence enhancing the overall stability as reflected by the small reduction in the σ and S.37 On the other hand, strong electrostatic attraction between the negatively charged sulfonate anions and the positively charged bulky imidazolium cations may block the diffusion of H2O molecules from the film surface into the interior and consequently reduces the H2O uptake, partially contributing to the stability enhancement. In addition, neutralization happening between imidazolium derivatives with acidic PEDOT:PSS suspension additionally contributes to improvement in stability with a reasonable decline of the σ, which is consistent with reported result.44 It was also observed that weathering treatment also has an slight effect on the thermal properties (Table 2). Negligible change in κ⊥ of the untreated PEDOT:PSS was observed, but led to around 13% increase after HNO3 and ionic liquid treatment. The environmental stability of both N-PEDOT:PSS and [bmim][OTf]-N-PEDOT:PSS films is better or comparable to that of these reported in literatures (Table S3, ESI†).38–40,45,734. Conclusions
In this paper, we demonstrated post-treatments with HNO3 treatment considerably improved the σ of the untreated PEDOT:PSS film from 0.03 to more than 3000 S cm−1, however resulting in a slight drop in the S. Further dedoping HNO3 treated film with ionic liquids increased S by more than double from 16 ± 1.2 to 34.8 ± 1.8 μV K−1via adjusting the oxidation level of the PEDOT films. Binary treatment with HNO3 and ionic liquid substantially improved the σ and S values, leading to a PF value of 152 ± 11.2 μW m−1 K−2 at optimal conditions. The κ was decreased from ∼0.6 to 0.3 W m−1 K−1 for the untreated and the treated film, respectively. Therefore, the ZT of ∼0.12 was obtained at 300 K. The long-term environmental stability study at 70 °C and 75% RH for 20 days demonstrated that the PEDOT:PSS films treated with nitric acid and ionic liquid were stable and more than 85% of its σ and S were retained, showing potential in real applications such as thin-film TE generators.Conflicts of interest
The authors declare no conflict of interest.Acknowledgements
We are grateful to support from the A*STAR, Industry Alignment Funding, (Grant No. 1527200019, 1527200020 & 1527200021). Yemata would like to specially thank the SINGA scholarship from the A*STAR Graduate Academy. Kyaw would like to acknowledge the support from Shenzhen Science, Technology and Innovation Commission (No. JCYJ20180305180645221) and High-level University Fund (G02236004).References
- S. B. Riffat and X. Ma, Appl. Therm. Eng., 2003, 23, 913–935 CrossRef.
- L. E. Bell, Science, 2008, 321, 1457–1461 CrossRef CAS.
- Y. Pei, X. Shi, A. LaLonde, H. Wang, L. Chen and G. J. Snyder, Nature, 2011, 473, 66 CrossRef CAS.
- K. Biswas, J. He, I. D. Blum, C.-I. Wu, T. P. Hogan, D. N. Seidman, V. P. Dravid and M. G. Kanatzidis, Nature, 2012, 489, 414 CrossRef CAS.
- Y. Zheng, Q. Zhang, X. Su, H. Xie, S. Shu, T. Chen, G. Tan, Y. Yan, X. Tang and C. Uher, Adv. Energy Mater., 2015, 5, 1401391 CrossRef.
- B. Poudel, Q. Hao, Y. Ma, Y. Lan, A. Minnich, B. Yu, X. Yan, D. Wang, A. Muto and D. Vashaee, Science, 2008, 320, 634–638 CrossRef CAS.
- M. O’Neill and S. M. Kelly, Adv. Mater., 2011, 23, 566–584 CrossRef.
- Q. Wei, M. Mukaida, K. Kirihara, Y. Naitoh and T. Ishida, Materials, 2015, 8, 732–750 CrossRef CAS.
- N. Toshima and S. Ichikawa, J. Electron. Mater., 2015, 44, 384–390 CrossRef CAS.
- D. Yoo, J. Kim, S. H. Lee, W. Cho, H. H. Choi, F. S. Kim and J. H. Kim, J. Mater. Chem. A, 2015, 3, 6526–6533 RSC.
- N. Dubey and M. Leclerc, J. Polym. Sci., Part B: Polym. Phys., 2011, 49, 467–475 CrossRef CAS.
- Y. Du, S. Z. Shen, K. Cai and P. S. Casey, Prog. Polym. Sci., 2012, 37, 820–841 CrossRef CAS.
- N.-R. Shin, S.-H. Choi and J.-Y. Kim, Synth. Met., 2014, 192, 23–28 CrossRef CAS.
- J. Liu, Y. Jia, Q. Jiang, F. Jiang, C. Li, X. Wang, P. Liu, P. Liu, F. Hu, Y. Du and J. Xu, ACS Appl. Mater. Interfaces, 2018, 10, 44033–44040 CrossRef CAS.
- X. Li, C. Liu, W. Zhou, X. Duan, Y. Du, J. Xu, C. Li, J. Liu, Y. Jia, P. Liu, Q. Jiang, C. Luo, C. Liu and F. Jiang, ACS Appl. Mater. Interfaces, 2019, 11, 8138–8147 CrossRef CAS.
- X. Wang, P. Liu, Q. Jiang, W. Zhou, J. Xu, J. Liu, Y. Jia, X. Duan, Y. Liu, Y. Du and F. Jiang, ACS Appl. Mater. Interfaces, 2018, 11, 2408–2417 CrossRef.
- F. Jiang, J. Xiong, W. Zhou, C. Liu, L. Wang, F. Zhao, H. Liu and J. Xu, J. Mater. Chem. A, 2016, 4, 5265–5273 RSC.
- Q. Jiang, Q. Liu, H. Song, H. Shi, Y. Yao, J. Xu, G. Zhang and B. Lu, J. Mater. Sci.: Mater. Electron., 2013, 24, 4240–4246 CrossRef CAS.
- J. Kim, J. G. Jang, J.-I. Hong, S. H. Kim and J. Kwak, J. Mater. Sci.: Mater. Electron., 2016, 27, 6122–6127 CrossRef CAS.
- L. M. Cowen, J. Atoyo, M. Carnie, D. Baran and B. C. R. Schroeder, ECS J. Solid State Sci. Technol., 2017, 6, N3080–N3088 CrossRef CAS.
- A. K. K. Kyaw, G. D. H. Wong, T. A. Yemata and J. Xu, Org. Electron., 2019, 69, 7–12 CrossRef CAS.
- Q. Zhu, E. Yildirim, X. Wang, X. Y. D. S. Soo, Y. Zheng, T. L. Tan, G. Wu, S.-W. Yang and J. Xu, Front. Chem., 2019, 7, 783 CrossRef CAS.
- T. A. Yemata, A. K. K. Kyaw, Y. Zheng, X. Wang, Q. Zhu, W. S. Chin and J. Xu, Polym. Int., 2020, 69, 84–92 CrossRef CAS.
- X. Wang, A. K. K. Kyaw, C. Yin, F. Wang, Q. Zhu, T. Tang, P. I. Yee and J. Xu, RSC Adv., 2018, 8, 18334–18340 RSC.
- Y. Zheng, H. Zeng, Q. Zhu and J. Xu, J. Mater. Chem. C, 2018, 6, 8858–8873 RSC.
- T. Park, C. Park, B. Kim, H. Shin and E. Kim, Energy Environ. Sci., 2013, 6, 788–792 RSC.
- E. Yildirim, G. Wu, X. Yong, T. L. Tan, Q. Zhu, J. Xu, J. Ouyang, J.-S. Wang and S.-W. Yang, J. Mater. Chem. C, 2018, 6, 5122–5131 RSC.
- Y. Xia and J. Ouyang, ACS Appl. Mater. Interfaces, 2012, 4, 4131–4140 CrossRef CAS.
- A. K. K. Kyaw, T. A. Yemata, X. Wang, S. L. Lim, W. S. Chin, K. Hippalgaonkar and J. Xu, Macromol. Mater. Eng., 2018, 303, 1700429 CrossRef.
- T. A. Yemata, Q. Ye, H. Zhou, A. K. Kyaw, W. S. Chin and J. Xu, Hybrid Polymer Composite Materials, Elsevier, 2017, pp. 169–195 Search PubMed.
- H. Park, S. H. Lee, F. S. Kim, H. H. Choi, I. W. Cheong and J. H. Kim, J. Mater. Chem. A, 2014, 2, 6532–6539 RSC.
- O. Bubnova, M. Berggren and X. Crispin, J. Am. Chem. Soc., 2012, 134, 16456–16459 CrossRef CAS.
- T.-C. Tsai, H.-C. Chang, C.-H. Chen and W.-T. Whang, Org. Electron., 2011, 12, 2159–2164 CrossRef CAS.
- S. H. Lee, H. Park, W. Son, H. H. Choi and J. H. Kim, J. Mater. Chem. A, 2014, 2, 13380–13387 RSC.
- Z. Fan, P. Li, D. Du and J. Ouyang, Adv. Energy Mater., 2017, 7, 1602116 CrossRef.
- Z. Fan, D. Du, X. Guan and J. Ouyang, Nano Energy, 2018, 51, 481–488 CrossRef CAS.
- N. Saxena, B. Pretzl, X. Lamprecht, L. Bießmann, D. Yang, N. Li, C. Bilko, S. Bernstorff and P. Muller-Buschbaum, ACS Appl. Mater. Interfaces, 2019, 11, 8060–8071 CrossRef CAS.
- T. A. Yemata, Y. Zheng, A. K. K. Kyaw, X. Wang, J. Song, W. S. Chin and J. Xu, RSC Adv., 2020, 10, 1786–1792 RSC.
- T. A. Yemata, Y. Zheng, A. K. K. Kyaw, X. Wang, J. Song, W. S. Chin and J. Xu, Org. Electron., 2020, 81, 105682 CrossRef CAS.
- T. A. Yemata, Y. Zheng, A. K. K. Kyaw, X. Wang, J. Song, W. S. Chin and J. Xu, Front. Chem., 2020, 7, 870 CrossRef.
- Y. H. Kim, C. Sachse, M. L. Machala, C. May, L. Müller-Meskamp and K. Leo, Adv. Funct. Mater., 2011, 21, 1076–1081 CrossRef CAS.
- A. M. Nardes, M. Kemerink, M. De Kok, E. Vinken, K. Maturova and R. Janssen, Org. Electron., 2008, 9, 727–734 CrossRef CAS.
- J. E. McCarthy, C. A. Hanley, L. J. Brennan, V. G. Lambertini and Y. K. Gun'ko, J. Mater. Chem. C, 2014, 2, 764–770 RSC.
- A. Cho, S. Kim, S. Kim, W. Cho, C. Park, F. S. Kim and J. H. Kim, J. Polym. Sci., Part B: Polym. Phys., 2016, 54, 1530–1536 CrossRef CAS.
- D. Alemu, H.-Y. Wei, K.-C. Ho and C.-W. Chu, Energy Environ. Sci., 2012, 5, 9662–9671 RSC.
- C. Yeon, S. J. Yun, J. Kim and J. W. Lim, Adv. Electron. Mater., 2015, 1, 1500121 CrossRef.
- M. T. Z. Myint, M. Hada, H. Inoue, T. Marui, T. Nishikawa, Y. Nishina, S. Ichimura, M. Umeno, A. K. K. Kyaw and Y. Hayashi, RSC Adv., 2018, 8, 36563–36570 RSC.
- D. A. Mengistie, M. A. Ibrahem, P. C. Wang and C. W. Chu, ACS Appl. Mater. Interfaces, 2014, 6, 2292–2299 CrossRef CAS.
- S. H. Lee, H. Park, S. Kim, W. Son, I. W. Cheong and J. H. Kim, J. Mater. Chem. A, 2014, 2, 7288–7294 RSC.
- C. Yi, A. Wilhite, L. Zhang, R. Hu, S. S. C. Chuang, J. Zheng and X. Gong, ACS Appl. Mater. Interfaces, 2015, 7, 8984–8989 CrossRef CAS.
- J. Wang, K. Cai and S. Shen, Org. Electron., 2015, 17, 151–158 CrossRef CAS.
- X. Crispin, S. Marciniak, W. Osikowicz, G. Zotti, A. van der Gon, F. Louwet, M. Fahlman, L. Groenendaal, F. De Schryver and W. R. Salaneck, J. Polym. Sci., Part B: Polym. Phys., 2003, 41, 2561–2583 CrossRef CAS.
- Y. J. Xia and J. Y. Ouyang, Macromolecules, 2009, 42, 4141–4147 CrossRef CAS.
- M. Khan, S. Armes, C. Perruchot, H. Ouamara, M. Chehimi, S. Greaves and J. Watts, Langmuir, 2000, 16, 4171–4179 CrossRef CAS.
- T.-C. Chung, J. Kaufman, A. Heeger and F. Wudl, Phys. Rev. B: Condens. Matter Mater. Phys., 1984, 30, 702 CrossRef CAS.
- S. Garreau, J. Duvail and G. Louarn, Synth. Met., 2001, 125, 325–329 CrossRef.
- S. G. Im and K. K. Gleason, Macromolecules, 2007, 40, 6552–6556 CrossRef CAS.
- O. Bubnova, Z. U. Khan, A. Malti, S. Braun, M. Fahlman, M. Berggren and X. Crispin, Nat. Mater., 2011, 10, 429 CrossRef CAS.
- S. Garreau, G. Louarn, J. P. Buisson, G. Froyer and S. Lefrant, Macromolecules, 1999, 32, 6807–6812 CrossRef CAS.
- A. A. Farah, S. A. Rutledge, A. Schaarschmidt, R. Lai, J. P. Freedman and A. S. Helmy, J. Appl. Phys., 2012, 112, 113709 CrossRef.
- Y. K. Han, M. Y. Chang, W. Y. Huang, H. Y. Pan, K. S. Ho, T. H. Hsieh and S. Y. Pan, J. Electrochem. Soc., 2011, 158, K88–K93 CrossRef CAS.
- J. Luo, D. Billep, T. Waechtler, T. Otto, M. Toader, O. Gordan, E. Sheremet, J. Martin, M. Hietschold, D. R. T. Zahn and T. Gessner, J. Mater. Chem. A, 2013, 1, 7576–7583 RSC.
- M. Łapkowski and A. Proń, Synth. Met., 2000, 110, 79–83 CrossRef.
- U. Lang, E. Müller, N. Naujoks and J. Dual, Adv. Funct. Mater., 2009, 19, 1215–1220 CrossRef CAS.
- J. Ouyang, Q. Xu, C.-W. Chu, Y. Yang, G. Li and J. Shinar, Polymer, 2004, 45, 8443–8450 CrossRef CAS.
- S.-I. Na, G. Wang, S.-S. Kim, T.-W. Kim, S.-H. Oh, B.-K. Yu, T. Lee and D.-Y. Kim, J. Mater. Chem., 2009, 19, 9045–9053 RSC.
- J. Luo, D. Billep, T. Blaudeck, E. Sheremet, R. D. Rodriguez, D. R. Zahn, M. Toader, M. Hietschold, T. Otto and T. Gessner, J. Appl. Phys., 2014, 115, 054908 CrossRef.
- J. Luo, D. Billep, T. Waechtler, T. Otto, M. Toader, O. Gordan, E. Sheremet, J. Martin, M. Hietschold and D. R. Zahn, J. Mater. Chem. A, 2013, 1, 7576–7583 RSC.
- Z. Li, H. Sun, C. L. Hsiao, Y. Yao, Y. Xiao, M. Shahi, Y. Jin, A. Cruce, X. Liu, Y. Jiang, W. Meng, F. Qin, T. Ederth, S. Fabiano, W. M. Chen, X. Lu, J. Birch, J. W. Brill, Y. Zhou, X. Crspin and F. Zhang, Adv. Electron. Mater., 2018, 4, 1700496 CrossRef.
- Z. Liu and N. Wang, J. Mater. Chem. C, 2018, 6, 9734 RSC.
- N. Kim, S. Kee, S. H. Lee, B. H. Lee, Y. H. Kahng, Y. R. Jo, B. J. Kim and K. Lee, Adv. Mater., 2014, 26, 2268–2272 CrossRef CAS.
- S. Xu, M. Hong, X.-L. Shi, Y. Wang, L. Ge, Y. Bai, L. Wang, M. Dargusch, J. Zou and Z.-G. Chen, Chem. Mater., 2019, 31, 5238–5244 CrossRef CAS.
- N. Kim, B. H. Lee, D. Choi, G. Kim, H. Kim, J. R. Kim, J. Lee, Y. H. Kahng and K. Lee, Phys. Rev. Lett., 2012, 109, 106405 CrossRef.
- J. Zhou, E. Q. Li, R. Li, X. Xu, I. A. Ventura, A. Moussawi, D. H. Anjum, M. N. Hedhili, D.-M. Smilgies, G. Lubineau and S. Thoroddsen, J. Mater. Chem. C, 2015, 3, 2528–2538 RSC.
- T. Baba, N. Taketoshi and T. Yagi, Jpn. J. Appl. Phys., 2011, 50, 11RA01 CrossRef.
- G.-H. Kim, L. Shao, K. Zhang and K. P. Pipe, Nat. Mater., 2013, 12, 719 CrossRef CAS.
- M. De Jong, L. Van Ijzendoorn and M. De Voigt, Appl. Phys. Lett., 2000, 77, 2255–2257 CrossRef CAS.
- K. Fehse, R. Meerheim, K. Walzer, K. Leo, W. Lövenich and A. Elschner, Appl. Phys. Lett., 2008, 93, 312 CrossRef.
Footnote |
| † Electronic supplementary information (ESI) available. See DOI: 10.1039/d0ma00522c |
| This journal is © The Royal Society of Chemistry 2020 |

