 Open Access Article
Self-assembled albumin decorated MoS2 aggregates and photo-stimuli induced geometrical switching for enhanced theranostics applications†
Lakshmi
Narashimhan Ramana
,
Rajeev J.
Mudakavi
 and
Ashok M.
Raichur
 *
*
Department of Materials Engineering, Indian Institute of Science, Bangalore, 560012, India. E-mail: amr@iisc.ac.in; Tel: +91-80-2293 3238
First published on 14th October 2020
Abstract
2D materials such as graphene oxide and molybdenum sulfide exhibit certain properties such as photoluminescence, photothermal and photodynamic effects that have potential in diagnosing and treating cancer. However, their application is limited by low cellular uptake of the sheet-like structure. In this study, we present a facile route for converting MoS2 sheets into cotton-candy like aggregates which are then internalized easily by cells and then disassembled into sheets. Initially MoS2 sheets are produced from bulk MoS2 by albumin assisted exfoliation followed by assembly of sheets into aggregates by a desolvation technique. The MoS2 cotton-candy like aggregates can be taken up by cells more easily when compared to sheets because of low colloidal stability. Using a near infrared laser, the aggregates can be disintegrated into sheets within the cells. Two processes take place in this step. First, the photothermal properties of MoS2 aggregates can be used to kill cancerous cells. Secondly, on disintegration, the photoluminescence properties of MoS2 sheets can be utilized to image cancer cells. The cytotoxicity, phototoxicity and apoptosis of HeLa cells are reported here. A facile method for increasing the uptake of 2D materials into cells has been demonstrated.
1. Introduction
Cancer is one of the deadliest diseases affecting the human population today. Treatment of cancer involves surgery, chemotherapy, radiation therapy, and phototherapy depending on the type of cancer.1 Although chemotherapy is widely used, it has many drawbacks including severe side effects, non-specific uptake of drugs by normal cells and inducing drug resistance in cancerous cells due to the high dosage of the drug used.2 In the case of radiation and photo-therapy, normal cells are adversely affected during exposure to radiation and light thus causing the death of normal cells.3,4Some of the drawbacks mentioned above are being addressed through the use of nano-carriers which can be designed to specifically target cancer cells and deliver the drug inside the cell. This can substantially reduce side effects while improving the efficacy of treatment and patient compliance.5–9 Nanomaterials such as iron oxide, quantum dots, carbon nanotubes, palladium sheets, WOx, WS2, MoS2, and graphene oxide are potential materials for photothermal therapy and diagnostics.10,11 In recent years, quantum dots of graphene, WS2, MoS2 with a size of 2–10 nm have been studied as photothermal agents.12 Although quantum dots are easily internalized by cells, they are also eliminated from the cells within a few hours thus decreasing the efficacy of treatment.13 Furthermore, quantum dots can cause phototoxicity at higher concentrations due to their extremely small size.
Most photothermal agents are either spherical or rod-shaped and are hence internalized easily by cells.14 In recent years, 2-D materials have received considerable attention for application in sensors, drug delivery and photothermal therapy.15 2-D materials have a high surface-to-volume ratio resulting in superior interaction with electromagnetic radiation leading to higher temperatures and thus higher phototoxicity. Cellular uptake of 2-D materials is determined by the cell type, lateral dimension of the particles, temperature, and incubation time and it is also an energy dependent process.16 Moreover, smaller sheets enter the cells via clathrin-mediated endocytosis whereas larger particles are taken up by both clathrin-mediated endocytosis and phagocytosis.17 The mechanism of endocytosis of 2D sheets was demonstrated by computational methods involving self-rotation of the sheets followed by membrane wrapping.18 The endocytosis of nanoparticles proceeds with the binding of proteins to the particles and the particles then come closer to the cells for the interaction to occur. In the case of the two-dimensional sheets, the stability of the sheets is high with a low sedimentation rate in the presence of culture medium proteins resulting in increased time for interaction of sheets with the cells for initiating endocytosis.19,20
In a recent study, it was reported that the internalization dynamics differed depending on the size of MoS2 sheets.21 6 nm size sheets were internalized faster than 90 nm size sheets; however, the smaller size sheets were also quickly cleared from the cell. The role of the size of 2-D sheets in cellular uptake and subsequent endocytosis is still unclear.22
The lower uptake of 2-D sheets can be overcome by temporarily converting the 2-D sheets into an irregular cotton-candy like assembly. In this study, we have chosen an oxidized form of MoS2 as a photothermal agent since it is known to be cleared rapidly from the system as compared to other chalcogenides.23 We have exfoliated MoS2 by sonication in the presence of bovine serum albumin and then assembled the exfoliated sheets into cotton-candy like aggregates by the desolvation method. The cellular uptake of both 2D MoS2 sheets and aggregates using HeLa cells has been studied and reported here.
2. Experimental section
2.1 Materials
MoS2, bovine serum albumin, propidium iodide, MTT reagent (3-(4,5-dimethylthiazol-2-yl)-2,5-diphenyl tetrazolium bromide), Dulbecco's modified Eagle's medium (DMEM), fetal calf serum, and ethanol were purchased from Sigma Aldrich (Bangalore, India). Millipore water was used throughout the study (18.1 MΩ cm).2.2 Albumin assisted exfoliation of MoS2 sheets
The as-received MoS2 sheets were exfoliated in a bath sonicator by the liquid phase exfoliation method.24 100 mg of MoS2 was added to 10 ml of aqueous solution containing 5 mg of bovine serum albumin. The suspension was then sonicated for 72 h to obtain single exfoliated sheets. The suspension was then centrifuged at 8925 g for 0.5 h to separate the unexfoliated sheets. The supernatant was further passed through a 200 nm filter membrane to obtain a narrow size distribution of sheets. The filtered sample was then freeze-dried to obtain albumin exfoliated MoS2.2.3 Preparation of self-assembled cotton-candy like MoS2 aggregates
Self-assembly of albumin coated MoS2 sheets was performed by the desolvation method.25 Initially, freeze-dried albumin coated MoS2 sheets were dispersed in water by sonication for 0.5 h. About 50 mg of exfoliated MoS2 in 5 ml of water was transformed into cotton-candy like aggregates by continuous addition of 5 ml of ethanol as a desolvating agent under constant stirring. The sample was centrifuged at 12![[thin space (1/6-em)]](https://www.rsc.org/images/entities/char_2009.gif) 750g and aggregates were washed 5 times with water to remove excess ethanol. The aggregates were then sonicated for ten minutes and then freeze-dried for further studies. The mechanism of formation of MoS2 aggregates is elucidated in Table SM1 (ESI†).
750g and aggregates were washed 5 times with water to remove excess ethanol. The aggregates were then sonicated for ten minutes and then freeze-dried for further studies. The mechanism of formation of MoS2 aggregates is elucidated in Table SM1 (ESI†).
2.4 Characterization of MoS2 aggregates
Three types of MoS2 namely native MoS2 sheets, MoS2 aggregates and NIR laser treated MoS2 aggregates were used in this study. For the sake of convenience, all three samples will be referred as MoS2 samples in the text. MoS2 samples were visualized using high-resolution transmission electron microscopy (FEI Tecnai F30, The Netherlands). The height of MoS2 samples was measured using an atomic force microscope (Nanosurf AG, Switzerland). The uptake of MoS2 samples into cells was studied using a confocal laser scanning microscope (LSM 710, Carl Zeiss, Thornwood, USA). The Raman shift of the MoS2 samples was recorded using a LabRAM HR spectrometer (Horiba, Japan). Photoluminescence of MoS2 samples was analyzed using an LS-55 luminescence spectrometer (PerkinElmer, USA). The UV spectra of MoS2 samples were recorded using a Nanodrop ND-1000 UV-Vis spectrophotometer (Thermo Scientific, USA). Photothermal experiments were carried out using a near infra-red laser (NIR 808 nm, 500 mW) and the temperature was measured using a home-made experimental setup. The colloidal stability of the MoS2 samples in aqueous medium and 10% fetal calf serum was measured in terms of zeta potential and hydrodynamic size at a time point of 4 hours26 (Table SM2, ESI†). The interconversion of the sheet to particles and vice versa was measured in terms of fluorescence intensity, as shown in Table SM4 (ESI†).2.5 In vitro studies
Cervical cancer cells (HeLa cells, ATCC cell line, USA), cultured in DMEM with 10% fetal calf serum and 1% antibiotic streptomycin at 37 °C under 5% CO2, were used in this study. For cell uptake studies, 5 × 10⁵ cells were first seeded on covers slips in a 24 well plate. The cells were further incubated with the MoS2 samples (50 μg ml−1) dispersed in phosphate buffered saline for 4 h in the presence of the culture medium. The cells were then washed with phosphate buffered saline to remove any excess MoS2 samples. The cells treated with MoS2 sheets and aggregates were then irradiated with a near infra-red laser for 3, 4 and 10 minutes. In the case of the cells incubated with a laser for 10 min, the coverslips were further incubated for 24 hours. The cells were fixed with 4% paraformaldehyde and imaged using a confocal microscope.To determine the phototoxicity of MoS2 sheets and aggregates, 1 × 10⁴ cells were first seeded in a 96 well plate and incubated with different amounts of MoS2 samples for 4 h. The cells were then washed with phosphate buffered saline and irradiated with near infra-red light for 5 min. Cytotoxicity studies were carried out using the standard MTT assay after 24 h. In another set of experiments, the cells incubated with MoS2 samples but not treated with the near infra-red laser were used as a control.27,28 Based on the phototoxicity results, the mechanism of cell death after treatment with MoS2 aggregates was evaluated using the annexin V/PI double staining kit (BD Biosciences, USA) by flow cytometry (FACSVerse, BD Biosciences, USA). Flow cytometry data are represented using two-dimensional dot plots in which PI is represented on the vertical axis and annexin V (FITC) on the horizontal axis. The plots can be divided in four regions corresponding to: (1) Q1 V−/P+: necrotic; (2) Q2 V+/P+: late apoptotic cells (3) Q3 V−/P−: healthy cells; and (4) Q4 V+/P−: early apoptotic cells. HeLa cells at a density of 2 × 10⁵ were seeded in a 12-well plate and allowed to incubate overnight. After incubation, MoS2 aggregates at a concentration of 50 μg ml−1 were added to the well plate and further incubated for 4 h. The cells were then washed thoroughly to remove free MoS2 aggregates and exposed to a NIR laser for 10 minutes. The cells were further incubated for 24 hours.29 The cells were isolated from the well-plate and incubated with 5 μl FITC annexin V and PI in ice for 15 minutes according to the staining protocol and data analyzed using BD FACSuite software.
2.6 Statistical aanalyses
Each experiment was performed in triplicate and data are expressed as mean ± S.E.M. The observations from MTT assay and flow cytometry were analyzed statistically using two-way ANOVA with Bonferroni's test with a confidence interval of 95% using GraphPad Prism software.3. Results and discussion
3.1 Characterization of MoS2 sheets and aggregates
The transformation of exfoliated MoS2 sheets into self-assembled aggregates and then back to sheets on exposure to infra-red laser was studied by several techniques. Fig. 1A shows the TEM images of MoS2 in three different forms. The exfoliated sheets had a lateral dimension of about 100 nm. After desolvation, the MoS2 sheets self-assemble into cotton-candy like shaped aggregates of approximately 100 nm diameter (Fig. 1B). It was observed that the packing of MoS2 in these aggregates was not too tight i.e. the sheets appeared to be slightly separated from each other (Table SM3, ESI†). This void space between the aggregate allows the interaction of the near infrared-light laser with the sheets. When these aggregates were subjected to a near infra-red laser treatment for 4 minutes, the aggregates disintegrated into MoS2 sheets. Although the aggregates seemed to disintegrate into sheets, the microscopy images showed that sheets were somewhat larger than the original sheets (Fig. 1C). This implies that some of the sheets could be adhering to each other and not completely separated into perfect single sheets. The effect of time on the disintegration of assembled MoS2 aggregates showed that with 3 minutes of exposure to the NIR laser, the aggregates were slightly disintegrated and further treatment led to the complete disintegration of the aggregates into sheets (4 min).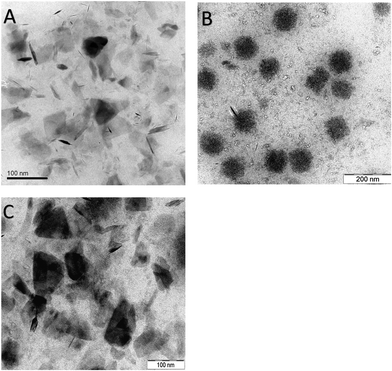 | ||
| Fig. 1 Size and morphological characterization of MoS2 samples (A) TEM image of MoS2 sheets (B) MoS2 aggregates (C) MoS2 aggregates treated with NIR. | ||
The native MoS2 sheets and aggregates were also imaged using an AFM and the images are shown in Fig. 2A–C. Native MoS2 sheets exfoliated with albumin had a height of 0.75 nm (Fig. 2A) illustrating the formation of a single sheet of MoS2 which is in agreement with previous reports.24 The MoS2 sheets formed aggregates of 30 nm height upon desolvation (Fig. 2B). When these aggregates were treated with a NIR laser, they disintegrated to form sheets with a height of about 5 nm (Fig. 2C). The increased height of sheets after the disintegration of aggregates as compared to native MoS2 sheets could be due to incomplete separation of sheets with a few sheets sticking to each other.
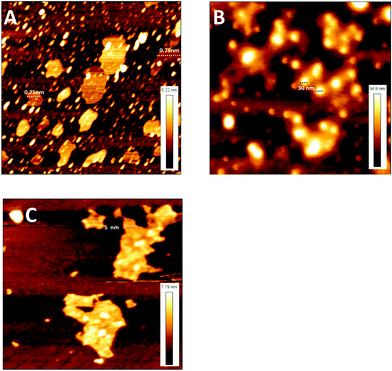 | ||
| Fig. 2 AFM micrograph of the MoS2 samples (A) MoS2 sheets, (B) MoS2 aggregates and (C) MoS2 aggregates treated with NIR. | ||
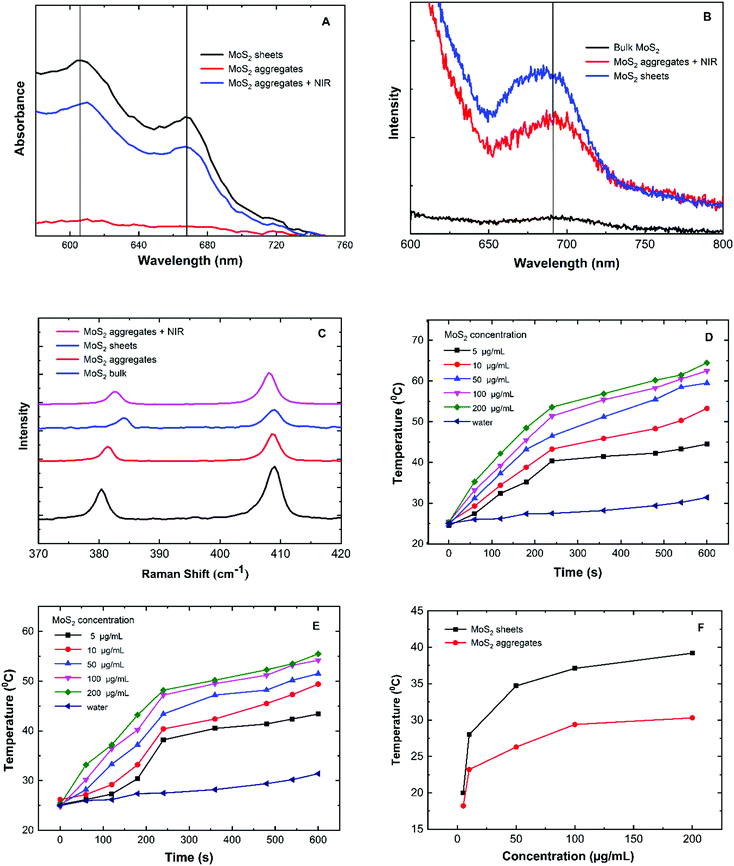
The visible absorption spectra of the protein exfoliated MoS2 (native MoS2) exhibits two peaks at 607 nm (2.04 eV) and 668 nm (1.86 eV) as shown in the Fig. 3A. The peaks correspond to the B and A excitonic absorption bands which are not observed in the bulk material (961 nm) mainly due to the decrease in the number of layers and also due to the higher optical activity of the single layered MoS2 sheets.30–32 The energy band gap determined using UV spectra demonstrates the formation of a direct band gap functioning as a photoconductive material.33 In the transformation from the MoS2 sheet to aggregates the absorbance at both the transitions is decreased drastically by 91% due to the condensation and aggregation of the MoS2 sheets. Further irradiation of the aggregates with the NIR laser results in an increase in the absorbance by 76% which illustrates the geometrical conversion of the aggregates into sheets.
The photoluminescence spectrum of the albumin exfoliated MoS2 sheets shows a broad peak at around 690 nm at an excitation of 550 nm as shown in Fig. 3B. The photoluminescence is mainly due to the transition of the indirect band (bulk MoS2) to a direct band gap of 1.86 eV (exfoliated MoS2).34 The photoluminescence properties arise due to the intrinsic electronic semiconductor properties of electron–hole recombination on excitation with a photon (radiative recombination).35 In the case of the MoS2 aggregates, the peak intensity gradually decreased due an increase in the number of layers. However, weak photoluminescence is still observed because of the voids present between the layers within the aggregates. These voids are also shown in the TEM image through which light can penetrate and excite the aggregates36,37 (Table SM3, ESI†). In the case of the MoS2 aggregate treated with a near infra-red laser, an increase in photoluminescence was observed due to the disintegration of the aggregates to sheets. However, the photoluminescence of the disintegrated sheets was not the same as native MoS2 sheets due to the stacking of the sheets into a few layers as confirmed by AFM measurements.
The Raman spectra of molybdenum disulphide are shown in Fig. 3C. The two prominent Raman peaks for molybdenum disulphide are at 379 cm−1 (E12g) and 407 cm−1 (A1g), respectively.5 The E12g phonon modes in the Raman spectra for the bulk MoS2, native MoS2 sheets, MoS2 aggregates and MoS2 aggregates treated with a near infra-red laser were exhibited at 379 cm−1, 384 cm−1, 381 cm−1 and 382 cm−1 respectively. In the case of MoS2 aggregates, the frequency shifted by 2 cm−1 with respect to the bulk due to an increase in the number of the layers. However, after the disintegration of MoS2 aggregates on exposure to a NIR laser the frequency shifted by 3 cm−1 implying a decrease in the number of layers. These changes in the frequency of Raman spectra from bulk to sheets followed by aggregation and then disintegration into sheets after exposure to a laser clearly elucidate the formation of the aggregates and disintegration of MoS2.9
The photothermal profiles of MoS2 sheets and MoS2 aggregate are shown in Fig. 3D–F. The temperature increases by 6.4 °C for the control sample (buffer solution) when exposed to a NIR laser for 10 min. In the case of MoS2 sheets, there is a gradual increase in the temperature with increasing concentration of sheets. It was observed that the photothermal temperature reached 53 °C at a concentration of 10 μg ml−1 and 60 °C at higher concentrations (200 μg ml−1).38,39 In the case of the MoS2 aggregates, the temperature increase is slow up to 3 minutes followed by a sudden increase which can be attributed to the disintegration of the aggregates into sheets resulting in higher absorption of near infra-red light. The temperature change (Δ°C) over a period of 10 min vs. concentration is plotted in Fig. 3F. The native MoS2 sheets show higher temperature change (Δ°C) compared to the aggregates because individual MoS2 sheets have larger surface area resulting in higher NIR absorption compared to aggregates which have stacked and compressed sheets.
The hydrodynamic radius and zeta potential of MoS2 samples illustrate interconversion of sheets into particles and vice versa, as shown in supplementary material (Table SM2, ESI†). It was observed that the hydrodynamic radii of the MoS2 aggregates are smaller compared to those of the sheets due to compression of sheets during the coacervation process. The same trend is followed in the case of zeta potential. MoS2 aggregates exhibit a reduced zeta potential. The hydrodynamic radius of the MoS2 aggregate increases significantly due to protein adsorption compared to sheets.40 On exposing the MoS2 aggregate to NIR results in the disintegration of sheets and physiochemical properties of sheets are regained. Furthermore, it was observed that the colloidal stability of MoS2 samples in aqueous solution was better compared to that in the presence of proteins. It was more predominant for aggregates than sheets because of the more protein adsorption between compressed sheets resulting in reduced zeta potential.41,42 The proof of concept, i.e. interconversion of the MoS2 samples, was further quantified using photoluminescence (excitation: 550 nm emission: 690 nm) which exhibits a similar trend as seen in the case of other physiochemical properties shown in Table SM4 (ESI†).
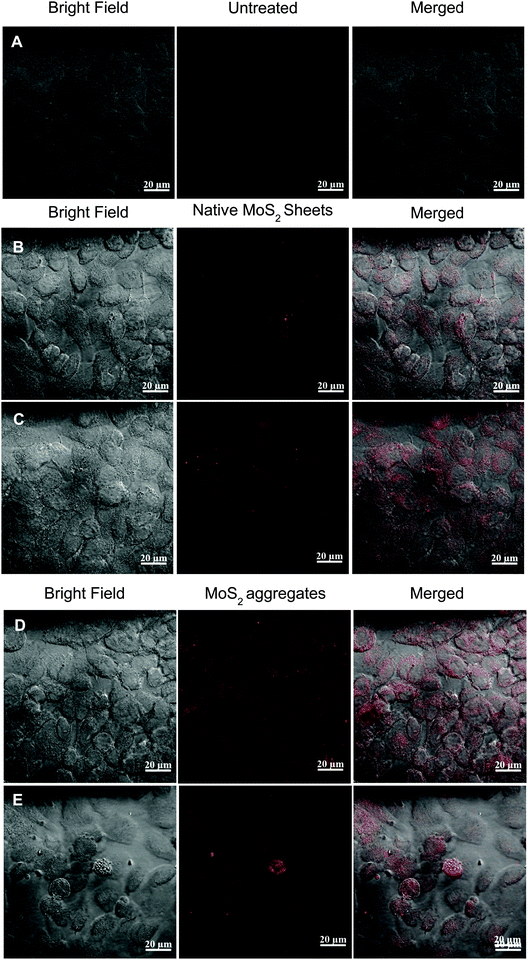
The cellular uptake (HeLa cells) of the MoS2 sheets, MoS2 aggregates and MoS2 aggregates treated with NIR laser is analysed using CLSM at excitation of 543 nm and emission at 567 nm43 (Fig. 4). In the case of cells incubated with MoS2 sheets, the cancer cells showed normal extended morphology.44 A weak fluorescence was observed mainly within the cytoplasm of the cells suggesting lower cellular uptake of the native MoS2 sheets (Fig. 4B). The cells incubated with MoS2 aggregates also show weaker fluorescence in the cytoplasm as shown in Fig. 4D. These cells were then exposed to NIR and the observations were made at different time intervals, as shown in Table SM5 (ESI†). After three minutes of exposure, a slight increase in the fluorescence in the cytoplasm was observed due to the partial disintegration of the aggregates (Table SM5E, ESI†). Further exposure up to four minutes showed a significant increase in the fluorescence throughout the cytoplasm illustrating further disintegration of the aggregates into sheets (Table SM5F, ESI†). Fig. 4E demonstrates the morphology of the cells, after treatment with MoS2 aggregates followed by exposure to a NIR laser for 10 min. The morphologies of the cells are distinctly different and cellular debris is seen. The cells appear significantly damaged and membrane integrity is compromised. The cells appear to be undergoing necrotic cell death.45 The increased endocytosis of the MoS2 aggregates is mainly due to the lowered zeta potential in the presence of serum proteins thus resulting in higher receptor mediated endocytosis of the protein adsorbed MoS2 aggregates by the cancer cells.46–49 But in the case of two dimensional MoS2 sheets, they exhibited higher colloidal stability even in the presence of proteins and thus took larger incubation time for endocytosis.50 This strategy helps in increased endocytosis of aggregates resulting in improved performance as a theranostic material at lower concentrations.
MTT assay was used to analyze the cytotoxicity (Fig. 5A) and phototoxicity (Fig. 5B) of native MoS2 sheets and MoS2 aggregates. The native MoS2 sheets and aggregate show good biocompatibility even at higher concentrations of 200 μg ml−1 (90% viable) as shown in Fig. 5A. With respect to phototoxicity, the viability of cells when exposed only to NIR radiation was not affected, as shown in Table SM6 (ESI†). With photo-irradiation, the native MoS2 sheets did not show significant toxicity with nearly 80% cells viable at 50 μg ml−1, after which the cellular viability decreases with an increase in concentration, with only 40–50% cells being viable at 200 μg ml−1 concentration. In comparison, MoS2 aggregates demonstrate similar toxicity even at 10 μg ml−1, which corresponds to almost a 20 times reduction in concentration to achieve the same toxicity with NIR radiation as shown in Fig. 5B. Nearly 90% cell death was observed at a concentration of 100 μg ml−1. The increased cytotoxicity with MoS2 aggregates could be attributed to higher cellular uptake of the aggregates. Upon NIR irradiation the aggregates are transformed into sheets resulting in increased intracellular temperature and cellular death.51 It was observed that further increasing the concentration did not significantly improve the toxicity.
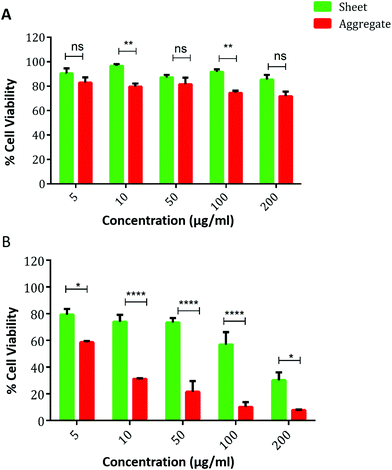 | ||
| Fig. 5 Comparison of cellular viability of HeLa cells after treatment with MoS2 sheets and aggregates (A) without NIR and (B) with NIR irradiation. | ||
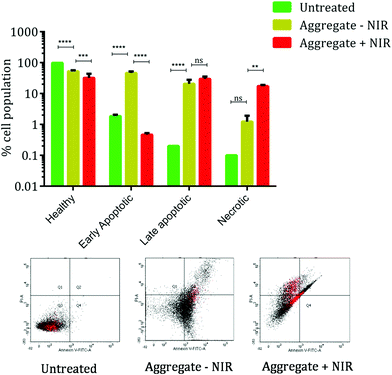
Based on the results of the MTT assay, the mechanism of the cell death was elucidated using the annexin V/PI double staining protocol. Fig. 6 shows the cellular population at various stages of cell death. The annexin V staining provides a sensitive method for detecting cellular apoptosis, while propidium iodide (PI) staining is used to detect necrotic or late apoptotic cells, which is characterized by the loss of the membrane integrity. The healthy cell population decreases after aggregate treatment and NIR irradiation. Treatment with MoS2 aggregates shows increased apoptosis as seen from the shift of cellular population from Q3 to Q4 and Q5 quadrants. But upon exposure to NIR radiation, we observe a significant increase in the necrotic cellular population and a very slight change in the late apoptotic cellular population. The increase in the necrotic population in the Q1 and Q2 quadrants indicates compromised membrane integrity. Comparison of early apoptotic cells and necrotic cells after treatment exhibits a characteristic flip-flop pattern which agrees with our hypothesis of photothermal induced cellular damage after NIR radiation in cells treated with MoS2 aggregates.
4. Conclusions
A simple and effective technique for increasing the uptake of MoS2 sheets into cancer cell lines by converting albumin decorated MoS2 sheets into cotton-candy like aggregates and then disintegrating the aggregates into sheets using a laser has been demonstrated here. Initially, MoS2 sheets were produced by exfoliating bulk MoS2 into sheets using albumin. The native MoS2 sheets exhibited superior photoluminescence, biocompatibility and photothermal properties but poor cellular uptake. The sheets were converted to aggregates by desolvation which then showed increased cellular uptake and exhibited superior phototoxicity induced by a NIR laser at concentrations much lower than native sheets. The aggregates disintegrated into sheets while retaining their native luminescence properties.Conflicts of interest
The authors declare no competing financial interest.Acknowledgements
One of the authors Dr Lakshmi Narashimhan Ramana (BL/14-15/0172) acknowledges UGC, New Delhi for financial assistance provided in the form of Dr D. Kothari Post-Doctoral Fellowship. The infrastructure provided by the Indian Institute of Science, Confocal facility and FACS facility is gratefully acknowledged.References
- R. Siegel, C. DeSantis, K. Virgo, K. Stein, A. Mariotto, T. Smith, D. Cooper, T. Gansler, C. Lerro, S. Fedewa, C. Lin, C. Leach, R. S. Cannady, H. Cho, S. Scoppa, M. Hachey, R. Kirch, A. Jemal and E. Ward, Ca-Cancer J. Clin., 2012, 62, 220–241 CrossRef.
- C. E. Eyler and J. N. Rich, J. Clin. Oncol., 2008, 26, 2839–2845 CrossRef CAS.
- L. Cheng, C. Wang, L. Feng, K. Yang and Z. Liu, Chem. Rev., 2014, 114, 10869–10939 CrossRef CAS.
- R.-M. Szeimies and M. Landthaler, Cancers of the Skin, Springer, 2002, pp. 240–245 Search PubMed.
- S. Luo, X. Qi, L. Ren, G. Hao, Y. Fan, Y. Liu, W. Han, C. Zang, J. Li and J. Zhong, J. Appl. Phys., 2014, 116, 164304 CrossRef.
- A. Fernandez-Fernandez, R. Manchanda and A. J. McGoron, Appl. Biochem. Biotechnol., 2011, 165, 1628–1651 CrossRef CAS.
- Y. Huang, S. He, W. Cao, K. Cai and X.-J. Liang, Nanoscale, 2012, 4, 6135–6149 RSC.
- E.-K. Lim, T. Kim, S. Paik, S. Haam, Y.-M. Huh and K. Lee, Chem. Rev., 2015, 115, 327–394 CrossRef CAS.
- H. Peng, X. Liu, G. Wang, M. Li, K. M. Bratlie, E. Cochran and Q. Wang, J. Mater. Chem. B, 2015, 3, 6856–6870 RSC.
- X. Song, Q. Chen and Z. Liu, Nano Res., 2015, 8, 340–354 CrossRef CAS.
- Z. Bao, X. Liu, Y. Liu, H. Liu and K. Zhao, Asian J. Pharm. Sci., 2016, 11, 349–364 CrossRef.
- T. Liu, Y. Chao, M. Gao, C. Liang, Q. Chen, G. Song, L. Cheng and Z. Liu, Nano Res., 2016, 9, 3003–3017 CrossRef CAS.
- H. Soo Choi, W. Liu, P. Misra, E. Tanaka, J. P. Zimmer, B. Itty Ipe, M. G. Bawendi and J. V. Frangioni, Nat. Biotechnol., 2007, 25, 1165–1170 CrossRef.
- S. D. Steichen, M. Caldorera-Moore and N. A. Peppas, Eur. J. Pharm. Sci., 2013, 48, 416–427 CrossRef CAS.
- S. Z. Butler, S. M. Hollen, L. Cao, Y. Cui, J. A. Gupta, H. R. Gutiérrez, T. F. Heinz, S. S. Hong, J. Huang, A. F. Ismach, E. Johnston-Halperin, M. Kuno, V. V. Plashnitsa, R. D. Robinson, R. S. Ruoff, S. Salahuddin, J. Shan, L. Shi, M. G. Spencer, M. Terrones, W. Windl and J. E. Goldberger, ACS Nano, 2013, 7, 2898–2926 CrossRef CAS.
- X. Zhu, X. Ji, N. Kong, Y. Chen, M. Mahmoudi, X. Xu, L. Ding, W. Tao, T. Cai, Y. Li, T. Gan, A. Barrett, Z. Bharwani, H. Chen and O. C. Farokhzad, ACS Nano, 2018, 12, 2922–2938 CrossRef CAS.
- Q. Mu, G. Su, L. Li, B. O. Gilbertson, L. H. Yu, Q. Zhang, Y.-P. Sun and B. Yan, ACS Appl. Mater. Interfaces, 2012, 4, 2259–2266 CrossRef CAS.
- J. Mao, P. Chen, J. Liang, R. Guo and L.-T. Yan, ACS Nano, 2016, 10, 1493–1502 CrossRef CAS.
- V. León, J. González-Domínguez, J. L. Fierro, M. Prato and E. Vázquez, Nanoscale, 2016, 8, 14548–14555 RSC.
- X. Liu, C. Yan and K. L. Chen, Environ. Sci. Technol., 2019, 53, 8631–8639 CrossRef CAS.
- J.-K. Huang, J. Pu, C.-L. Hsu, M.-H. Chiu, Z.-Y. Juang, Y.-H. Chang, W.-H. Chang, Y. Iwasa, T. Takenobu and L.-J. Li, ACS Nano, 2014, 8, 923–930 CrossRef CAS.
- L. Zhang, S. Shen, Z. Liu and M. Ji, Adv. Biosyst., 2017, 1, 1700013 CrossRef.
- J. Hao, G. Song, T. Liu, X. Yi, K. Yang, L. Cheng and Z. Liu, Adv. Sci., 2017, 4, 1600160 CrossRef.
- G. Guan, S. Zhang, S. Liu, Y. Cai, M. Low, C. P. Teng, I. Y. Phang, Y. Cheng, K. L. Duei, B. M. Srinivasan, Y. Zheng, Y.-W. Zhang and M.-Y. Han, J. Am. Chem. Soc., 2015, 137, 6152–6155 CrossRef CAS.
- A. Jahanban-Esfahlan, S. Dastmalchi and S. Davaran, Int. J. Biol. Macromol., 2016, 91, 703–709 CrossRef CAS.
- L. N. Ramana, S. Sharma, S. Sethuraman, U. Ranga and U. M. Krishnan, Int. J. Pharm., 2012, 431, 120–129 CrossRef CAS.
- Q. Han, X. Wang, X. Jia, S. Cai, W. Liang, Y. Qin, R. Yang and C. Wang, Nanoscale, 2017, 9, 5927–5934 RSC.
- L. Chen, Y. Feng, X. Zhou, Q. Zhang, W. Nie, W. Wang, Y. Zhang and C. He, ACS Appl. Mater. Interfaces, 2017, 9, 17347–17358 CrossRef CAS.
- Y. Qin, Z.-W. Zhou, S.-T. Pan, Z.-X. He, X. Zhang, J.-X. Qiu, W. Duan, T. Yang and S.-F. Zhou, Toxicology, 2015, 327, 62–76 CrossRef CAS.
- R. C. T. Howe, R. I. Woodward, G. Hu, Z. Yang, E. J. R. Kelleher and T. Hasan, Phys. Status Solidi B, 2016, 253, 911–917 CrossRef CAS.
- D. Dumcenco, D. Ovchinnikov, K. Marinov, P. Lazić, M. Gibertini, N. Marzari, O. L. Sanchez, Y.-C. Kung, D. Krasnozhon, M.-W. Chen, S. Bertolazzi, P. Gillet, A. Fontcuberta i Morral, A. Radenovic and A. Kis, ACS Nano, 2015, 9, 4611–4620 CrossRef CAS.
- O. Y. Posudievsky, O. A. Khazieieva, V. V. Cherepanov, G. I. Dovbeshko, A. G. Shkavro, V. G. Koshechko and V. D. Pokhodenko, J. Mater. Chem. C, 2013, 1, 6411–6415 RSC.
- K. F. Mak, C. Lee, J. Hone, J. Shan and T. F. Heinz, Phys. Rev. Lett., 2010, 105, 136805 CrossRef.
- G. Eda, H. Yamaguchi, D. Voiry, T. Fujita, M. Chen and M. Chhowalla, Nano Lett., 2011, 11, 5111–5116 CrossRef CAS.
- U. Bockelmann, Phys. Rev. B: Condens. Matter Mater. Phys., 1993, 48, 17637–17640 CrossRef CAS.
- A. Splendiani, L. Sun, Y. Zhang, T. Li, J. Kim, C.-Y. Chim, G. Galli and F. Wang, Nano Lett., 2010, 10, 1271–1275 CrossRef CAS.
- N. Scheuschner, O. Ochedowski, A.-M. Kaulitz, R. Gillen, M. Schleberger and J. Maultzsch, Phys. Rev. B: Condens. Matter Mater. Phys., 2014, 89, 125406 CrossRef.
- W. Yin, L. Yan, J. Yu, G. Tian, L. Zhou, X. Zheng, X. Zhang, Y. Yong, J. Li, Z. Gu and Y. Zhao, ACS Nano, 2014, 8, 6922–6933 CrossRef CAS.
- W. Feng, L. Chen, M. Qin, X. Zhou, Q. Zhang, Y. Miao, K. Qiu, Y. Zhang and C. He, Sci. Rep., 2015, 5, 17422 CrossRef CAS.
- T. Zheng, P. Cherubin, L. Cilenti, K. Teter and Q. Huo, Analyst, 2016, 141, 934–938 RSC.
- M. Han, L. Zhu, J. Mo, W. Wei, B. Yuan, J. Zhao and C. Cao, ACS Appl. Bio Mater., 2020, 3, 4220–4229 CrossRef CAS.
- J. Tanum, J. Heo and J. Hong, ACS Omega, 2018, 3, 5903–5909 CrossRef CAS.
- N. Wang, F. Wei, Y. Qi, H. Li, X. Lu, G. Zhao and Q. Xu, ACS Appl. Mater. Interfaces, 2014, 6, 19888–19894 CrossRef CAS.
- S. Wang, Y. Chen, X. Li, W. Gao, L. Zhang, J. Liu, Y. Zheng, H. Chen and J. Shi, Adv. Mater., 2015, 27, 7117–7122 CrossRef CAS.
- S. Rello, J. C. Stockert, V. Moreno, A. Gámez, M. Pacheco, A. Juarranz, M. Cañete and A. Villanueva, Apoptosis, 2005, 10, 201–208 CrossRef CAS.
- S. Behzadi, V. Serpooshan, W. Tao, M. A. Hamaly, M. Y. Alkawareek, E. C. Dreaden, D. Brown, A. M. Alkilany, O. C. Farokhzad and M. Mahmoudi, Chem. Soc. Rev., 2017, 46, 4218–4244 RSC.
- P. Foroozandeh and A. A. Aziz, Nanoscale Res. Lett., 2018, 13, 339 CrossRef.
- S. Jeon, J. Clavadetscher, D.-K. Lee, S. V. Chankeshwara, M. Bradley and W.-S. Cho, Nanomaterials, 2018, 8, 1028 CrossRef.
- E. C. Cho, Q. Zhang and Y. Xia, Nat. Nanotechnol., 2011, 6, 385–391 CrossRef CAS.
- P.-C. Wu, D.-B. Shieh and F.-Y. Cheng, RSC Adv., 2014, 4, 53297–53306 RSC.
- A. Bettaieb and D. A. Averill-Bates, Biochim. Biophys. Acta, Mol. Cell Res., 2015, 1853, 52–62 CrossRef CAS.
Footnote |
| † Electronic supplementary information (ESI) available. See DOI: 10.1039/d0ma00609b |
| This journal is © The Royal Society of Chemistry 2020 |

