 Open Access Article
Creative Commons Attribution 3.0 Unported Licence
Site occupancy preference, electrical transport property and thermoelectric performance of Ba8Cu6−xGe40+x single crystals grown by using different metal fluxes†
Jiazhen
Wu
*a,
Jingtao
Xu
 *b and
Katsumi
Tanigaki
*ac
aWPI-AIMR, Tohoku University, Sendai, 980-8577, Japan. E-mail: wujzphystu@gmail.com; ichi0014@hotmail.com; tanigaki@sspns.phys.tohoku.ac.jp
bNingbo Ruiling Advanced Energy Materials Institute Co., Ltd, Ningbo 315500, China
cGraduate School of Science, Tohoku University, Sendai 980-8578, Japan
First published on 30th October 2020
Abstract
Different fluxes, Ga, Bi, In, Sb, and Sn, have been used to grow clathrate Ba8Cu5.3Ge40.7 (BCG) single crystals using a flux method, and BCG single crystals have been successfully synthesized by Bi-, In- and Sn-flux. The grown crystals were characterized by single crystal and power X-ray diffraction as well as energy dispersive X-ray spectroscopy measurements. The solubility of flux inside the crystals was determined and the actual chemical composition was decided to be: Ba8Cu5.1Ge40.5 (BCG-Bi), Ba8Cu4.6In1.4Ge40.0 (BCG-In) and Ba8Cu5.1Ge40.2Sn0.7 (BCG-Sn) for the compounds grown from Bi-, In- and Sn-flux, respectively. A high electron mobility (μ), 44.8 cm2 V−1 s−1 at 300 K, is observed for BCG-In, which is almost 5 times higher than the reported data at a similar carrier concentration. Therefore, enhanced thermoelectric power factors and ZT values are obtained. The relationship between the structure and electrical/thermoelectric properties is discussed. The high μ is most probably due to the relatively ordered cage framework structure in BCG-In, because the 6c site is fully occupied by Cu and In, and the other two sites are uniformly occupied by Ge.
Introduction
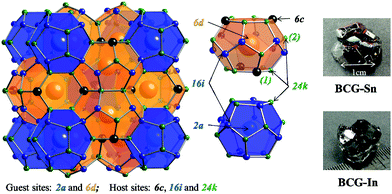
Intermetallic clathrates are classified as a type of the conceptual “phonon-glass electron-crystal” (PGEC) materials and have been widely studied for their thermoelectric applications.1 Among the clathrate family, type-I clathrates (as shown in Fig. 1) are the most extensively considered due to their stable structures and variety of species. From the viewpoint of thermoelectric performance, which can be quantitatively expressed by the dimensionless figure of merit, ZT = (S2σ/κ)T, the most advantageous point of type-I clathrates is the guest atom vibration modes (rattling), because they can suppress heat conduction efficiently while exert little influence on electrical conduction. Here S, σ, and κ stand for the Seebeck coefficient, electrical conductivity, and thermal conductivity, respectively.Under the guideline of the PGEC concept, researchers have obtained the highest ZT of 1.35 at 900 K for Ba8Ga16Ge30 (BGG);2 however, most clathrates still show ZT values below 0.5,1 which is not sufficient for real applications. Therefore, both optimization of thermoelectric performance and the inspiration from the PGEC character of clathrates are the key issues in the research field. The PGEC concept itself provides two routes for maximizing ZT: one is via phonon engineering, the other is via conduction carrier engineering. On phonon aspect, κ can be further lowered by increasing anharmonicity of the rattling motions, and the typical examples are Ba8Ga16Sn30 (BGSn), Sr8Ga16Ge30 (SGG) and p type BGG.3,4 There are many reported works, in which, rattling phonons and their roles on heat conduction have been described clearly.5–9 It is note worthy that the nano-structuring technique, widely applied for other materials systems for suppressing heat conduction,10,11 do not work well in clathrates and higher ZT values were observed in clathrate single crystals,2,12 indicating that phonon scattering due to rattling phonons is dominant in the scattering process. On the contrary, in order to improve electrical conduction, nano-structuring, which introduces a lot of grain boundaries, should be avoided.
On electron aspect, briefly speaking, the optimization of ZT is generally made by modifying three basic physical parameters: the carrier concentration (n), effective mass (m*) and carrier mobility (μ), because the thermoelectric parameters S, σ and the thermal conductivity contributed from carriers (κe) are all strongly associated with these parameters. Among the three parameters, n and m* are more closely related to intrinsic materials properties and their detailed information can be deduced from electronic band structure; whereas μ is more sensitive to extrinsic factors such as defects and grain boundaries.10
The zintl phase concept provides an access to modify n as well as carrier type by deviating the stoichiometric ratio of component elements.5 For instance, the stoichiometric Ba8Ga16Ge30 is an intrinsic semiconductor, and it can become an n- or p-type conductive compound by increasing the content of Ge or Ga. m* can be modified by introducing anharmonic vibrations of the guest atoms13 or by substituting framework atoms with transition elements.14 The above modifications on n and m* can be summarized as band structure engineering by changing either the Fermi level or the shape of the electronic band. The extrinsic-factor indicator μ can be increased by decreasing the electron scattering rate (τe−1), which is closely related to grain boundaries and crystalline defects. In clathrates, μ can actually be enhanced by improving the order of the framework structure as well as the quality of the single crystals as pointed by many researchers.14–20
A typical structure of type-I clathrate is shown in Fig. 1. According to the figure, the most ordered framework structure should be made up of one type of element, for example, the frameworks of Ba8Si46 and Ba8Ge46 (actually Ba8Ge43, with three vacancies on the framework); however these binary compounds are metals and not considered as thermoelectric materials. Relatively ordered framework structures can be created by partial substitution of Si or Ge with group 13 elements (XIII) or transition elements (TM). It has been shown that, in the case of XIII substitution, XIII are randomly distributed in the three framework sites21 (6c, 16i and 24k as shown in Fig. 1), while in the case of TM substitution, there is a complete ordering of TM on the 6c site.14,16,17 Among the TM containing clathrates, Ba8Cu5.3Ge40.7 (BCG) was supposed to have the most ordered framework structure, because the stoichiometric amount of Cu is 5.3, which is very close to the number of atoms on the 6c site.16,17
Although BCG has been of great scientific interest, reported BCG's are mainly polycrystals, in which grain boundaries as well as framework vacancies greatly limit the electrical transport performance,16,17 and the advantages of the relatively ordered structure can not be even evidenced. The difficult point for growing a BCG single crystal is that the useful self-flux method, successfully applied for BGG, SGG, BGSn, etc., can not be used, because none of the component elements could serve as a flux. S. Paschen's group has prepared a single crystal of BCG by using the zone melting method, but they only focused on thermal conductivity.22 Recently, we have tried tin flux to grow BCG, and obtained beautiful single crystals with good thermoelectric performance (ZTmax = 0.6 at 773 K).23 The flux method provides us a platform to grow high quality single crystals of BCG, so that a comprehensive study using different metal fluxes on crystal quality, site occupancy preference as well as their influences to the electrical and thermal transport properties can be made in details.
In the present study, we report the syntheses, crystal structures and physical properties of Ba8Cu5.1Ge40.5 (BCG-Bi), Ba8Cu4.6In1.4Ge40.0 (BCG-In) and Ba8Cu5.1Ge40.2Sn0.7 (BCG-Sn) single crystals, grown by using Bi-, In-, and Sn-flux, respectively. The influence of different fluxes are carefully analysed by combining the crystal structure and their corresponding physical properties. Comparing to the reported polycrystalline BCG and BGG, our single crystals of BCG show much higher electron mobility and an enhancement of thermoelectric power factor (PF). In particular, the compounds in our study show similar n and m*, the mere influence of the extrinsic parameter μ can be clearly observed, and this will provide clear and important guidelines for optimizing thermoelectric performance of clathrates.
Experiment section
Materials syntheses
In order to prepare Ba8Cu5.3Ge40.7 single crystals, stoichiometric amounts of Ba pieces (99.9% metal basis), Cu grains (99.99%), and Ge grains (99.999%) with an excess amount of Ba (5% amount) to compensate the reaction loss and a large amount of Bi grains (99.99%) or In grains (99.99%) or Sn grains (99.999%) as the flux, were loaded into a quartz tube in an Ar-filled glovebox [p(O2, H2O) ≤ 1 ppm]. The quartz tube was then sealed under high vacuum and heated in a box furnace up to 1150 °C in 10 h, annealed for 5 h, and slowly cooled down to 650 °C over 100 h and annealed again for 50 h. The liquid flux was then separated from the grown single crystals by centrifugation, and flux impurities can be further removed by using diluted hydrochloric acid or mechanical cutting and polishing. The as grown single crystals of BCG-Sn and BCG-In are shown on the right side of Fig. 1, while BCG-Bi single crystals are very small in size. In the preparation of the materials, different fluxes as well as different amounts of fluxes were tried, the results are summarized in Table 1. BCG polycrystals were prepared by using a radio frequency (RF) induction furnace for comparison.| Flux | Amount(x) | Results |
|---|---|---|
| Ga | 20–40 | BGG |
| Sb | 40 | Ge pieces |
| Sn | 40 | BCG-Sn (<1 mm) and Ge pieces |
| Sn | 20 | BCG-Sn (5–11 mm) |
| In | 30–40 | BCG-In (5–11 mm) |
| In | Less than 20 | BCG-In (<0.5 mm) |
| Bi | 10–20 | BCG-Bi (11 mm) and Ge pieces |
| Bi | 60 | Nothing |
Microstructure analyses
Selected compounds of BCG-Bi, BCG-In and BCG-Sn single crystals as well as BCG polycrystals were polished and applied for field-emission scanning electron microscope (FE-SEM: JEOL, JSM-7800F) measurements and the component elements were analyzed by using energy dispersive X-ray spectrometer (EDS: Oxford Instruments, X-Max SDD Detector) with an accelerating voltage of 20 kV. The following X-ray emission lines were employed for analyses: Ba L, Cu K, Ge K, Sn L, and In L.Powder X-ray diffraction
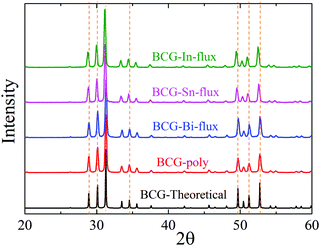
The BCG samples were ground into fine powder and loaded in the low background silicon sample holders for powder X-ray diffraction (PXRD) measurement. The data were collected at room temperature (RT) with 2θ ranging from 10° to 90° by using the parallel-beam optics of Rigaku, SmartLab 9MTP. The diffractometer was operated under 40 kV and 50 mA with Cu Kα radiation. Rietveld refinement was performed using GSAS program package.24,25 Part of the diffraction patterns are shown in Fig. 2 and the calculated lattice constants are summarized in Table 2.Single crystal X-ray diffraction
The single crystals was checked by a Rigaku R-AXIS single-crystal diffractometer using Mo Kα radiation (λ = 0.71075 Å) at RT. The collected frames were integrated using the Rigaku RAPID AUTO program. Absorption correction was performed by a multi-scan procedure. The crystal structures were solved by direct methods and refined by the full-matrix least-squares method against F02 with WinGX program package.26 Crystallographic data of BCG single crystals at room temperature can be found in Table 3.| Sample | BCG-Sn | BCG-In | BCG-Bi |
|---|---|---|---|
| Space group |
Pm![[3 with combining macron]](https://www.rsc.org/images/entities/char_0033_0304.gif) n (no. 223) n (no. 223) |
Pm![[3 with combining macron]](https://www.rsc.org/images/entities/char_0033_0304.gif) n (no. 223) n (no. 223) |
Pm![[3 with combining macron]](https://www.rsc.org/images/entities/char_0033_0304.gif) n (no. 223) n (no. 223) |
| a/Å | 10.7176(8) | 10.7458(5) | 10.6904(6) |
| Molar mass | 4424.72 | 4456.07 | 4392.45 |
| Z; ρ/g cm−3 | 1; 5.968 | 1; 5.963 | 1; 5.970 |
| Radiation, wavelength λ/Å | 0.71075 | 0.71075 | 0.71075 |
| Absorption correction | Multi-scan | Multi-scan | Multi-scan |
| Reflections collected | 14![[thin space (1/6-em)]](https://www.rsc.org/images/entities/char_2009.gif) 410 410 |
4482 | 3668 |
| Independent reflns | 447[R(int) = 0.0601] | 279[R(int) = 0.0709] | 215[R(int) = 0.0832] |
| Residuals [I > 2σ(I)] | R 1 = 0.0268 | R 1 = 0.213 | R 1 = 0.0304 |
| wR2 = 0.0447 | wR2 = 0.0479 | wR2 = 0.0696 | |
| Residuals (all data) | R 1 = 0.0285 | R 1 = 0.0223 | R 1 = 0.0307 |
| wR2 = 0.0450 | wR2 = 0.0483 | wR2 = 0.0697 | |
| GOF on F2 | 1.431 | 1.178 | 1.199 |
Differential scanning calorimetry
Differential scanning calorimetry (DSC) measurements were made with Netzsch, DSC404F3ST Pegasus. Around 20 mg compounds were sealed in Al2O3 ampoules (ϕ 5 mm) and heated up to 1000 °C under an Ar atmosphere with a heating rate of 10 K min−1. BCG-Sn was found to melt congruently at T = 911 °C.23 The melting points of BCG-In, BCG-Bi, and BCG polycrystals were derived to be T = 918 °C, T = 925 °C, and T = 917 °C, respectively.Physical properties measurements
Thermoelectric properties of the grown compounds were measured by employing the thermal transport option (TTO) of PPMS (physical properties measurements system, Quantum Design) from 2 K to 300 K. For convenience, the two-probe method was applied. The selected samples were cut into cuboid shapes with dimensions of several millimeters and then attached in copper discs with silver conductive epoxy. The epoxy was dried under vacuum at 150 °C for 2 h to achieve good conductance and high mechanical strength. The resistivity of the compounds was measured with a four-probe method by utilizing the resistivity option of PPMS. Heat capacity measurements were carrier out on BCG-Sn and BCG-In single crystals with mass ranging from 10 mg to 40 mg from 0.36 K to 70 K by using PPMS equipped with a 3He cryostat. Electrical resistivity and Hall resistivity were measured on the same specimen by using the resistivity option of PPMS from 2 K to 300 K. For Hall resistivity measurement, the magnetic field was scanned from ±9 T to 99 T and the sample was polished to be thinner than 0.2 mm. Carrier density and mobility were derived from the electrical transport measurements.Electronic structure calculations
The electronic band structure calculations were performed using Vienna Ab initio Simulation Package (VASP) program.27,28 The density functional theory (DFT) in the generalized gradient approximation (GGA) with the Perdew–Burke–Ernzerhof (PBE) functional29 were used for description of the electronic state. The plane wave basis set with cut-off energy of 500 eV and Γ centered 5 × 5 × 5 Monkhorst–Pack k-point meshes were applied to sample the irreducible Brillouin zone. Structure optimization was done under BCC symmetry with the electronic energy convergence criterion of Δε = 10−5 eV.Results and discussion
Phase analyses
The obtained crystals can be recognized through polyhedral surfaces, as shown in Fig. 1. Some Ge pieces were found and separated from clathrate crystals. The composition and crystal structure were then confirmed by EDS and XRD, respectively. The EDS measurements show that a small amount of Sn (In) homogeneously distributes in the BCG-Sn (BCG-In) crystal, while in BCG-Bi, no Bi was detected inside the crystal. Our PXRD results (in Fig. 2) show that the grown compounds are single phases. It means that the small amount of Sn and In are not impurities but the component elements of the compounds. This result can be further confirmed by single crystal X-ray diffraction (SCXRD) and DSC measurements.Crystal structure and chemical composition
Single crystal X-ray diffraction at RT shows that BCG samples crystallize in cubic space group Pm![[3 with combining macron]](https://www.rsc.org/images/entities/char_0033_0304.gif) n (No. 223) with type-I clathrate structure (Fig. 1). The atomic parameters of BCG's are shown in Tables 4–6 for BCG-Sn, BCG-In, and BCG-Bi, respectively. More details of the data collection and the refinement parameters are given in the ESI.†
n (No. 223) with type-I clathrate structure (Fig. 1). The atomic parameters of BCG's are shown in Tables 4–6 for BCG-Sn, BCG-In, and BCG-Bi, respectively. More details of the data collection and the refinement parameters are given in the ESI.†
| Atom | Site | x | y | z | Occupancy | U eq |
|---|---|---|---|---|---|---|
| Ba(1) | 2a | 0.000 | 0.000 | 0.000 | 1 | 0.0086(2) |
| Ba(2) | 24k | 0.500 | 0.253 | −0.016 | 0.25 | 0.023(2) |
| Cu(1)/Ge(1) | 6c | 0.250 | 0.500 | 0.000 | 0.849/0.151 | 0.0098(3) |
| Ge(2) | 16i | 0.183(2) | x | x | 1 | 0.0071(7) |
| Ge(3)/Sn(3) | 24k | 0.119(9) | 0.314(5) | 0.000 | 0.970/0.030 | 0.0088(1) |
| Atom | U 11 | U 22 | U 33 | U 23 | U 13 | U 12 |
|---|---|---|---|---|---|---|
| Ba(1) | 0.0086(2) | U 11 | U 11 | 0.000 | 0.000 | 0.000 |
| Ba(2) | 0.028(4) | 0.022(5) | 0.021(3) | −0.001(5) | 0.000 | 0.000 |
| Cu(1)/Ge(1) | 0.0134(6) | 0.0080(4) | 0.0080(4) | 0.000 | 0.000 | 0.000 |
| Ge(2) | 0.0071(7) | U 11 | U 11 | −0.0010 | U 23 | U 23 |
| Ge(3)/Sn(3) | 0.0095(2) | 0.0086(2) | 0.0083(2) | 0.000 | 0.000 | 0.0013(4) |
| Atom | Site | x | y | z | Occupancy | U eq |
|---|---|---|---|---|---|---|
| Ba(1) | 2a | 0.000 | 0.000 | 0.000 | 1 | 0.0086(3) |
| Ba(2) | 24k | 0.500 | −0.014 | 0.252 | 0.25 | 0.0285(1) |
| Cu(1)/In(1) | 6c | 0.500 | 0.250 | 0.000 | 0.77/0.23 | 0.0096(5) |
| Ge(2) | 16i | 0.183(2) | x | x | 1 | 0.0070(3) |
| Ge(3) | 24k | 0.312(5) | 0.118(7) | 0.000 | 1 | 0.0107(3) |
| Atom | U 11 | U 22 | U 33 | U 23 | U 13 | U 12 |
|---|---|---|---|---|---|---|
| Ba(1) | 0.0086(3) | U 11 | U 11 | 0.000 | 0.000 | 0.000 |
| Ba(2) | 0.057(1) | 0.009(1) | 0.020(4) | 0.000 | 0.000 | 0.000 |
| Cu(1)/In(1) | 0.0086(6) | 0.0116(8) | 0.0086(6) | 0.000 | 0.000 | 0.000 |
| Ge(2) | 0.0070(3) | U 11 | U 11 | −0.0009 | U 23 | U 23 |
| Ge(3) | 0.0107(4) | 0.0130(4) | 0.0085(4) | 0.000 | 0.000 | 0.0039(3) |
According to the results of the EDS measurements and the refinement results of SCXRD (atomic occupancies shown in Tables 4–6), the unit cell formulas of BCG's are derived to be: Ba8Cu5.1Ge40.5 (BCG-Bi), Ba8Cu4.6In1.4Ge40.0 (BCG-In) and Ba8Cu5.1Ge40.2Sn0.7 (BCG-Sn) for the compounds grown by Bi-, In- and Sn-flux, respectively. Due to Zintl phase, the charge balance of a stoichiometric BCG can be expressed as, [Ba2+]8[(4b)Cu−3]5.33[(4b)Ge0]40.67, where 4b means the sp3-type 4 bonds. As a result of the charge balance, there are around 0.7, 0.8 and 0.7 additional electrons per unit cell as itinerant electrons for BCG-Bi, BCG-In and BCG-Sn, respectively. That is to say, the three compounds are expected to show similar carrier concentrations. Lattice constant is quite sensitive to the chemical composition as well. As In and Sn are included inside the crystal lattices, BCG-In and BCG-Sn show larger lattice constants than BCG-Bi and BCG-polycrystal, as can be seen in Table 2.
| Atom | Site | x | y | z | Occupancy | U eq |
|---|---|---|---|---|---|---|
| Ba(1) | 2a | 0.000 | 0.000 | 0.000 | 1 | 0.0155(7) |
| Ba(2) | 6d | 0.500 | 0.000 | 0.250 | 1 | 0.0398(7) |
| Cu(1)/Ge(1) | 6c | 0.500 | 0.250 | 0.000 | 0.849/0.151 | 0.0170(8) |
| Ge(2) | 16i | 0.183(2) | x | x | 0.974(7) | 0.0129(6) |
| Ge(3) | 24k | 0.314(5) | 0.119(8) | 0.000 | 0.998(8) | 0.0151(6) |
| Atom | U 11 | U 22 | U 33 | U 23 | U 13 | U 12 |
|---|---|---|---|---|---|---|
| Ba(1) | 0.0155(7) | U 11 | U 11 | 0.000 | 0.000 | 0.000 |
| Ba(2) | 0.0457(8) | U 11 | 0.0278(1) | 0.000 | 0.000 | 0.000 |
| Cu(1)/Ge(1) | 0.0156(1) | 0.0198(1) | 0.0156(1) | 0.000 | 0.000 | 0.000 |
| Ge(2) | 0.0129(6) | U 11 | U 11 | −0.0006 | U 23 | U 23 |
| Ge(3) | 0.0148(7) | 0.0156(8) | 0.0147(7) | 0.000 | 0.000 | 0.0012(4) |
Disorder of the guest atom
The guest atom Ba(2) was found to be off-centered on the 24k site with a displacement of 0.173 Å and 0.155 Å from the center (the crystallographic 6d site) for BCG-Sn and BCG-In, respectively, as shown in Tables 4 and 5, while Ba2 is on-centered on the 6d site for BCG-Bi. Actually, a Ba(2) on-centered model can also be applied for the refinement of the X-ray diffraction data of BCG-Sn and BCG-In; but a slightly better result was obtained by using the off-centered model. The crystallographic information files (CIF) are provided in the Supporting Information for both cases. It should be noted that, different from BGSn,4,30 the off-centered behavior can not be visualized by the electron density maps derived from the inverse Fourier transformation of the SCXRD data, because the off-centered displacements are too small. In the case of BCG-Bi, the off-centered model failed for refinement: even Ba(2) was intentionally moved to a 24k site or 24j cite at the beginning, it gradually recovered to the 6d site after several cycles of refinement. Interestingly, as the cage size increases from BCG-Bi to BCG-Sn and BCG-In, Ba2 becomes off-centered, this is consistent with our previous report that the potential inside the cage is very sensitive to the free space of the guest atom.31 The guest atom vibrations are generally described by the Einstein model on solids, and the discussion will be given in the Heat capacity section.Host site occupancy preference
As shown in Fig. 1, there are three crystallographic sites for host atoms: 6c, 16i and 24k. These atoms are arranged under the cubic space group, Pm![[3 with combining macron]](https://www.rsc.org/images/entities/char_0033_0304.gif) n, to form both dodecahedral cages and tetrakaidecahedral cages. Generally, there are two ways to describe the framework structure. One was suggested by Demkov et al.32 that the tetrakaidecahedral cages are joined together through their hexagonal faces to form pillars, which are arranged to construct the final structure (dodecahedral cages are the remained voids). The other description starts from the dodecahedral cages, which connect one another through the 16i site forming a scaffold structure with vacancies at the 6c site, and the tetrakaidecahedral cages would appear once these vacancies are filled with host atoms. The latter approach may help to explain the preference for vacancies and lower valence substitution elements (lower than the valence of the group 14 elements) on the 6c site.21 It has been shown by early researches that direct bonds between lower valence elements are energetically unfavored, therefore the maximum occupancy factor (
n, to form both dodecahedral cages and tetrakaidecahedral cages. Generally, there are two ways to describe the framework structure. One was suggested by Demkov et al.32 that the tetrakaidecahedral cages are joined together through their hexagonal faces to form pillars, which are arranged to construct the final structure (dodecahedral cages are the remained voids). The other description starts from the dodecahedral cages, which connect one another through the 16i site forming a scaffold structure with vacancies at the 6c site, and the tetrakaidecahedral cages would appear once these vacancies are filled with host atoms. The latter approach may help to explain the preference for vacancies and lower valence substitution elements (lower than the valence of the group 14 elements) on the 6c site.21 It has been shown by early researches that direct bonds between lower valence elements are energetically unfavored, therefore the maximum occupancy factor (![[thin space (1/6-em)]](https://www.rsc.org/images/entities/char_2009.gif) f) of the lower valence elements on each site can be derived to be: f(6c) < 100%, f(16i) < 50%, f(24k) < 50%, f(6c + 24k) < 100% and f(16i + 24k) < 50%.21 By applying the above principles under the Zintl Klemm concept, the number of substitution elements as well as their occupancy factors on each site can be roughly analysed. However, this is not enough for a clear understanding of the site occupancy character in the present study.
f) of the lower valence elements on each site can be derived to be: f(6c) < 100%, f(16i) < 50%, f(24k) < 50%, f(6c + 24k) < 100% and f(16i + 24k) < 50%.21 By applying the above principles under the Zintl Klemm concept, the number of substitution elements as well as their occupancy factors on each site can be roughly analysed. However, this is not enough for a clear understanding of the site occupancy character in the present study.
According to the structure parameters shown in Tables 4–6, the three framework sites are occupied differently for the compounds grown by different fluxes. In the case of BCG-In, the 6c site is fully occupied by Cu and In, while the other sites are uniformly occupied by Ge. During the structure refinement, any attempt of moving Cu/In to the 16i/24k site was failed. As for BCG-Sn, Cu substitutes Ge only on the 6c site, and Sn substitutes Ge only on the 24k site, Ge partially occupies the 6c and 24k sites and fully occupies the 16i site. The refinement with Sn on the 16i/6c site or Cu on the 16i/24k site was not successful. For BCG-Bi, the site occupancy factors are similar to that of BCG-Sn except that there is no Sn but a small mount of vacancies in the crystal lattice. It should be noted that, as the atomic form factors of Cu and Ge are similar, it is hard to distinguish them in the X-ray diffraction analyses, therefore the occupancy factor of Cu/Ge on the 6c site is set around 0.85/0.15, according to the EDS results.23
In order to interpret the site occupancy, we start from the crystal structure and especially focus on the tetrakaidecahedral cage. According to the distance from the cage center (the guest 6d site) to the cage atoms, there are four different atoms on the tetrakaidecahedral cage: 6c, 16i, 24k(1) and 24k(2) as shown in Fig. 1, in another word, there are four different cage radii. Fig. 3 shows the cage radii as well as their ratio to the lattice constant as a function of the lattice constant. 24k(1), which is on the six-member ring, is the nearest site from the center, while 24k(2) is the farthest. The cage radii Ri(i = 1, 2, 3, 4) increase monotonically with the increase of their lattice constants. Distortions are observed for atoms on the 16i and 24k sites, especially the 24k site. There are two trends for the distortion. One is shown by the dashed lines in Fig. 3(b), along which the compounds are composed of different frameworks (Si-, Ge- or Sn-based framework), an enhancement of the lattice constant would lead to a faster increase of R3 and R4 while a slower increase of R1. This indicates that large host atoms tend to make the framework an ellipsoid (anisotropic) while small host atoms tend to make it a ball (isotropic). We can test this idea by taking Ba8Ga16Si30 (BGSi), BGG and BGSn as examples. The other trend is shown by the empty symbols with cross inside for NS, KS and BS with the same Si-based framework. As the lattice constant increases, R1, R3 and R4 show an opposite trend of changes from the trend 1, which is shown by dashed lines. This reveals that large guest atoms tend to make the framework a ball, while small guests tend to make it an ellipsoid. In addition, previous report showed that the distortion of each site can also be examined by bond angle.18 The bond angle around the 6c site is the closest to the angle of the regular tetrahedron, while the bond angle around the 24 site has the largest deviation. (One can refer to the CIF for details in the ESI†)
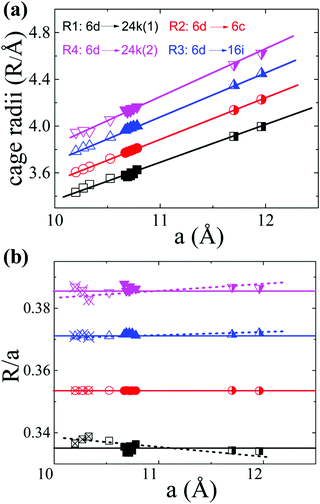 | ||
| Fig. 3 The tetrakaidecahedral cage radii of different type-I clathrates. (a) The relationship between the cage radii and the lattice constant. (b) The ratio of the cage radii to their lattice constant as a function of the lattice constant. Empty symbols represent Si-based clathrate, filled symbols represent Ge-based clathrate and half-filled symbols represent Sn-based clathrate. The empty symbols with cross inside are those compounds with the same Si-framework but different guest atoms: Na8Si46 (NS), K8Si46 (KS) and Ba8Si46 (BS). Lines are guides for the eyes. The lattice parameters and structure information are take from ref. 4, 33, 34, 35 and 36] except the data of BCG's. | ||
Based on the above discussions, the preferential occupancy on each site for BCG's can be well analysed. For the substitution of Ge by a small amount of Sn, the mismatch of the covalent radii would create a local disorder, therefore the 24k site where distortions are frequently observed is most suitable for Sn. This is what we observed for BCG-Sn as shown in Table 4. For Cu substitution, it is energetically favored to occupy the 6c site as reported previously.18,37 An alternative explanation is given here based on the Ri. According to the geometry of the tetrakaidecahedral cage, the 24k(1) and 6c sites are the closest to the guest atom at 6d site (electron donor), in principle lower-valence elements like Cu and vacancies, which behave like electron acceptors, should prefer to occupy the two sites for an easy charge transfer. However 24k(1) and 24k(2) are crystallographically the same site, and R4 (the distance between the 6d site and 24k(2) site) is the longest cage radius, the averaged distance from 24k to 6d is farther than that from 6c to 6d. Therefore 6c site would be more favored for lower valence elements or vacancies. The situation for In substitution is slightly complicated: on one hand, the lower valence In should occupy the 6c site; while on the other hand, due to the size mismatch of In and Ge, In should occupy the 24k site. It seems that In on the 6c site gives a more stable structure, because the refinement with In on the other two sites was failed.
Comparing to other type-I clathrates, the framework structure of BCG is relatively more ordered, because the substitution element (Cu) prefers to occupy 6c site and the number of Cu is close to 6 (a full occupation of the 6c site). In particular for BCG-In, where the 6c site is full occupied by Cu and In, leaving the other two sites fully and uniformly occupied by Ge. As to BCG-Bi, vacancies have been observed on the framework, and this is a common problem for Ge-based ternary clathrates, possibly inherited from the mother compound Ba8Ge43.18,21,38 The slightly larger ADP values for BCG-Bi may indicate a structure disorder. For BCG-Sn, Sn on the 24k site may also create a small local disorder. It will be shown later that the framework structure is closely associated with the electrical transport properties in type-I clathrate, and it can be visualized by the single crystals work in the present study.
Electronic band structure
Band structure calculations were performed based on the experimental obtained crystal structure using the same method as we did in our previous report.23Fig. 4 shows the calculation results for different Cu containing clathrates, where Cu and In are on the 6c site and Sn is on the 24k site. The results are consistent with the Zintl concept that Ba8Cu6Ge40 is a p-type compound, Ba8Cu5Ge40Sn1 is an n-type compound and Ba8Cu5Ge40In1 is an intrinsic semiconductor. The overall band features for the three cases are not quite different, especially that the lowest conduction bands are almost identical. Therefore, if the Fermi level are located at similar positions of the conduction band (n-type with similar carrier concentrations), the three compounds should show similar electrical properties.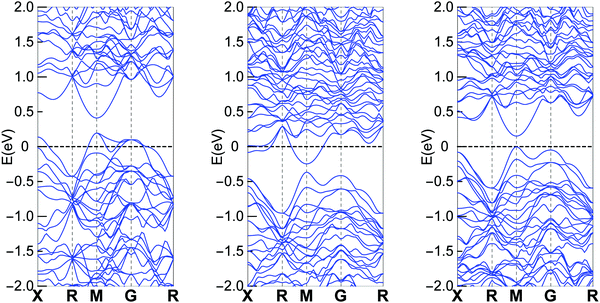 | ||
| Fig. 4 Band structure of Ba8Cu6Ge40 (left), Ba8Cu5Ge40Sn1 (middle) and Ba8Cu5Ge40In1 (right). Part data of Ba8Cu6Ge40 and Ba8Cu5Ge40Sn1 were published in our previous report.23 | ||
Carrier concentration and electrical transport properties
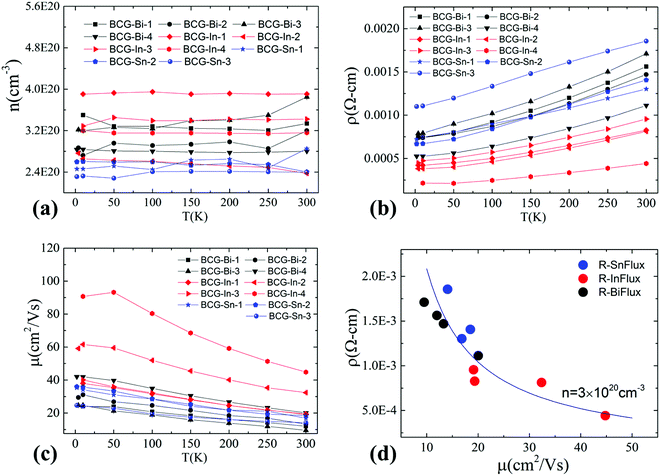
Hall resistivity measurements show that all the BCG single crystals are n-type. The carrier concentration from 2 K to 300 K, derived from the Hall coefficient using a single band model, is shown in Fig. 5(a), and it is almost temperature independent. Interestingly, the three compounds have the same carrier type and a similar conduction band (Fig. 4) with a similar density of carriers, therefore, as we mentioned earlier, they shall behave similarly in electrical properties, unless some extrinsic factors such as grain boundary and structure disorder may exert a large influence. The electrical resistivity of BCG compounds is shown in Fig. 5(b), where all the compounds give a metallic conduction behavior. The electrical mobility was derived using μ = 1/neρ and the result is given in Fig. 5(c). It is shown that the mobility decreases as temperature increases, and the behavior demonstrates that the electron scattering process is dominated by electron–phonon scattering. A small influence from ionic impurity scattering was observed below 50 K for BCG-In compounds, possibly because the electron–phonon scattering weakens at that low temperatures. It should be noted that the electrical resistivity is mainly controlled by the electrical mobility via ρ = 1/neμ for these compounds as shown in Fig. 5(d), because the values of n are quite close for these samples.Fig. 6 shows the RT electrical mobility obtained in the present study as well as from literatures17,39 for comparison. Our single crystals have much higher electrical mobility, especially for BCG-In compounds. A value of 44.8 cm2 V−1 s−1, which is almost the highest value at this carrier concentration and 300 K, was obtained. According to effective mass approximation, electrical mobility can be written as μ = eτ/m*, where τ is the electron scattering relaxation time and m* is the electron effective mass. A large mobility can be obtained via a small m* or a large τ. The band structure (Fig. 4) shows that the effective masses of BCG-In, BCG-Sn and BCG-Bi should be similar (it will be shown in the next section that the effective masses are indeed similar), so the difference of the mobility in Fig. 6 is merely the result of the difference of τ for each sample. According to Matthiessen's rule, τ can be expanded as, τtot−1 = τph−1 + τdefect−1 + τimpurity−1 + τboundary−1, where τph, τdefect, τimpurity and τboundary are the relaxation times due to electron–phonon scattering, electron-defect scattering, electron-impurity scattering and electron-boundary scattering, respectively. For polycrystal compounds, conduction electrons suffer a lot of grain-boundary scattering, so they show much lower mobilities.17,39 In type-I clathrate, electrons also suffer a lot of point-defect scattering due to the structure disorder, and the electrical mobility is largely restricted.12,14,40 It was discussed earlier that structure disorder might be minimized in BCG, because the 6c site is almost fully occupied by Cu, leaving the 24k and 16i sites uniformly occupied by Ge. This could be the reason that we observed high mobilities for our BCG single crystals grown out of metal fluxes. In particular, BCG-In has the highest mobility and most ordered framework structure. It will be shown later that the high electrical mobility will be very significant for improving thermoelectric performance.
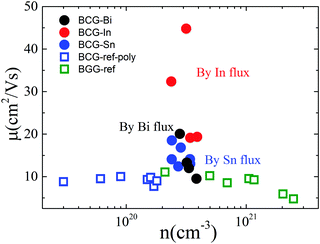 | ||
| Fig. 6 The relationship of electrical mobility and carrier density at 300 K. The empty symbols are the data from ref. 17 and 39 for BCG and BGG compounds. | ||
Heat capacity
The heat capacity data of BCG compounds are shown in Fig. 7, where low-energy excitation peaks arising from guest-atom vibrations can be clearly seen. Generally, guest atoms are modeled as Einstein oscillators while the framework atoms are treated as the Debye oscillators. By applying the Einstein and Debye models on solids with two Einstein temperatures (θE1 and θE2) and one Debye temperature (θD), the heat capacity data with low-energy excitation peaks (Fig. 7(a)) can be well fitted. The fitting method has been described in details in our previous report.31 The fitting parameters are given in Table 7. The Einstein temperatures of BCG-In are a little bit smaller than those of other BCG compounds, this is most likely the result of the larger size of BCG-In (Table 2).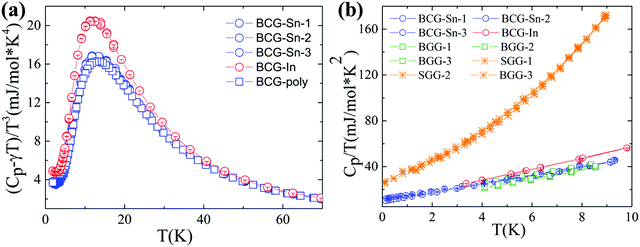 | ||
| Fig. 7 Heat capacity data of BCG-In and BCG-Sn single crystals as well as BCG polycrystals. (a) (Cp − γT)/T3vs. T plot, where γT is the temperature linear dependent heat capacity contributed from conduction carriers. (b) Cp/T vs. T2 plot below 3 K, for comparison, the data of BGG and SGG are also included.13 | ||
| Sample | θ E1/K | θ D/K | θ E2/K | γ/mJ mol−1 K−2 | γ free-e/mJ mol−1 K−2 | m*/me |
|---|---|---|---|---|---|---|
| BCG-Sn1 | 58 | 284 | 95 | 10.14 | 7.74 | 1.31 |
| BCG-Sn2 | 58 | 284 | 95 | 11.27 | 7.90 | 1.43 |
| BCG-Sn3 | 58 | 284 | 95 | 9.81 | 7.29 | 1.34 |
| BCG-In | 54 | 264 | 90 | 8.78 | 7.31 | 1.20 |
| BCG-poly | 58 | 284 | 95 | — | — | 1.0–1.217 |
The above non-linear fitting based on the quasi-harmonic model indicates that BCG compounds do not show large anharmonicity of the guest-atom vibrations. Under the harmonic model, heat capacity (Cp) of solids can be expressed as, Cp = γT + DT3 below 3 K. Here γT is the temperature linear dependent heat capacity due to conduction carriers or tunneling states,13 and DT3 is the heat capacity described by the Debye T3 law. According to Fig. 7(b), γ can be derived from the intercept in the linear fitting, and the values are listed in Table 7. The values of γfree-e, calculated by using the free electron model: γfree-e = kB2me(3π2n)1/3/(3ħ2), are also given in the table for comparison. In the above equation, kB is the Boltzmann constant, ħ is the reduced Planck constant, me is the free electron mass, and n is the carrier concentration. Effective mass of conduction carriers (m*) was calculated by γ/γfree-e. As mentioned earlier, the m*'s of BCG-In and BCG-Sn are indeed similar, and the values are also very close to the values of reported BCG and BGG compounds.13,17
Thermoelectric properties
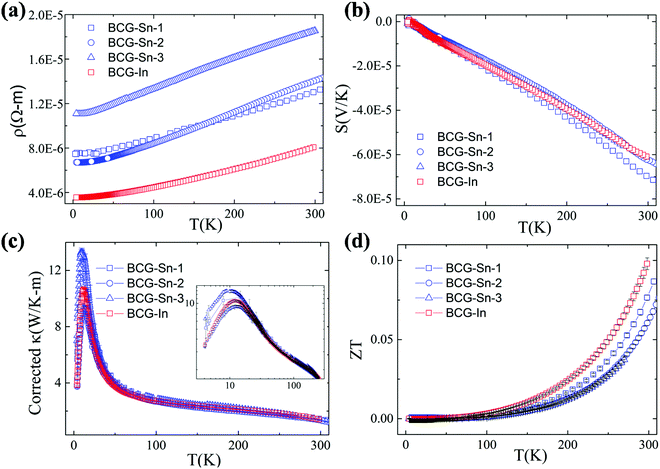
Thermoelectric parameters (ρ, S, κ and ZT) as a function of temperature are shown in Fig. 8. The error bars, from several measurements, are also shown in Fig. 8. The negative Seebeck coefficients indicate that the compounds are of n-type conduction, which is in agreement with the Hall measurements described earlier. The Seebeck coefficients of the compounds in the present work are very close, because the samples have a similar n as well as a similar m*. Under the effective mass approximation, it is possible to write S as, | (1) |
From the linear fitting of the temperature dependent S, m* was derived to be 1.43me, 1.39me, 1.31me, and 1.41me for BCG-Sn1, BCG-Sn2, BCG-Sn3, and BCG-In, respectively. These values are very close to the values calculated from heat capacity, as shown in Table 7. All BCG compounds show very low κ as a result of the rattling phonon modes of the guest atoms. Radiation losses were observed at around RT and they were empirically corrected by referring to the data in our previous report.23 The figure of merit ZT was calculated using ZT = (S2σ/κ)T, and the result is shown in Fig. 8(d). The highest ZT value, which achieves 0.1 at 300 K, is much higher than the values of reported polycrystals.17 It will be shown in the following part that the high ZT values are achieved mainly due to the high electrical mobility of the BCG single crystals.
We start from the n dependent thermoelectric parameters at 300 K as shown in Fig. 9. The Seebeck coefficient decreases monotonically as n increases in accordance with S ∝ Tm*n−2/3. The monotonic behavior of S(n) indicated by the fitting curves in Fig. 9(a) demonstrates that the m* of BCG and BGG are very close to each other. It is obvious that S is not sensitive to μ for the compounds in the present study. However, PF, which can be expressed by PF = S2σ = S2neμ, should be strongly dependent on μ. As shown in Fig. 9(b), the PF's of our single crystals is much higher than the previous reported data.14,17,39 In the marked region, where the variation of n is very small, the influence of other factors except n is obvious, and the influence is mainly due to μ.
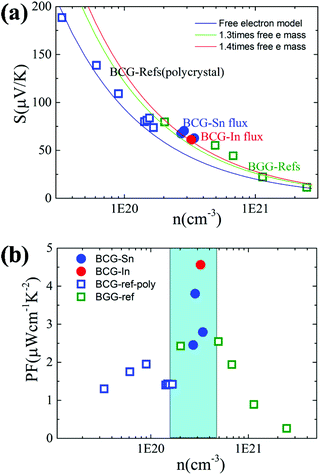 | ||
| Fig. 9 (a) The relationship between S and n at 300 K. The fitting curves were made under the effective mass approximation with different effective masses. (b) The relationship between PF and n at 300 K. The data of BGG and BCG polycrystals are taken from ref. 14, 17 and 39. | ||
In order to derive the relationship between PF and μ, the samples were cut into small pieces after thermal transport measurements, and μ for each piece was deduced by electrical transport measurements. For one sample, each piece shows different μ, therefore the averaged μ with error bars was applied for the following analyses. As shown in Fig. 10, PF increases almost linearly as μ increases, which is consistent with the simple model in the metallic limit under the effective mass approximation,
 | (2) |
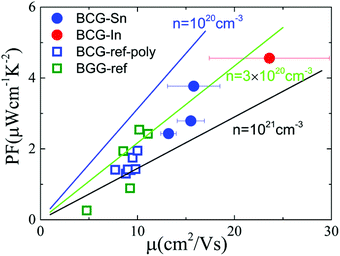 | ||
| Fig. 10 The influence of μ on thermoelectric parameters. (a) The relationship between PF and μ at 300 K. The linear lines were plotted under the effective mass approximation with m* = 1.3. (b) The relationship between nS2 and μ at 300 K. The thick arrows are the guides for the eyes. The error bar of μ arises from the inhomogeneity of the sample in the thermal transport measurement. The data of BGG and BCG polycrystals are taken from ref. 14, 17 and 39. | ||
As shown in eqn 2, PF can be enhanced through m*, n, and μ, which correlates with each other. Normally, m* is decided by the band structure. n is widely used to tune thermoelectric properties through doping. And μ is affected by different scattering. For n-type clathrate single crystal, the disorder in the cage framework might be most important for μ. As can be seen in Tables 4 and 5, BCG-In is less disorder in 24k sites, which gives a high μ. Accordingly, if less disorder is found in 6c sites, a higher μ might be obtained, leading to better thermoelectric performance.
Conclusion
Single crystals of Cu containing clathrates (BCG-In, BCG-Sn, and BCG-Bi) were successfully synthesized by using different metal fluxes. The selected compounds were characterized by powder and single crystal X-ray diffraction measurements, SEM-EDS measurements, and physical properties measurements. A small amount of Sn was observed on the 24k site for BCG-Sn, and a small amount of In was observed on the 6c site for BCG-In, while no Bi was observed for BCG-Bi. The origin of host site preference was discussed. As a result of the high crystal quality and the ordered cage framework, the compounds in the present study showed very high electrical mobility: 44.8 cm2 V−1 s−1 at 300 K for BCG-In, almost five times higher than the reported values of BCG polycrystals at the same carrier concentration. High electrical mobility was shown to enhanced the thermoelectric power factor, PF, as well as the figure of merit, ZT, which was derived to be 4.6 μW cm−1 K−2 and 0.1, respectively, for the BCG-In compound at 300 K. Our results did not only provide a guideline for optimizing ZT via μ in type-I clathrates, but also showed that Sn-, In-, and Bi-flux could be widely applied to grow single crystals of other transition elements containing clathrates.Conflicts of interest
There are no conflicts to declare.Acknowledgements
J. W. thanks MEXT for their promotion of student education through the IGPAS program and AIMR for the financial support. J. X. acknowledges the financial support by the Natural Science Foundation of Ningbo (NSFC No. 2019B10137).References
- Thermoelectrics Handbook, ed. D. M. Rowe, CRC Press, Taylor & Francis Group, 2006 Search PubMed.
- A. Saramat, G. Svensson, A. E. C. Palmqvist, C. Stiewe, E. Mueller, D. Platzek, S. G. K. Williams, D. M. Rowe, J. D. Bryan and G. D. Stucky, J. Appl. Phys., 2006, 99, 023708 CrossRef.
- T. Takabatake, K. Suekuni, T. Nakayama and E. Kaneshita, Rev. Mod. Phys., 2014, 86, 669–716 CrossRef CAS.
- J. Wu, J. Xu, D. Prananto, H. Shimotani, Y. Tanabe, S. Heguri and K. Tanigaki, Phys. Rev. B: Condens. Matter Mater. Phys., 2014, 89, 214301 CrossRef.
- The Physics and Chemistry of Inorganic Clathrates, ed. G. S. Nolas, Springer, Netherlands, 2014 Search PubMed.
- J. L. Cohn, G. S. Nolas, V. Fessatidis, T. H. Metcalf and G. A. Slack, Phys. Rev. Lett., 1999, 82, 779–782 CrossRef CAS.
- M. Christensen, A. B. Abrahamsen, N. B. Christensen, F. Juranyi, N. H. Andersen, K. Lefmann, J. Andreasson, C. R. H. Bahl and B. B. Iversen, Nat. Mater., 2008, 7, 811–815 CrossRef CAS.
- S. Pailhès, H. Euchner, V. M. Giordano, R. Debord, A. Assy, S. Gomès, A. Bosak, D. Machon, S. Paschen and M. de Boissieu, Phys. Rev. Lett., 2014, 113, 025506 CrossRef.
- T. Tadano, Y. Gohda and S. Tsuneyuki, Phys. Rev. Lett., 2015, 114, 095501 CrossRef.
- S. M. Dresselhaus, G. Chen, M. Y. Tang, R. Yang, H. Lee, D. Wang, Z. Ren, J.-P. Fleurial and P. Gogna, Adv. Mater., 2007, 19, 1043–1053 CrossRef.
- M. G. Kanatzidis, Chem. Mater., 2010, 22, 648–659 CrossRef CAS.
- H. Zhang, H. Borrmann, N. Oeschler, C. Candolfi, W. Schnelle, M. Schmidt, U. Burkhardt, M. Baitinger, J.-T. Zhao and Y. Grin, Inorg. Chem., 2011, 50, 1250–1257 CrossRef CAS.
- J. Xu, J. Tang, K. Sato, Y. Tanabe, H. Miyasaka, M. Yamashita, S. Heguri and K. Tanigaki, Phys. Rev. B: Condens. Matter Mater. Phys., 2010, 82, 085206 CrossRef.
- S. Johnsen, A. Bentien, G. K. H. Madsen, M. Nygren and B. B. Iversen, Phys. Rev. B: Condens. Matter Mater. Phys., 2007, 76, 245126 CrossRef.
- X. Shi, J. Yang, S. Bai, J. Yang, H. Wang, M. Chi, J. R. Salvador, W. Zhang, L. Chen and W. Wong-Ng, Adv. Funct. Mater., 2010, 20, 755–763 CrossRef CAS.
- M. Hokazono, H. Anno and K. Matsubara, Mater. Trans., 2005, 46, 1485–1489 CrossRef CAS.
- S. Johnsen, A. Bentien, G. K. H. Madsen, B. B. Iversen and M. Nygren, Chem. Mater., 2006, 18, 4633–4642 CrossRef CAS.
- E. Alleno, G. Maillet, O. Rouleau, E. Leroy, C. Godart, W. Carrillo-Cabrera, P. Simon and Y. Grin, Chem. Mater., 2009, 21, 1485–1493 CrossRef CAS.
- X. Yan, M. Ikeda, L. Zhang, E. Bauer, P. Rogl, G. Giester, A. Prokofiev and S. Paschen, J. Mater. Chem. A, 2018, 6, 1727–1735 RSC.
- X. Yan, E. Bauer, P. Rogl, J. Bernardi, A. Prokofiev and S. Paschen, Z. Anorg. Allg. Chem., 2020, 646, 1055–1061 CrossRef CAS.
- M. Christensen, S. Johnsen and B. B. Iversen, Dalton Trans., 2010, 39, 978–992 RSC.
- M. Ikeda, X. Yan, L. Prochaska, G. Lientschnig, R. Svagera, M. Waas, P. Tomes, A. Prokofiev, E. Bauer and S. Paschen Thermal conductivity of transition metal containing type-I clathrates. Symposium S/W/CC - Advanced Materials for Photovoltaic, Fuel Cell and Electrolyzer, and Thermoelectric Energy Conversion. 2015.
- J. Xu, J. Wu, H. Shao, S. Heguri, Y. Tanabe, Y. Liu, G. Liu, J. Jiang, H. Jiang and K. Tanigaki, J. Mater. Chem. A, 2015, 3, 19100 RSC.
- A. C. Larson and R. B. Von Dreele, Los Alamos Natl. Lab., 1994, 86, 748 Search PubMed.
- B. H. Toby, J. Appl. Crystallogr., 2001, 34, 210–213 CrossRef CAS.
- L. J. Farrugia, J. Appl. Crystallogr., 2012, 45, 849–854 CrossRef CAS.
- G. Kresse and J. Furthmüller, Phys. Rev. B: Condens. Matter Mater. Phys., 1996, 54, 11169–11186 CrossRef CAS.
- G. Kresse and D. Joubert, Phys. Rev. B: Condens. Matter Mater. Phys., 1999, 59, 1758–1775 CrossRef CAS.
- J. P. Perdew, K. Burke and M. Ernzerhof, Phys. Rev. Lett., 1996, 77, 3865–3868 CrossRef CAS.
- K. Suekuni, M. A. Avila, K. Umeo, H. Fukuoka, S. Yamanaka, T. Nakagawa and T. Takabatake, Phys. Rev. B: Condens. Matter Mater. Phys., 2008, 77, 235119 CrossRef.
- J. Wu, K. Akagi, J. Xu, H. Shimotani, K. K. Huynh and K. Tanigaki, Phys. Rev. B, 2016, 93, 094303 CrossRef.
- A. A. Demkov, O. F. Sankey, K. E. Schmidt, G. B. Adams and M. O'Keeffe, Phys. Rev. B: Condens. Matter Mater. Phys., 1994, 50, 17001–17008 CrossRef CAS.
- O. O. Kurakevych, T. A. Strobel, D. Y. Kim, T. Muramatsu and V. V. Struzhkin, Cryst. Growth Des., 2013, 13, 303–307 CrossRef CAS.
- S. Stefanoski and G. S. Nolas, Cryst. Growth Des., 2011, 11, 4533–4537 CrossRef CAS.
- S. Yamanaka, E. Enishi, H. Fukuoka and M. Yasukawa, Inorg. Chem., 2000, 39, 56–58 CrossRef CAS.
- A. Bentien, E. Nishibori, S. Paschen and B. B. Iversen, Phys. Rev. B: Condens. Matter Mater. Phys., 2005, 71, 144107 CrossRef.
- K. Moriguchi, S. Munetoh, A. Shintani and T. Motooka, Phys. Rev. B: Condens. Matter Mater. Phys., 2001, 64, 195409 CrossRef.
- U. Aydemir, C. Candolfi, H. Borrmann, M. Baitinger, A. Ormeci, W. Carrillo-Cabrera, C. Chubilleau, B. Lenoir, A. Dauscher, N. Oeschler, F. Steglich and Y. Grin, Dalton Trans., 2010, 39, 1078–1088 RSC.
- H. Anno; M. Hokazono; M. Kawamura and K. Matsubara, Effect of transition element substitution on thermoelectric properties of semiconductor clathrate compounds. Thermoelectrics, 2003 Twenty-Second International Conference on – ICT, 2003, pp. 121–126.
- B. Du, Y. Saiga, K. Kajisa and T. Takabatake, Chem. Mater., 2015, 27, 1830–1836 CrossRef CAS.
Footnote |
| † Electronic supplementary information (ESI) available. See DOI: 10.1039/d0ma00721h |
| This journal is © The Royal Society of Chemistry 2020 |

