 Open Access Article
Decoupled ion mobility in nano-confined ionic plastic crystal†
Haijin
Zhu
 *ab,
Aleksandra
Grzelak
ab,
Ruhamah
Yunis
 c,
Jaime
Martín
 de and
Maria
Forsyth
 abd
abd
aInstitute for Frontier Materials, Deakin University, Geelong, VIC 3216, Australia. E-mail: h.zhu@deakin.edu.au
bARC Centre of Excellence for Electromaterials Science, Deakin University, 221 Burwood Highway, Burwood, Victoria 3125, Australia
cCentre for Materials Science, School of Chemistry and Physics, Queensland University of Technology, 2 George Street, Brisbane, Queensland 4000, Australia
dPOLYMAT and Polymer Science and Technology Department, Faculty of Chemistry, University of the Basque Country UPV/EHU, Manuel de Lardizabal 3, 20018 Donostia-San Sebastian, Spain
eIkerbasque, Basque Foundation for Science, 48013 Bilbao, Spain
First published on 9th November 2020
Abstract
Nanoconfined ions have dramatically different local environments compared to the bulk, which profoundly affects the ion solvation and transport properties taking place in the confined space. Herein, we investigate the rotational and translation mobility of both cation and anions of an OIPC (diethyl)(methyl)(isobutyl)phosphonium hexafluorophosphate) confined in 40 and 180 nm straight-through Al2O3 pores. The results revealed that the nanoconfined OIPC exhibit 44 times higher ionic conductivity than the bulk material at 30 °C. This enhancement is attributed to both the reduced tortuosity and the increased population of mobile species. More interestingly, the Al2O3 nanochannels were found to selectively enhance the rotation and translational motion of [P122i4] cation at elevated temperatures, whilst leaving that of the [PF6] anion less affected.
1. Introduction
The ever increasing safety and stability concerns associated with organic solvent based liquid electrolytes have encouraged the use of all-solid materials for electrochemical device applications. Despite the tremendous efforts in both industry and academia dedicated to developing solid electrolytes using inorganic salts, ceramics, polymers, and their composites, most of these materials suffer from a significantly lower conductivity compared to the liquid electrolytes. A fully hydrated Nafion®, for example, can easily achieve conductivity of >10−1 S cm−1,1 whereas hardly any polymer electrolyte can achieve a bulk conductivity (without solvent) of the order of 10−3 S cm−1 at room temperature.2Organic ionic plastic crystals (OIPCs) represent a unique family of solid materials with demonstrated applications as solid-state electrolytes for lithium and sodium ion batteries,3,4 fuel cells,5,6 and dye-sensitized solar cells.7–9 OIPCs typically consist of a bulky organic cation coupled with a highly symmetric anion.10 The relatively large size and high symmetry of ions give rise to a balance in interionic interactions, which are strong enough to maintain the long-range crystalline lattice structure, yet weak enough to allow local molecular rotation and tumbling in their solid plastic crystal phases.10 These fast local molecular motions, as well as the associated structural disorder, not only can induce fast-ion transport of doped target ions such as Li+,4 Na+,11 H+,12 but also confer the material with good mechanical ductility, allowing a tight and durable contact between electrolyte and the electrodes.13
Since the very first ammonium-based OIPCs reported in the 1980s by Nakamura and coworkers,14,15 many new OIPC families have been discovered and applied in various devices, including the first demonstration of OIPC in Na batteries recently.11,16 Nevertheless, the ionic conductivities of bulk OIPCs in their plastic crystal phases are moderate, roughly in the range of 10−6–10−4 S cm−1 depending on sample preparation and thermal history. These values are still typically 1–2 order of magnitudes lower than their ionic liquid relatives. On the other hand, the OIPC itself is often soft and waxy, thus a support is required to provide structural and mechanical integrity. For these considerations, various polymer matrices including PVDF,17,18 PEO,19 Poly(ionic liquid)s,20,21 as well as various inorganic fillers, e.g., TiO2,22 Al2O3,23 SiO223,24 have been introduced, aiming to increase mechanical strength and enhance the ionic conductivity simultaneously. Recent studies have shown that adding a second phase does not only provide a mechanical support, but also brings in an unique interface which had synergistic effect in boosting their ionic conductivities.25 Wang et al., demonstrated that co-electrospun OIPC composites comprised of between 5 and 20 wt% of [C2mpyr][BF4] combined with PVDF, had room temperature conductivity that was enhanced by 7-fold (compared to neat OIPC).25 The key mechanism for this conductivity enhancement was the disruption of crystallization and enhanced ion dynamics in the OIPC phase due to the ion–dipole interactions between OIPC and PVDF molecules. A maximum conductivity was found at 15 wt% OIPC loading, and further increasing OIPC leads to a sharp decrease in conductivity. This is attributed to the fact that the ion conduction took place only along a thin layer of (percolated) amorphous OIPC/PVDF interphase. At high OIPC loadings there will be more ordered OIPC present and thus the ion conduction will be ‘blocked’ by this crystalline OIPC phase. This is strongly supported by the DSC heating thermograms where no first-order transition was observed for the sample of 5–15 wt% OIPC loading, whereas the 20 wt% loading clearly showed peaks corresponding to crystalline OIPC phase.
An alternative strategy to increase the ionic conductivity of OIPCs is through the addition of nanoparticles. Adding nanosized TiO222 or SiO226 into [C2mpyr][TFSI] was found to increase ionic conductivity by approximately 1–2 orders of magnitude. An optimum concentration of 10 wt% was observed for these inorganic nanoparticle/OIPCs composites, which is similar to the optimum OIPC loading of 15 wt% for [C2mpyr] [BF4]/PVDF composites observed by Wang et al.25 These results therefore suggested a percolation-dominated ion conduction mechanism in these composites, although the positron annihilation lifetime spectroscopy (PALS) results suggested that the percolated mobile phase may not be merely a thin layer of OIPC molecules on the particle surfaces, but instead, an interface induced disorder region that extends to the bulk OIPC with a length scale of about 10 nm.26
In this study, we incorporate a well-known OIPC (diethyl)(methyl)(isobutyl)phosphonium hexafluorophosphate ([P122i4][PF6]),4,27–29 into hexagonal aligned straight-through Al2O3 nano pores with diameters of 40 and 180 nm. It is anticipated that the nanometer pore size provides a large surface-to-bulk ratio and boosts NMR signals from the interphase region, allowing us to probe ion transport phenomenon within the interphases. Secondly, using straight-through pores will also give unity (smallest) tortuosity for ion transport. The effects of nano-confinement on the rotational and translational mobility of both cation and anion are investigated. We found that the cation and anion exhibit decoupled ion motilities, and each solid–solid phase transition is associated primarily with the onset of motions of either cation or anion, not both. The cation and anion transport behaviours within the 40 nm channels are compared to that in the bulk [P122i4][PF6] material, with particular emphasis on the effect of tortuosity and surface interactions between ionic species and the Al2O3 walls.
2. Experimental
2.1 Sample preparation
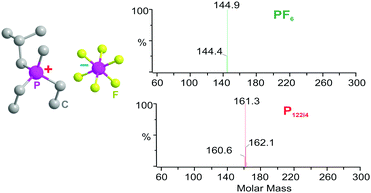
The mesoporous Al2O3 membranes with 40 and 80 nm through-pores were purchased from Smartmembranes GmbH Germany. The [P122i4][PF6] OIPC was synthesized following the procedures described elsewhere.30 The OIPC was purified by crystallization from a mixture of ethyl acetate and methanol. The molecular structure is shown in Fig. 1, and the chemistry of the synthesized material and the purity were confirmed by mass spectroscopy, 1H, 13C, 19F NMR and ICP-MS (residual potassium contents). The cation and anion were identified in the mass spectrum as shown in Fig. 1. The composite material was prepared by melting the [P122i4][PF6] into nanopores on a 160 °C hot stage. The excess of OIPC material was wiped out carefully with a doctor blade. Specifications of the membranes and the composites are summarized in Table 1. As shown, the porosity for the 40 and 180 nm membranes, as calculated by , are 8 vol% and 11 vol%, respectively. The volume percentages of the experimentally loaded OIPC, which were calculated from the weight difference between the empty and loaded membranes, are 10 vol% and 14 vol% respectively, slightly larger than the porosity of the membranes. This suggest an excess of OIPC material remained on the membrane surface, which is beneficial for a good contact with electrodes during conductivity measurements. For the ease of discussion, the neat [P122i4][PF6] and the composites with 40 nm and 180 nm Al2O3 membranes will be referred as neat, 40 nm and 180 nm in the following text.
2.2 Ionic conductivity, SEM and DSC characterisations
Ionic conductivity was measured using a Solartron FRA 1296 -frequency response analyser, supported by Solartron software. The neat [P122i4] [PF6] was pressed into a pellet with thickness of 1 mm and diameter of 13 mm. The neat OIPC pellet and composite membranes were placed between two stainless steel electrodes for conductivity measurements. Data were collected over a frequency range from 10 MHz to 1 Hz using a signal voltage of 0.1 V. A heating–cooling–heating temperature program was applied between 20–160 °C with a step of 10 °C. The samples were left to equilibrate for 10 min at each temperature. A ZEISS SUPRA 55VP FEG scanning electron microscope was used to characterize the surface morphology. The acceleration voltage was 3 kV. The same samples after EIS measurements were coated with Au and then submitted for SEM examination. The DSC measurements were performed on a Netzsch DSC (214 polyma). About 6–10 mg of the samples was sealed in an aluminum sample pan in the glovebox. A three-step heating–cooling–heating program between temperature range of −10–160 °C was applied, with a heating and cooling rate of 10 °C min−1.2.3 Solid-state and pulse field gradient (PFG) NMR
Static 1H, 19F and 31P NMR were performed on a 500 MHz Bruker Avance III wide-bore solid state NMR spectrometer equipped with a 5 mm static double resonance probe. The alumina membrane sample was broken into small pieces and filled into a 4 mm ZrO2 MAS rotor which was then sealed with a ZrO2 cap in an Argon filled glovebox. The sealed rotor was transferred out of the glovebox and inserted into the sample chamber of the static probe for static powder pattern NMR experiments. The same rotors were used later for PFG-NMR experiments, which were performed on a 300 MHz Bruker Avance III widebore spectrometer equipped with a Diff50 diffusion probe. The maximum gradient strength of this probe is 29 T m−1. Diffusion time was varied between 8 ms and 400 ms in a log scale to probe the restricted diffusion behaviour. Sample temperature in the static NMR probe was calibrated with 207PbNO3 using the method described in the literature.31 The Diff50 probe temperature was calculated using the chemical shift separation between the OH and CH3 groups of dry methanol.323. Results and discussion
3.1 Morphology, thermal property and ion conduction
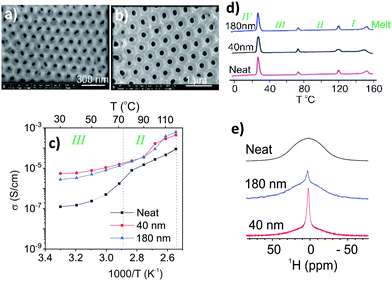
Fig. 2a and b present typical SEM surface images of the 40 nm and 180 nm raw Al2O3 membranes. As shown, the hexagonally aligned nanopores are highly ordered with a narrow size distribution. The ionic conductivities of 40 nm and 180 nm, as shown in Fig. 2c, are dramatically higher than the neat OIPC in phase II and III. This enhancement is particularly significant at lower temperatures. For example, the 40 nm pore confined OIPC shows conductivities of 4.5 × 10⁻⁴ and 5.5 × 10⁻⁶ S cm−1 at 120 and 30 °C, respectively, which are 5 and 44 times that of the neat OIPC. It is interesting to note that, while a sharp non-linear increase with temperature was observed upon phase III → II transition for neat OIPC, this behaviour was not as evident for the nanoconfined OIPCs, suggesting different ion conduction mechanisms. DSC traces of the neat OIPC show three distinct solid–solid transition peaks at about 25 °C, 72 °C, 120 °C, and a melting transition at 150 °C with a low entropy of fusion. These transitions are consistent with those reported previously.30 The 40 nm and 180 nm composites show very similar solid–solid transitions compared to the neat OIPC, except for the melting transition of 40 nm which was a bit broader. Note that the endothermic peaks in the DSC thermograms only characterize first-order transitions which occur in the crystalline region, while the differences in the amorphous or defect region are not reflected in these DSC curves. Solid state NMR lineshape analysis, on the other hand, is an extremely valuable analytical tool for assessing the molecular dynamics in both crystalline and amorphous regions.15,33 Indeed, static 1H NMR spectra in Fig. 2e suggest that the key factor that leads to higher conductivity of the nanoconfined OIPCs lies in the amorphous region in between the grain boundaries, which is consistent with previous MRI visualisation of an mobile amorphous grain boundary region with thickness of a few hundreds of nanometres.28,34 At 20 °C for example, neat OIPC shows a broad Gaussian line, with no sign of a narrow resonance observed. This agrees well with what has been reported in prior literature.30 The 180 nm sample clearly shows a sharp narrow line on top of a broad line, which hints at the existence of a fraction of mobile cation species. The 40 nm sample shows an even larger portion of these mobile cations, as indicated by the much stronger narrow line intensity.3.2 Tumbling and reorientation motion
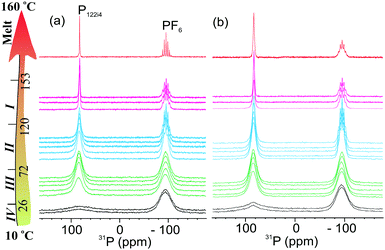
To further understand the effect of nanoconfinement on the local molecular motions of the OIPC ions, we performed a detailed multinuclear static NMR study on the 40 nm sample, which has a smaller pore size and consequently a larger surface area. An interesting feature of this OIPC is that both cation and anion contain a phosphorous nucleus which allows us to easily compare the line-narrowing behaviour between cation and anion in a single 31P spectrum. Fig. 3a shows progressive line narrowing of both cation and anion in neat OIPC with temperature. However, a close examination of the line narrowing behaviour revealed that the cation and anion exhibit very different solid-phase transition dependency. Upon IV → III transition, the cation lineshape narrowed significantly, whereas the anion line showed nearly no change. Upon III → II transition, the anion line narrowed sharply, exhibiting a feature of J-coupling spitting which is typically observed for liquid samples. The cation line, on the other hand only showed a gradual narrowing with temperature. Then II → I transition is featured by a sudden decrease in cation linewidth, whereas the anion line remained essentially unchanged. The final melting transition at about 153 °C leads to a sudden extreme narrowing for both cation and anion lines. These results strongly suggest a highly decoupled cation and anion dynamics throughout the entire solid phases, and each of the solid–solid transitions are mainly associated with the onset of motions in either cation or anion, but not both. More specifically, the IV → III transition at 26 °C, and II → I transition at 120 °C are associated with the cation, whereas the III → II transition at 72 °C is associated with the anion. Using this understanding, we may explain the extremely low phase III → II transition entropy of about 4 J K−1 mol−1, which might be related to the intrinsically high symmetry of the PF6 anion. The highly decoupled cation and anion dynamics is further confirmed by the static 1H NMR in Fig. 4, and the 19F static NMR in Fig. 5. For the neat OIPC sample, a sharp 1H line narrowing was observed over IV → III and II → I transitions, while a sharp 19F line narrowing was observed upon III → II transition.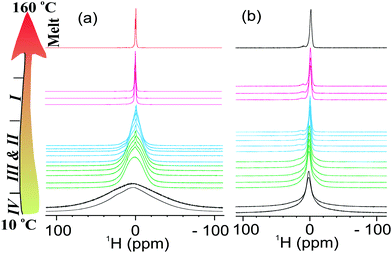 | ||
| Fig. 4 Stack plots of the variable temperature static 1H NMR spectra of cation in (a) neat OIPC and (b) 40 nm sample. The temperature was increased from 10 to 160 °C with a step of 10 °C. | ||
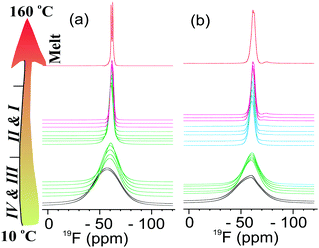 | ||
| Fig. 5 Stack plots of the variable temperature static 19F NMR spectra of anion in (a) neat OIPC and (b) the 40 nm sample. The temperature was increased from 10 to 160 °C with a step of 10 °C. | ||
The comparison of 1H spectra in Fig. 4 revealed significantly different cation mobilities between the 40 nm and neat OIPC. More specifically, a significant narrow component, which represents the mobile species, is superimposed on the broader 1H peak for the 40 nm sample, even at low temperatures (phase IV). However this narrow component was not observed for the neat sample till the temperature raised up to 40 °C. With further increasing temperature, only a tiny fraction (∼1 mol%) of this species presented till the temperature reaches phase I. Interestingly, the 19F spectra in Fig. 5, shows similar anion lineshapes in both samples in the studied temperature range. This indicates that the nanoconfinment affects the cation and anion mobility differently: the cation mobility is more enhanced relative to the anion mobility as a result of nano-confinement. This is highly consistent with our diffusion measurements where we also observed enhancement in cation diffusion, whereas the anion diffusion coefficients were very close to the neat sample, as will be discussed in the following Section 3.3. At 160 °C, both 1H and 19F spectra of the 40 nm sample showed broader lines compared to the neat OIPC, indicating restricted ion motilities in the melt state.
3.3 Translational motion
Ion diffusion is a key process that determines the conductivity of the materials, and this process is known to behave differently in a confined space than the bulk. In an infinitely large space, the diffusion coefficient of a particle is independent of diffusion time. In a confined space, however, the wall collisions cause the diffusion coefficient to reduce. The observed diffusion coefficient is a function of diffusion time, and the function varies for different pore sizes and geometry.35 For isolated pores, the diffusion coefficients approach zero when , where D0 is the diffusion coefficient, t is the diffusion time and d is the characteristic length of the closed space. For interconnected pores, the diffusion coefficient decreases with increasing diffusion time and reaches an asymptotic value D∞, D∞ = D0/α,36 where α is the tortuosity, α = 1 for a straight line and α = ∞ for a circle. In an ideal one dimensional nanochannel where the
  (d is the diameter of the channel), the diffusion is fully restricted in two directions that are perpendicular to the length of the channel, and is free along the length direction. Powder averaging of the diffusion in randomly oriented ion channels would result in an apparent diffusion coefficient
  ,37 where D0 is the diffusion coefficient we would obtain when all the channels are perfectly aligned with the direction of the magnetic field gradient.
As shown in Fig. 6(a) and (b), the diffusion coefficients of cation and anion in neat OIPC decrease with diffusion time, indicating a restricted diffusion within a confined space. This observation is consistent with the previous MRI study that showed the mobile ions are confined within a grain boundary phase with a characteristic thickness of a few hundreds of nanometres.34 The [PF6] anion shows systematically higher diffusion coefficients than the [P122i4] cation in the neat OIPC at all temperatures and diffusion times measured. The nanoconfined OIPC, on the other hand, showed constant diffusion coefficients with increasing diffusion time for both cation and anion, as shown in Fig. 6(c) and (d). This is because the size of the confined space of 40 nm is significantly smaller than the mean-square diffusion displacement  , which is estimated to be in the order of 1–5 μm. Therefore, the observed diffusion coefficient reached an asymptotic value D∞. Interestingly, the cation and anions show very similar diffusion coefficients in the nanoconfined sample, which is in stark contrast with the neat OIPC where a significantly higher anion diffusion is observed in this study, as well as the previous experimental28 and MD simulation38 studies. Note that the ionic diffusion in neat OIPC is time-dependent and the measured self-diffusion is underestimated because ions hit the walls of pores, thus direct comparison of the diffusion between neat and nanoconfined species is invalid. To obtain a time independent (free diffusion) coefficient, an extremely short diffusion time is required, which is not accessible by our instrument due to hardware limitations on the gradient strength as well as RF pulse lengths.
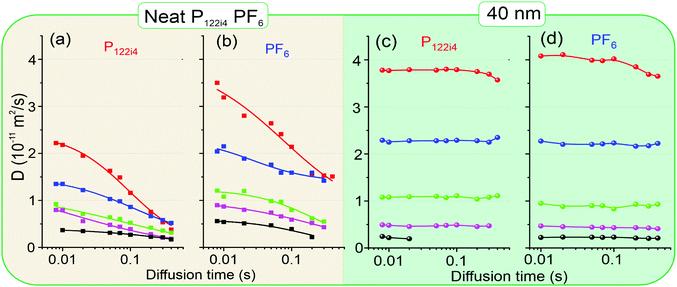 | ||
| Fig. 6 Time-dependent diffusion coefficients of the neat and 40 nm confined OIPC measured at variable temperatures, from top to bottom, red 90 °C, blue 80 °C, green 70 °C, purple 60 °C and black 50 °C. (a) [P122i4] cation diffusion in neat OIPC; (b) [PF6] anion diffusion in neat OIPC; (c) [P122i4] cation diffusion in 40 nm sample; (d) [PF6] anion diffusion in 40 nm sample. The dots represent experimental data points. The solid lines in (a) and (b) represent the best fit using Padé approximation (eqn (1)), whereas solid lines in (c) and (d) are drawn to guide the eyes only. To achieve a better reproducible thermal history, the temperatures were cooled down from 90 to 50 °C for all the experiments. | ||
The Padé approximation has been used to fit the experimental data,39,40 and to interpolate between short time limit (D0) and the long-time asymptotic limit D∞. This method uses an adjustable fitting parameter, θ, which has units of time and is expected to scale with the square of the pore size:
 | (1) |
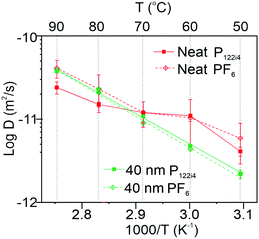
 is the surface to volume ratio of the confined space. Using this model to fit the experimental data shown in Fig. 6(a) and (b) allows us to estimate the free diffusion coefficients of cation and anion in neat OIPC, and the results are compared with the 40 nm confined OIPC in Fig. 7. Interestingly, at higher temperatures of 90 & 80 °C, the diffusion coefficients of [PF6] anion and [P122i4] cation confined in the 40 nm pores, as well as the [PF6] anion in neat OIPC are similar, whereas the [P122i4] cation of the neat OIPC shows notably lower diffusion. This result suggests that the cation diffusion, which was suppressed in neat OIPC, is enhanced in the nanoconfined sample, mostly likely due to the surface interactions between the ions and the Al2O3 walls. At lower temperatures of 50 and 60 °C, while the error of fitting is large due to the poor signal-to-noise ratio, it may still be valid to claim that the difference between the two samples is significant relative to the error. A clear plateau in the temperature region of 70–60 °C was observed for the neat OIPC sample, which corresponds to the phase II to III transition of the OIPC, and this discontinuity is also observed in the Arrhenius plot of conductivity of neat OIPC in Fig. 2(c). The nanoconfined sample, however, showed a typical Arrhenius diffusion behaviour in the studied temperature range, and fitting of the experimental results revealed an activation energy of 70 ± 4 and 72 ± 3 kJ mol−1 for the cation and anion, respectively.
It is worth noting that the diffusion coefficients of the 40 nm sample were measured in a powder sample where the nanochannels are randomly oriented in all possible directions. If the channels were aligned, which is the case for conductivity measurements, the obtained diffusion coefficient could be 3 times the observed diffusion coeffients shown in Fig. 6 and 7. The allignment dependency of the PFG-NMR measured diffusion coefficient due to the fact that the magnetic gradient is one dimensional: only the diffusion along the gradient direction is considered effective, whereas that perpendicular to the gradient is measured to be zero.41,42 This would mean systematically higher diffusion coefficients for both cation and anion in the nano-confined ion channels compared to the neat OIPC, and this enhancement is a direct consequence of using the nano-confined through pores. As discussed earlier, the conductivity enhancement at lower temperatures was way beyond 3 fold. At 30 °C for example, the enhancement was 44 times. This means that the alignment effect was not the only factor that contributes to the conductivity, other reasons such as enhancement in the population of mobile species, as evident from the static 1H NMR spectra in Fig. 4a, must have played a role. At 120 °C, on the other hand, the enhancement was 5 times, suggesting that the alignment of conduction pathways was one of the major factors that contribute to the ionic conductivity enhancements.
4. Conclusions
In this study, we investigated the effect of nano-confinement on the ion conduction, rotational dynamics and translational motions (diffusion) of an organic ionic plastic crystal (OIPC) material, [P122i4][PF6] in mesoporous Al2O3 membranes with hexagonally aligned through pores. Our multi-nuclear static NMR lineshape analysis suggested a highly decoupled cation and anion dynamics throughout the entire solid phases of [P122i4][PF6], and each solid-solid transition is primarily associated with onset of motions of one ion species. The phase IV → III transition at 26 °C, and phase II → I transition at 120 °C are mainly associated with the onset of motions of cation, whereas the phase III → II transition at 72 °C is associated with that of the anion. The nano-confinement affects the populations and dynamics of the mobile ions located in the amorphous or defect regions only, while leaving the crystalline regions less affected. The nanoconfined OIPC was found to exhibit 44 times higher ionic conductivity at 30 °C, and this was attributed to the combination of (1) alignment of ionic conduction pathways, and (2) significantly higher population of mobile species. At higher temperatures above 120 °C where all the ionic species become mobile, the alignment of conduction pathways becomes one of the major factors that contributes to the ionic conductivity enhancements. Last but not the least, the mesoporous Al2O3 substrate was found to selectively change the rotation and translational motion of [P122i4] cation, whereas leaving that of the [PF6] anion less affected.Conflicts of interest
There are no conflicts to declare.Acknowledgements
M. F. thanks the Ikerbasque foundation for a visiting professorial fellowship. The authors acknowledge the Australian Research Council for funding through CE140100012. Deakin University's advanced characterisation facility is acknowledged for use of the NMR instruments, funded through the ARC grant LE110100141. J. M. thanks MCIU for the Ramón y Cajal contract and the grant Ref. PGC2018-094620-A-I00. Authors would like to thank the financial support provided by the IONBIKE RISE project. This project has received funding from the European Union’s Horizon 2020 research and innovation programme under the Marie Skłodowska-Curie grant agreement No. 823989.References
- K. A. Mauritz and R. B. Moore, State of Understanding of Nafion, Chem. Rev., 2004, 104(10), 4535–4586 CrossRef CAS.
- D. Mecerreyes, Polymeric ionic liquids: Broadening the properties and applications of polyelectrolytes, Prog. Polym. Sci., 2011, 36(12), 1629–1648 CrossRef CAS.
- X. Wang, H. Zhu, G. W. Greene, Y. Zhou, M. Yoshizawa-Fujita, Y. Miyachi, M. Armand, M. Forsyth, J. M. Pringle and P. C. Howlett, Organic Ionic Plastic Crystal-Based Composite Electrolyte with Surface Enhanced Ion Transport and Its Use in All-Solid-State Lithium Batteries, Adv. Mater. Technol., 2017, 2(7), 1700046 CrossRef.
- L. Jin, P. C. Howlett, J. M. Pringle, J. Janikowski, M. Armand, D. R. MacFarlane and M. Forsyth, An organic ionic plastic crystal electrolyte for rate capability and stability of ambient temperature lithium batteries, Energy Environ. Sci., 2014, 7(10), 3352–3361 RSC.
- M. Díaz, A. Ortiz, J. M. Pringle, X. Wang, R. Vijayaraghavan, D. R. MacFarlane, M. Forsyth and I. Ortiz, Protic plastic crystal/PVDF composite membranes for Proton Exchange Membrane Fuel Cells under non-humidified conditions, Electrochim. Acta, 2017, 247, 970–976 CrossRef.
- J. Luo, A. H. Jensen, N. R. Brooks, J. Sniekers, M. Knipper, D. Aili, Q. Li, B. Vanroy, M. Wübbenhorst, F. Yan, L. Van Meervelt, Z. Shao, J. Fang, Z.-H. Luo, D. E. De Vos, K. Binnemans and J. Fransaer, 1,2,4-Triazolium perfluorobutanesulfonate as an archetypal pure protic organic ionic plastic crystal electrolyte for all-solid-state fuel cells, Energy Environ. Sci., 2015, 8(4), 1276–1291 RSC.
- A. Lennert, K. Wagner, R. Yunis, J. M. Pringle, D. M. Guldi and D. L. Officer, Efficient and Stable Solid State Dye Sensitized Solar Cells by Combination of Phosphonium Organic Ionic Plastic Crystals with Silica, ACS Appl. Mater. Interfaces, 2018, 10, 32271–32280, DOI:10.1021/acsami.8b12334.
- C. Shi, L. Qiu, X. Chen, H. Zhang, L. Wang and F. Yan, Silica Nanoparticle Doped Organic Ionic Plastic Crystal Electrolytes for Highly Efficient Solid-State Dye-Sensitized Solar Cells, ACS Appl. Mater. Interfaces, 2013, 5(4), 1453–1459 CrossRef CAS.
- D. Hwang, D. Y. Kim, S. M. Jo, V. Armel, D. R. MacFarlane, D. Kim and S.-Y. Jang, Highly Efficient Plastic Crystal Ionic Conductors for Solid-state Dye-sensitized Solar Cells, Sci. Rep., 2013, 3, 3520 CrossRef.
- H. Zhu, D. R. MacFarlane, J. M. Pringle and M. Forsyth, Organic Ionic Plastic Crystals as Solid-State Electrolytes, Trends Chem., 2019, 1, 1 CrossRef CAS.
- F. Makhlooghiazad, D. Gunzelmann, M. Hilder, D. R. MacFarlane, M. Armand, P. C. Howlett and M. Forsyth, Mixed Phase Solid-State Plastic Crystal Electrolytes Based on a Phosphonium Cation for Sodium Devices, Adv. Energy Mater., 2017, 7(2), 1601272 CrossRef.
- H. Zhu, U. a. Rana, V. Ranganathan, L. Jin, L. A. O'Dell, D. R. MacFarlane and M. Forsyth, Proton transport behaviour and molecular dynamics in the guanidinium triflate solid and its mixtures with triflic acid, J. Mater. Chem. A, 2014, 2(3), 681–691 RSC.
- D. R. MacFarlane and M. Forsyth, Plastic crystal electrolyte materials: new perspectives on solid state ionics, Adv. Mater., 2001, 13(12–13), 957–966 CrossRef CAS.
- H. Ishida, T. Iwachido, N. Hayama, R. Ikeda, M. Terashima and D. Nakamura, Self-diffusion and reorientation of methylammonium ions in (CH3NH3)2 ZnCl4 Crystals as studied by 1H-NMR, Z. Naturforsch., A: Phys. Sci., 1989, 44, 741–746 CAS.
- H. Ishida, R. Ikeda and D. Nakamura, 1H NMR Studies on the Reorientational Motions of Cations in Four Solid Phases of Methylammonium Iodide and the Self-Diffusion of Ions in Its Highest-Temperature Solid Phase, Bull. Chem. Soc. Jpn., 1986, 59(3), 915–924 CrossRef CAS.
- A. Basile, M. Hilder, F. Makhlooghiazad, C. Pozo-Gonzalo, D. R. MacFarlane, P. C. Howlett and M. Forsyth, Ionic Liquids and Organic Ionic Plastic Crystals: Advanced Electrolytes for Safer High Performance Sodium Energy Storage Technologies, Adv. Energy Mater., 2018, 8(17), 1703491 CrossRef.
- J. Rao, R. Vijayaraghavan, X. Wang, Y. Zhou, P. C. Howlett, D. R. MacFarlane, M. Forsyth and H. Zhu, Influence of Electrospun Poly(vinylidene difluoride) Nanofiber Matrix on the Ion Dynamics of a Protic Organic Ionic Plastic Crystal, J. Phys. Chem. C, 2018, 122(26), 14546–14553 CrossRef CAS.
- X. Wang, H. Zhu, Y. Zhou, M. Yoshizawa-Fujita, Y. Miyachi, M. Armand, M. Forsyth, J. M. Pringle and P. C. Howlett, Organic Ionic Plastic Crystal-Based Composite Electrolyte with Surface Enhanced Ion Transport and Its Use in All-Solid-State Lithium Batteries, Adv. Mater. Technol., 2017, 2(7), 1700046 CrossRef.
- J. Efthimiadis, G. J. Annat, J. Efthimiadis, M. Forsyth and D. R. MacFarlane, Solid state ion transport and phase behaviour in composites of N,N-methyl propylpyrrolidinium tetrafluoroborate and amorphous polyethylene oxide, Phys. Chem. Chem. Phys., 2003, 5(24), 5558–5564 RSC.
- N. Goujon, R. Kerr, C. Gervillié, Y. V. Oza, L. A. O’Dell, P. C. Howlett and M. Forsyth, Macrophase-Separated Organic Ionic Plastic Crystals/PAMPS-Based Ionomer Electrolyte: A New Design Perspective for Flexible and Highly Conductive Solid-State Electrolytes, ACS Omega, 2020, 5(6), 2931–2938 CrossRef CAS.
- X. Wang, G. M. A. Girard, H. Zhu, R. Yunis, D. R. MacFarlane, D. Mecerreyes, A. J. Bhattacharyya, P. C. Howlett and M. Forsyth, Poly(ionic liquid)s/Electrospun Nanofiber Composite Polymer Electrolytes for High Energy Density and Safe Li Metal Batteries, ACS Appl. Energy Mater., 2019, 2(9), 6237–6245 CrossRef CAS.
- J. Adebahr, N. Ciccosillo, Y. Shekibi, D. R. MacFarlane, A. J. Hill and M. Forsyth, The “filler-effect” in organic ionic plastic crystals: Enhanced conductivity by the addition of nano-sized TiO2, Solid State Ionics, 2006, 177(9), 827–831 CrossRef CAS.
- J. M. Pringle, Y. Shekibi, D. R. MacFarlane and M. Forsyth, The influence of different nanoparticles on a range of organic ionic plastic crystals, Electrochim. Acta, 2010, 55(28), 8847–8854 CrossRef CAS.
- Y. Shekibi, S. J. Pas, N. M. Rocher, B. R. Clare, A. J. Hill, D. R. MacFarlane and M. Forsyth, Surprising effect of nanoparticle inclusion on ion conductivity in a lithium doped organic ionic plastic crystal, J. Mater. Chem., 2009, 19(11), 1635–1642 RSC.
- X. Wang, H. Zhu, G. W. Greene, J. Li, N. Iranipour, C. Garnier, J. Fang, M. Armand, M. Forsyth, J. M. Pringle and P. C. Howlett, Enhancement of ion dynamics in organic ionic plastic crystal/PVDF composite electrolytes prepared by co-electrospinning, J. Mater. Chem. A, 2016, 4(25), 9873–9880 RSC.
- Y. Shekibi, A. Gray-Weale, D. R. MacFarlane, A. J. Hill and M. Forsyth, Nanoparticle Enhanced Conductivity in Organic Ionic Plastic Crystals:
![[thin space (1/6-em)]](https://www.rsc.org/images/entities/char_2009.gif) Space Charge versus Strain Induced Defect Mechanism, J. Phys. Chem. C, 2007, 111(30), 11463–11468 CrossRef CAS.
Space Charge versus Strain Induced Defect Mechanism, J. Phys. Chem. C, 2007, 111(30), 11463–11468 CrossRef CAS. - M. Forsyth, F. Chen, L. A. O'Dell and K. Romanenko, New insights into ordering and dynamics in organic ionic plastic crystal electrolytes, Solid State Ionics, 2016, 288, 160–166 CrossRef CAS.
- K. Romanenko, L. Jin, L. A. Madsen, J. M. Pringle, L. A. O’Dell and M. Forsyth, Anisotropic MRI Contrast Reveals Enhanced Ionic Transport in Plastic Crystals, J. Am. Chem. Soc., 2014, 136(44), 15638–15645 CrossRef CAS.
- F. Chen, L. Jin, S. W. de Leeuw, J. M. Pringle and M. Forsyth, Atomistic simulation of structure and dynamics of the plastic crystal diethyl(methyl)(isobutyl)phosphonium hexafluorophosphate, J. Chem. Phys., 2013, 138(24), 244503 CrossRef CAS.
- L. Jin, K. M. Nairn, C. M. Forsyth, A. J. Seeber, D. R. MacFarlane, P. C. Howlett, M. Forsyth and J. M. Pringle, Structure and Transport Properties of a Plastic Crystal Ion Conductor: Diethyl(methyl)(isobutyl)phosphonium Hexafluorophosphate, J. Am. Chem. Soc., 2012, 134(23), 9688–9697 CrossRef CAS.
- A. Bielecki and D. P. Burum, Temperature Dependence of 207Pb MAS Spectra of Solid Lead Nitrate. An Accurate, Sensitive Thermometer for Variable-Temperature MAS, J. Magn. Reson., Ser. A, 1995, 116(2), 215–220 CrossRef CAS.
- A. L. Van Geet, Calibration of methanol nuclear magnetic resonance thermometer at low temperature, Anal. Chem., 1970, 42(6), 679–680 CrossRef CAS.
- N. Bloembergen, E. M. Purcell and R. V. Pound, Relaxation Effects in Nuclear Magnetic Resonance Absorption, Phys. Rev., 1948, 73(7), 679–712 CrossRef CAS.
- K. Romanenko, J. M. Pringle, L. A. O'Dell and M. Forsyth, New insights into the thermal behaviour of organic ionic plastic crystals: magnetic resonance imaging of polycrystalline morphology alterations induced by solid–solid phase transitions, Phys. Chem. Chem. Phys., 2015, 17(29), 18991–19000 RSC.
- P. N. Sen, L. M. Schwartz, P. P. Mitra and B. I. Halperin, Surface relaxation and the long-time diffusion coefficient in porous media: Periodic geometries, Phys. Rev. B: Condens. Matter Mater. Phys., 1994, 49(1), 215–225 CrossRef.
- L. L. Latour, P. P. Mitra, R. L. Kleinberg and C. H. Sotak, Time-Dependent Diffusion Coefficient of Fluids in Porous Media as a Probe of Surface-to-Volume Ratio, J. Magn. Reson., Ser. A, 1993, 101(3), 342–346 CrossRef CAS.
- T. Bickel, A note on confined diffusion, Phys. A, 2007, 377(1), 24–32 CrossRef.
- F. Chen, L. Jin, S. W. D. Leeuw, J. M. Pringle and M. Forsyth, Atomistic simulation of structure and dynamics of the plastic crystal diethyl(methyl)(isobutyl)phosphonium hexafluorophosphate, J. Chem. Phys., 2013, 138(24), 244503 CrossRef CAS.
- P. P. Mitra, P. N. Sen and L. M. Schwartz, Short-time behavior of the diffusion coefficient as a geometrical probe of porous media, Phys. Rev. B: Condens. Matter Mater. Phys., 1993, 47(14), 8565–8574 CrossRef.
- P. P. Mitra, P. N. Sen, L. M. Schwartz and P. Le Doussal, Diffusion propagator as a probe of the structure of porous media, Phys. Rev. Lett., 1992, 68(24), 3555–3558 CrossRef CAS.
- J. Li, K. G. Wilmsmeyer and L. A. Madsen, Anisotropic Diffusion and Morphology in Perfluorosulfonate Ionomers Investigated by NMR, Macromolecules, 2009, 42(1), 255–262 CrossRef CAS.
- J. Li, K. G. Wilmsmeyer and L. A. Madsen, Hydrophilic Channel Alignment Modes in Perfluorosulfonate Ionomers: Implications for Proton Transport, Macromolecules, 2008, 41(13), 4555–4557 CrossRef CAS.
Footnote |
| † Electronic supplementary information (ESI) available. See DOI: 10.1039/d0ma00778a |
| This journal is © The Royal Society of Chemistry 2020 |

