DOI:
10.1039/C9NA00694J
(Paper)
Nanoscale Adv., 2020,
2, 1676-1684
Paradoxical combination of saturable absorption and reverse-saturable absorption in plasmon semiconductor nanocrystals†
Received
4th November 2019
, Accepted 24th February 2020
First published on 25th February 2020
Abstract
In heavily doped semiconductor nanocrystal systems, high-order nonlinearities including third-order nonlinearity and fifth-order nonlinearity can be tailored to manipulate light on the nanoscale due to the semiconductor intrinsic absorption and localized surface plasmon resonances. Here, by exploiting the nonlinear optical properties of broadly infrared plasmons in solution-processed aluminum-doped ZnO nanocrystals (AZO NCs) with a wide band-gap, we demonstrate that the competition between plasma ground-state bleaching (third-order nonlinearity) and three-photon absorption (fifth-order nonlinearity) is responsible for the transition between saturable absorption and reverse saturable absorption. Upon increasing the pump intensity, the third-order nonlinear coefficient decreases from −5.85 × 102 cm GW−1 to −7.89 × 10⁻¹⁰ cm GW−1, while the fifth-order nonlinear coefficient increases from 3.08 × 10⁻⁹ cm3 GW−2 to 15.8 cm3 GW−2. With aluminum-doped ZnO nanocrystals as a Q-switch, a pulsed fiber laser operating at the C band (optical communication band) was constructed. Furthermore, the relatively small temperature fluctuations (7.13 K) of the Q-switch indicate its application prospects in all-optical systems. Investigations on the intrinsic mechanism between high-order nonlinearity and the nonlinear absorption can promote the further development and applications of heavily doped oxide semiconductors in advanced nanophotonics.
Introduction
The emergence of noble metal nanocrystals (NCs) such as gold and silver has attracted growing research attention and led to their potential applications in the fields of photothermal therapy, sensing, plasma science, surface-enhanced Raman spectroscopy, nanolasers and short-pulse lasers.1–3 These excellent functionalities are related to their unique optical and electronic properties ascribed to their localized surface plasmon resonances (LSPRs), which rely on the resonant oscillation of free electrons at the surface of metal NCs.4,5 Such an amazing and outstanding optical confinement can enhance the light–matter interaction and be capable of manipulating resonant frequencies from ultraviolet (UV), visible and near-infrared (NIR) and even to mid-infrared (mid-IR) by altering their sizes, shapes, local environment and clustering.1,2 However, the optical loss due to free carriers hampers the realization of an efficient device in visible and infrared (NIR and mid-IR) spectral ranges. As an alternative to metal NCs, heavily doped oxide semiconductors like aluminum-doped zinc oxide (AZO) NCs offer fabrication advantages such as compatibility with well-established techniques like silicon complementary metal-oxide-semiconductors and relatively high thermal and/or chemical stabilities.6–9 Compared with ZnO semiconductors, AZO NCs have tunable infrared absorption to be used as a plasmonic component. In addition, their free carrier concentrations have been demonstrated to be tuned by doping, leading to the advantage of tunable dielectric properties. Recently, a series of research studies have reported the tunable carrier concentrations of AZO NCs, tailoring the imaginary part of permittivity to achieve low-loss plasmonic functionality.10,11 The coexistence of the bandgap and plasma in AZO NCs offers a platform to investigate the electron motion under intense irradiation. More importantly, without sacrificing the strong light–matter interaction, this advantage has brought forward many more in-depth studies on ultrafast optical processing in intrinsically nonlinear plasmonic systems.12–14
Many types of nonlinear optical (NLO) effects of heavily doped oxide semiconductors, for instance, second-order nonlinearity (e.g., second harmonic generation) and third-order nonlinearity (e.g., saturable absorption and four wave-mixing), have been investigated systematically by unravelling their electron–electron, electron–phonon, and phonon–phonon coupling.15–19 Among these NLO effects, there are two paradoxical responses including saturable absorption (SA) and reverse saturable absorption (RSA). The former can be used in saturable absorbers (optical switches) for the generation of a pulsed laser and the latter can be adopted in optical limiters for the protection of eyes and sensor focal-plane arrays.20–26 SA and RSA correspond to the opposite transition of electrons induced by the pump light, giving the result of paradoxical visual view: the SA response exhibits the increased transmittance related to the enhanced laser intensity and possesses a negative absorption coefficient, while RSA reveals the decreased transmittance and is related to a positive absorption coefficient. SA and RSA effects are paradoxical and have a competitive relationship, and the high-order optical nonlinearities like the fifth-order nonlinearity may also give rise to the change of nonlinear absorption in the AZO NC system.27 However, the intrinsic mechanism of the competitive relationship (between SA and RSA) and nonlinear absorption in heavily doped oxide semiconductors, especially in AZO NCs, remains hardly explored. A successful investigation can promote the further development and applications of AZO NCs in the fields of optoelectronics and photonics.
Here, we synthesized AZO NCs by a modified polyol process and then studied SA and RSA by a well-established Z-scan technique. It is found that ground-state plasma bleaching (third-order nonlinearity) and three-photon absorption (fifth-order nonlinearity) play a vital role in the transition of optical nonlinearity from SA to RSA under strong photoexcitation. Upon increasing the pump intensity, the third-order nonlinear coefficient decreases from −5.85 × 102 cm GW−1 to −7.89 × 10⁻¹⁰ cm GW−1, while the fifth-order nonlinear coefficient increases from 3.08 × 10⁻⁹ cm3 GW−2 to 15.8 cm3 GW−2. Furthermore, a Q-switched fiber laser at the C band (optical communication band) was achieved by adopting an AZO-based saturable absorber. Moreover, the relatively small temperature fluctuations (7.13 K) of the saturable absorber indicate the application prospects of AZO NCs in all-optical systems.
Results and discussion
The as grown-AZO NCs were synthesized by using zinc salts in basic solutions, which contain the dopant ions in the absence of bulky organic ligands.12,28 Diethylene glycol was used as a surfactant agent to prevent the agglomeration of the as-grown NCs. The detailed synthetic process is expounded in the Experimental section. The crystalline quality was evaluated using an X-ray diffraction (XRD) image and a typical pattern is depicted in Fig. 1(a). The hexagonal wurtzite (JCPDs no. 75-0576) pattern is also presented as a reference to evaluate the quality of the as-grown AZO NCs.28 All the diffraction peaks are congruent with the standard references and no characteristic peak from the impurity is observed, which indicates that the as-grown NCs offer high crystalline quality. The Raman spectrum further characterizes the as-grown NCs, as displayed in Fig. 1(b). Wurtzite-type ZnO has the space group C46v offering two formula units in the permitive cell.29 The Raman scattering modes of A1 and E1 are polar, leading to different frequencies for the transverse-optical (TO) and longitudinal-optical (LO) phonons; while the nonpolar E2 modes are divided into two frequencies (i.e., Ehigh2 and Elow2) due to the motion of oxygen atoms and the zinc sublattice.29,30 Due to the doping of Al ions, the lattice distortion caused by different atomic radii shifts the Raman frequencies from their original position (97.0, 327.7, and 437.5 cm−1) to be about 96.1, 322.3, and 436.7 cm−1,31 as depicted in Fig. 1(b). The linear absorption spectrum of the as-grown NCs is elaborated in Fig. 1(c). The sample was prepared by spinning the AZO solution onto a high transparent quartz slide and an empty quartz slide is used as the reference. The two expected absorption peaks located at 300–740 nm and 740–2600 nm wavelength ranges are, respectively, related to the intrinsic absorption of the semiconductor and the LSPR response in the AZO system.12,14,32 A step absorption behavior is shown for the high-energy peak (300–750 nm) due to the broad bandgap of the AZO semiconductor. The latter broad absorption peak is similar to those of other AZO NCs obtained using a wet-chemistry synthetic method.8,33 The start position of LSPRs is sensitive to the concentration of the Al dopant. The competition between intrinsic absorption and the LSPR effect may contribute to the change of nonlinear absorption in the AZO system. The observed optical resonances can be tailored through the particle size and shape to manage the optical nonlinearity of AZO NCs in the NIR and mid-IR spectral ranges.33 In addition, the morphology of the as-grown AZO NCs is measured by transmission electron microscopy (TEM) and a typical image is shown in Fig. 1(d). The image shows that the samples are irregular in shape, which is due to the inhomogenous doped product arising from the different solubility product constants of Zn2+ and Al3+.34 High-resolution TEM and selected area electron diffraction (SAED) images are illustrated in the inset in Fig. 1(d) to confirm the crystalline quality. The uniform distance between the interlayer is approximately 0.265 nm, corresponding to the (002) plane.
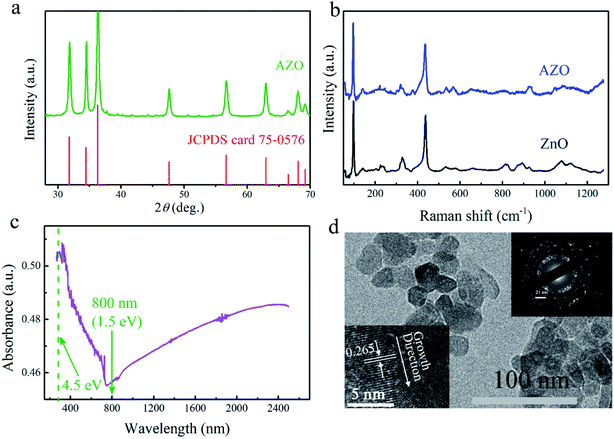 |
| | Fig. 1 Characteristics and linear optical properties of the obtained AZO NCs. (a) X-ray diffraction (XRD) pattern of the as-prepared AZO NCs. Here, for clarity, the JCPDS card (JCPDS# 75-0576) is shown as a reference. (b) Raman spectrum excited using a laser of 532 nm. (c) Linear optical absorption of AZO NCs. (d) Low-magnification TEM image, the SAED pattern (upper-right in the inset), and high-resolution TEM image (lower-left in the inset). | |
The optical nonlinearities were investigated and analyzed by using a well-established open-aperture (OA) Z-scan technique. Photo-excitation and electron transition are fundamental processes that are indicative of the optical response of materials upon strong excitation. Fig. 2 displays typical OA Z-scan experimental data of AZO NCs, as measured under 130 fs, 800 nm laser excitation. As shown in Fig. 2(a), moving the sample close to the focal plane (increasing the incident intensity, Z → 0), the transmission was observed to exhibit an incremental response, indicating the SA behavior. The SA modulation amplitude further increases upon increasing the laser intensity at the focal plane, as depicted in Fig. 2(b). However, a decrease in the transmission signal was detected upon increasing the laser intensity at the focal plane up to about 28.6 GW cm−2 (Fig. 2(c)), indicative of the occurrence of the RSA behavior.25 Noteworthily, there are two hump peaks (transmission maximum) lying either side of the center, indicating the occurrence of the SA response.25,27 Thus, the coexistence of the competitive NLO signal (SA and RSA) was illustrated. The coexistence behavior was also detected under the excitation of 54.8 GW cm−2 (Fig. 2(d)), showing a smaller transmission maximum and a larger RSA depth, and indicates that a transition occurs from SA to RSA for the AZO NCs under a dense laser excitation. Upon the excitation of 97.1 GW cm−2, the transmission at the focal plane further decreases and the hump peaks lying either side of the center disappear, as depicted in Fig. 2(e). We measured the NLO response of a blank quartz under the same photo-excitation and no signal was detected, which indicates that NLO response is related to AZO NCs. Since the field is confined near the surface of AZO NCs, the response of LSPRs offers a small mode volume, leading to a significant electromagnetic field enhancement.10,35 The optical properties of AZO NCs are controlled by the interaction between the incident electromagnetic field (excitation optical) and the coherent motion of free-electrons.36 The LSPRs can be excited with a light of wavelength longer than 740 nm (illustrated in Fig. 1(c)); that is to say, the nonlinear SA response upon the excitation of 800 nm stems from the ground-state plasmon bleaching with electron anharmonic motion in a strong electromagnetic field.15,35 Upon excitation of incident light, LSPRs occur and result in strong light scattering, leading to the appearance of intense surface plasmon absorption bands (shown in Fig. 1(c)) and an enhancement of the local electromagnetic fields. On moving the sample close to the focal plane (Z → 0), the enhanced local electromagnetic field resonates with an electric field (light) at an incident wavelength; thus, the absorption becomes saturable (or transmittance increases), as explained in the left-illustration in Fig. 3. The transition from SA to RSA indicates that another nonlinear process occurs and gradually becomes dominant. Considering the band-gap of AZO NCs (3.5–3.7 eV)32 and the pump wavelength (800 nm; 1.55 eV), the RSA effect can primarily be due to three-photon absorption related to the fifth order nonlinearity.37,38 The relationship between ln(1 − TOA) and ln(I0) at a high irradiation intensity (Fig. S2, ESI†) shows that the extracted slope value is 1.49, also indicating that the RSA is from three-photon absorption.39,40 The three-photon absorption refers to the electron transition from the ground-state of the valence band to the conduction band by absorbing three photons with an energy of 1.5 eV (800 nm). The three-photon absorption resonance peak (4.5 eV) also locates at the strong absorption peak in the high energy area, as depicted in Fig. 1(c), leading to the occurrence of the interband transition and RSA response. Moreover, three-photon absorption is irradiance dependent, and the corresponding contribution varies along with an increase in the optical intensity. Free-carrier absorption may also cause the RSA response.21,41,42 Free-carrier absorption refers to intraband transition, which describes the electron (or hole) transition in the conduction (or valence) band by absorbing free photons. As a result, because of the electron transition, the Fermi–Dirac distribution at thermal equilibrium changes, creating a positive value of the nonlinear absorption coefficient (or the imaginary part of the third-order susceptibility).
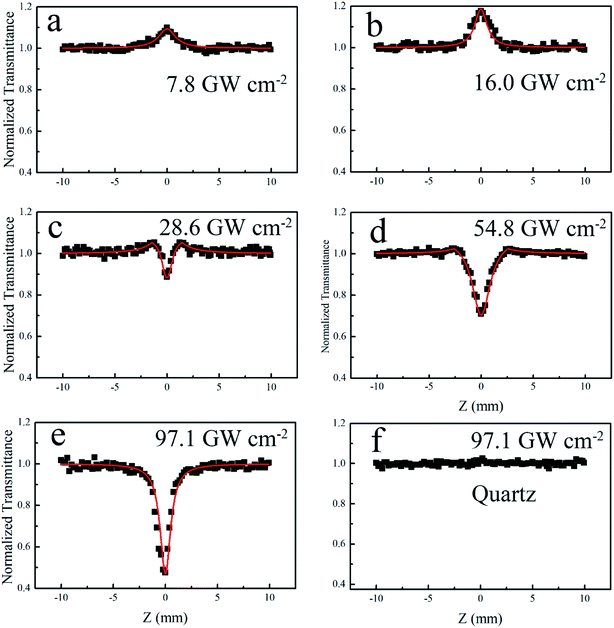 |
| | Fig. 2 Open Z-scan results (black square) and fitting curves (red line) of the AZO/quartz film measured by using a pump source of 800 nm-laser at different pulse intensities: (a) 7.8 GW cm−2, (b) 16.0 GW cm−2, (c) 28.6 GW cm−2, (d) 54.8 GW cm−2 and (e) 97.1 GW cm−2. (f) The blank quartz under the pulse intensity of 97.1 GW cm−2. | |
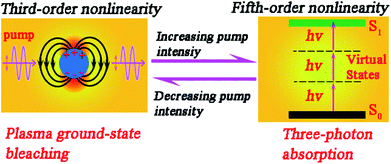 |
| | Fig. 3 Schematic representation of the optical absorption for regimes of low and high pump intensities. The left exhibits plasma ground-state bleaching (third-order nonlinearity) related to saturable absorption. The right displays three-photon absorption (fifth-order nonlinearity) related to reverse saturable absorption. S0 and S1 are the ground state and first singlet state, respectively. hν is the pump light energy. The dashed line is the virtual states. | |
In addition, the possible existence of photodegradation of the nanostructure,43 the hot-electron nonlinearity44 and the light scattering45 process may also cause the occurrence of an RSA behavior. In the photogradation process, the transmission decreases stemming from the degradation of the particle (non-reversibility process). In order to exclude the possibility of photodegradation, the excitation intensity was then decreased from 97.1 GW cm−2 to 7.8 GW cm−2. As shown in Fig. S1 (ESI†), the prominent RSA response transforms into the SA response, indicating the reversible behavior of the transition between the SA and RSA responses. Light scattering and hot-electrons are the fundamental response of light–matter interactions in heavily doped semiconductors because of the LSPR effect. However, the hot-electron nonlinearity in nanoparticles requires a few picoseconds to arise.44 In our measurements, the excitation pump source was a femtosecond laser; hence, it is impossible for the hot-electron to cause optical nonlinearity in AZO NCs. The light scattering mechanism was usually adopted to account for the RSA behavior in nanoparticle dispersion systems.46 On the other hand, it is obvious that the closer the excitation wavelength to the plasmonic resonance peak, the stronger is the light scattering.47Fig. 4 shows an OA Z-scan under the excitation of 1550 nm. It is obvious that the SA response amplitude increases upon increasing the excitation intensity from 48.7 GW cm−2 to 463.3 GW cm−2. Different from the data under the excitation of 800 nm, only the SA response upon the excitation of 1550 nm is recorded for all the intensities, which indicates that light scattering and free-carrier absorption are unlikely to be the dominant factor of RSA (at 800 nm). As elaborated in Fig. 3, the competition between plasma ground-state bleaching and three-photon absorption is responsible for the transition between SA and RSA. Hence, the fifth order nonlinearity (three-photon absorption) can also be involved in the analysis model to unravel the nonlinear absorption at 800 nm based on the competition of SA and RSA.
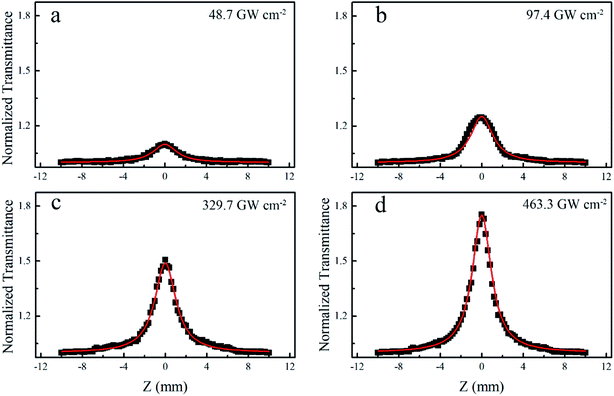 |
| | Fig. 4 Open Z-scan results (black square) and fitting curves (red line) of the AZO/quartz film measured by using a pump source of 1550 nm-laser at different pulse intensities. | |
The traditional Z-scan analysis only based on the linear absorption and nonlinear absorption only takes into account SA or RSA related to the third-order nonlinearity. Considering the coexistence of SA (related to third-order nonlinearity) and RSA (related to fifth-order nonlinearity) in AZO NCs at 800 nm, the SA coefficient (β) and three-photon absorption coefficient (γ) can be simultaneously involved in the analysis model. The total absorption coefficient (α) at 800 nm in the AZO NCs can be described as:
Here, the first term (
α0) is the linear absorption coefficient, the second term (third-order nonlinearity) presents negative nonlinear absorption related to saturable absorption, and the third term (fifth-order nonlinearity) presents positive nonlinear absorption related to three-photon absorption which contributes to the RSA response. As for an open aperture Z-scan, the normalized transmittance can be fitted by the following equation:
48| |  | (2) |
where
τ is the half-width at
e−1 of the maximum for the pulse duration;
T(
x,
t) is the polynomial solution of the normalized transmittance as a function of the sample position
x =
z/
z0,
z is the sample position from the focal plane;
z0 = π
ω02/
λ presents the Rayleigh range,
ω0 presents the minimum beam waist at the focal plane (
z = 0),
λ presents the laser free-space wavelength; the detailed expression of
T(
x,
t) is shown in the ESI.
† By fitting the experimental data in
Fig. 2 using
eqn (1) and
(2), the SA absorption coefficient and three-photon absorption coefficient can be extracted and the corresponding parameters are summarized in
Table 1. The negative sign of
β indicates the nonlinearity contributes to SA; while the positive sign of
γ indicates the nonlinearity represents RSA. It is interesting to note that
β and
γ are dependent on the peak intensity at the focal plane. The coefficient
β firstly increases upon increasing the laser intensity from 7.8 GW cm
−2 to 16.0 GW cm
−2 and then monotonously decreases upon further increasing the laser intensity. In contrast, the coefficient
γ firstly decreases and then monotonously increases as the intensity of the laser increases. The paradoxical variation hints at the contrariety between the SA coefficient (
β) and the three-photon absorption coefficient (
γ) in AZO NCs at 800 nm. At a low laser intensity (16.0 GW cm
−2), the SA parameter of
β is the prominent factor so that only the SA behavior was detected. Along with an increase in the laser intensity, the coefficient
γ becomes more obvious when the laser intensity is above 16.0 GW cm
−2, which leads to the occurrence of RSA and even more prominent RSA behavior at a high laser intensity (97.1 GW cm
−2). The change shows the competition between ground-state plasmon bleaching and three-photon absorption. The tens of magnitude of difference between
β and
γ in the low intensity region and high intensity region also conform to the basic theory of nonlinear optics.
49 That is, since
β is tens of magnitude larger than
γ in the low intensity region, the experimental data in
Fig. 2(a) and (b) can be fit by the traditional Z-scan analysis model omitting the term of three-photon absorption related to RSA:
50| |  | (3) |
where
I0 is the laser intensity at the focal plane;
Leff=(1 − exp(−
α0L))/
α0 is the effective length for the third-order nonlinearity process;
L is the sample length (thickness). The term of saturable absorption related to SA can also be omitted for that under the laser intensity of 97.1 GW cm
−2, and the normalized transmittance can be fitted by the pure three-photon absorption model:
39| |  | (4) |
where

,

is the effective length for the three-photon absorption process. Also, for simplicity, the SA behavior upon the excitation wavelength of 1550 nm can be fitted using
eqn (3) as shown in
Fig. 4 due to only the occurrence of the SA response. Considering the excitation energy (1550 nm; 0.8 eV) is very smaller than the bandgap of AZO, five photons are required for an electron located at the valence band to jump into the conduction band (
i.e., five-photon absorption). However, it is difficult to detect these higher-order nonlinearities due to their small probability. Thus, only the SA response from ground-state plasmon bleaching was observed upon the excitation of 1550 nm.
Table 1 Saturable absorption coefficient (β) and the three-photon absorption coefficient (γ)
| Laser intensity (GW cm−1) |
7.8 |
16.0 |
28.6 |
54.8 |
97.1 |
|
β (cm GW−1) |
−4.47 × 10² |
−5.85 × 10² |
−4.32 × 10⁻³ |
−1.05 × 10⁻⁵ |
−7.89 × 10⁻¹⁰ |
|
γ (cm3 GW−2) |
9.97 × 10⁻⁹ |
3.08 × 10⁻⁹ |
1.64 × 10⁻⁴ |
3.72 × 10⁻³ |
15.8 |
In order to evaluate the concrete nonlinear parameters, the intensity-dependent transmittance under the excitation of 800 nm and 1550 nm is shown in Fig. 5(a) and (b), respectively. Obviously, as mentioned above, the SA transforms into RSA upon increasing the pulse energy to 800 nm; while it is a consistent SA under the excitation of 1550 nm. The different manifestations suggest that AZO NCs can not only act as an optical limiter at 800 nm for protecting sensors and eyes due to the RSA effect, but they also have potential applications as optical switches above 800 nm for pulse modulations due to the SA effect. In order to obtain the modulation depth (ΔT) and saturable intensity (Isat) for evaluating the capacity of pulse shaping, the experimental data of SA can be fitted using the formula T(I) = 1 − ΔT × exp(−I/Isat) − Tns,20 in which I and Tns are used to describe the input intensity and nonsaturable absorbance, respectively. The modulation depths are extracted to be 26.3% (800 nm) and 37.8% (1550 nm), respectively, indicating its capability for pulse generation in the NIR region. The transient optical response of AZO NCs was also investigated by using a pump-probe technique in another article,12 exhibiting an ultrafast electron behavior (less than 350 femtoseconds). The large optical nonlinearity and ultrafast electron dynamics in AZO NCs promote us to investigate their practical applications as optical switches in all-optical systems. Actually, the capability of the saturable absorber for a mode-locked fiber laser at 1064 nm and 1550 nm and a Q-switched fiber laser at 2000 nm and 3000 nm was demonstrated in detailed in another article.12 Here, the capability as a saturable absorber for a Q-switched fiber laser at the C band (optical communication band) was exhibited. The compact fiber laser setup is based on the erbium-doped fiber and the AZO/PVA composite film is embedded into the laser cavity to serve as the fiber modulator. The detailed laser setup is explained in the ESI.†
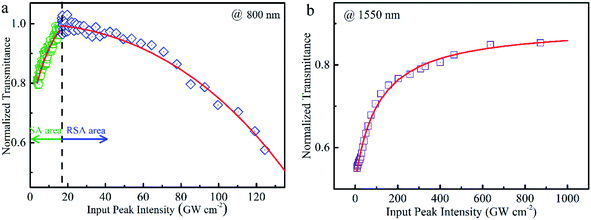 |
| | Fig. 5 Dependence of normalized transmittance on optical intensity upon different pump sources: (a) 800 nm and (b) 1550 nm. | |
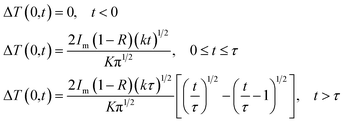
Upon increasing the launched pump to 12.3 mW, a stable Q-switching regime was obtained, which was confirmed to be insensitive to the adjustment of PC. Fig. 6 shows pulse train under different pump powers and no significant pulse jitter is found using an oscilloscope. The repetition rate increases from 35.46 kHz to 69.92 kHz with the increase of pump power from 12.3 mW to 60.65 mW, showing an s symmetrical Gaussian-like shape with a varied pulse duration from 6.60 μs to 2.05 μs. A typical Q-switching optical spectrum at a pump power of 20.94 mW is shown in Fig. 7(a), exhibiting a center wavelength of 1558.2 nm. As depicted in the inset, the output pulse laser exhibits good stability within 4 h. The radio-frequency (RF) output spectra in Fig. 7(b) were also measured to evaluate the laser stability, with a signal-to-noise ratio (SNR) of 51 dB. Moreover, only the fundamental and harmonic frequencies were observed in a wider span of 300 kHz, indicating the high stability of the Q-switched pulse. Furthermore, the characteristics including the repetition rate, pulse duration, output power and pulse energy were achieved. Fig. 7(c) illustrates the correlations between the pulse duration and the repetition rate as well as the launched pump power. By setting the stable intracavity polarization, the repetition rate was observed to monotonously increase from 35.46 kHz to 69.92 kHz with continuously enhanced pump power from 12.3 mW to 60.65 mW. However, the pulse duration decreases monotonously and the shortest pulse duration is 2.05 μs. Nonetheless, the Q-switched pulse output was stable with no significant pulse-intensity fluctuation observed on the oscilloscope during the adjustment of the pump power between 12.3 and 60.65 mW. Fig. 7(d) summarizes the average output power and the corresponding calculated single pulse energy with respect to pump power. The output power almost increases linearly with the pump power enhanced from 12.3 mW to 60.65 mW. By contrast, the calculated single pulse energy increases rapidly and then tends to be saturated when the pump power is increased further over 36.59 mW. The maximum pulse energy is 42.66 nJ at a pump power of 44.13 mW. Interestingly, the output power increases with a slope efficiency of 4.6%, which is larger than those of other saturable absorbers such as graphene, MoS2, gold nanoparticles and Cu1.8S nanocrystals,51,52 but is comparable to previously reported values for Cu3−xP nanocrystals.53 The temperature change of the saturable absorber upon pulsed laser is a critical parameter to evaluate the practical applications. The maximum surface temperature change of the sample (ΔTmax) excited by a Gaussian laser beam of a single pulse can be expressed by:54
| |  | (5) |
where
t = 0 represents the start time of the pulse,
Im describes the maximum optical intensity of the sample, Δ
T(0,
t) describes the central temperature change of the sample at time
t,
τ is the pulse width of the pulse laser,
R = ∼10% is the reflectivity,
55k = ∼1.0 × 10
−6 m
2 s
−1 is the thermal diffusivity,
9,56 and
K = ∼1.5 W m
−1 K
−1 is the thermal conductivity for AZO at room temperature.
9 The maximum surface temperature change after
n pulses (Δ
Tmaxn) can be calculated by:
57| |  | (6) |
where,
trp describes the repetition period of the pulse train. Hence, the maximum surface temperature change could be extracted to be 7.13 K. Although the density of the free carrier is calculated to be about 10
19 cm
−3 (the detailed calculation is shown in another article),
12 the temperature fluctuations of AZO in the Q-switched laser are relatively small without obviously influencing the performance of the AZO-satuable absorber and the Q-switched laser. The paradoxical combination of SA and RSA does not affect the practical application as the saturable absorber for mode-locked or Q-switched lasers. Furthermore, in addition to broadband and ultrafast operation as a satuable absorber from NIR to mid-IR,
12 the AZO-based fiber modulator possesses advantages in terms of flexibility of the preparation technique and stability upon pulse interactions.
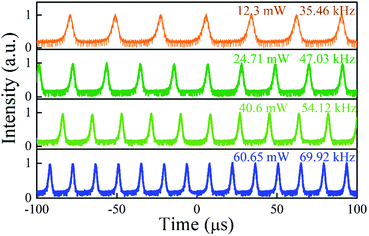 |
| | Fig. 6 Pulse trains of the Q-switched fiber laser upon a pump power of 12.3 mW, 24.71 mW, 40.6 mW and 60.65 mW, respectively. | |
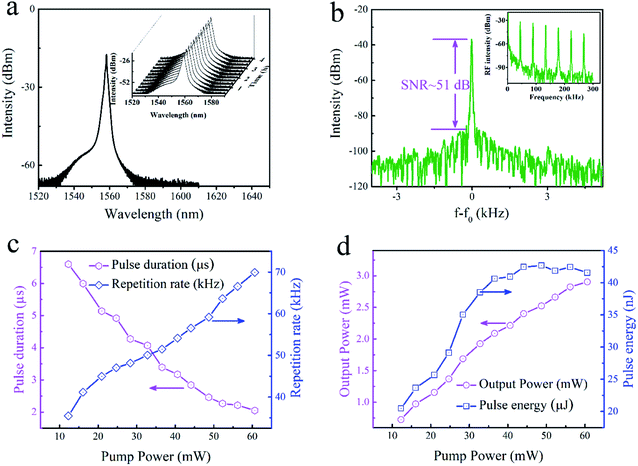 |
| | Fig. 7 Q-Switched laser characterization of the AZO-based fiber laser. (a) Typical output pulse spectrum, centered at 1558.2 nm. The inset shows long-term operation. (b) The typical RF spectrum at fundamental frequency and the wideband RF spectrum (inset). (c) The pulse duration and repetition rate as a function of pump power. (d) Output power and pulse energy as a function of pump power. | |
Conclusions
In summary, we theoretically proposed and experimentally verified the intrinsic mechanisms of nonlinearity related to the combination of saturable absorption and reverse saturable absorption in Al-doped ZnO nanocrystals. The nonlinear absorption transforms upon the excitation of 800 nm at 28.6 GW cm−2, which is associated with the competition between the third-order nonlinearity (saturable absorption coefficient) and the fifth-order nonlinearity (three-photon absorption coefficient). Furthermore, a Q-switched fiber laser was also successfully fabricated by employing Al-doped ZnO nanocrystals as the saturable absorber at the C band (optical communication band). Moreover, the relatively small temperature fluctuations (7.13 K) of the Al-doped ZnO-based saturable absorber indicate the application perspective in all-optical systems. Investigating the intrinsic mechanism between high-order nonlinearity and the nonlinear absorption can propel the further development and applications of heavily doped oxide semiconductors in advanced optoelectronics and photonics.
Experimental section
Details of sample preparation, characterization, Z-scan, fiber laser setup, calculation of the nonlinear absorption coefficient, and additional figures are shown in the ESI.†
Conflicts of interest
The authors declare no competing financial interest.
Acknowledgements
This work was financially supported by the National Key R&D Program of China (Grant No. 2018YFB1107200), National Natural Science Foundation of China (Grant No. 51772270, 51802285), Open Funds from State Key Laboratory of High Field Laser Physics (Shanghai Institute of Optics and Fine Mechanics, Chinese Academy of Science) and State Key Laboratory of Precision Spectroscopy (East China Normal University). This work was also supported by the Natural Science Foundation of Zhejiang Province (Grant No. LQ18A040004) and the Open Fund of the State Key Laboratory of Luminescent Materials and Devices (South China University of Technology, 2018-skllmd-13).
References
- S. Eustis and M. A. El-Sayed, Chem. Soc. Rev., 2006, 35, 209–217 RSC.
- S. K. Ghosh and T. Pal, Chem. Rev., 2007, 107, 4797–4862 CrossRef CAS PubMed.
- A. Kuzyk, R. Schreiber, H. Zhang, A. O. Govorov, T. Liedl and N. Liu, Nat. Mater., 2014, 13, 862 CrossRef CAS PubMed.
- A. V. Kildishev, A. Boltasseva and V. M. Shalaev, Science, 2013, 339, 1232009 CrossRef PubMed.
- P. Guo, R. D. Schaller, J. B. Ketterson and R. P. H. Chang, Nat. Photonics, 2016, 10, 267–273 CrossRef CAS.
- L. Caspani, R. P. M. Kaipurath, M. Clerici, M. Ferrera, T. Roger, J. Kim, N. Kinsey, M. Pietrzyk, A. Di Falco, V. M. Shalaev, A. Boltasseva and D. Faccio, Phys. Rev. Lett., 2016, 116, 233901 CrossRef CAS PubMed.
- I. Liberal and N. Engheta, Nat. Photonics, 2017, 11, 149 CrossRef CAS.
- E. Della Gaspera, A. S. R. Chesman, J. van Embden and J. J. Jasieniak, ACS Nano, 2014, 8, 9154–9163 CrossRef CAS PubMed.
- P. Jood, R. J. Mehta, Y. Zhang, G. Peleckis, X. Wang, R. W. Siegel, T. Borca-Tasciuc, S. X. Dou and G. Ramanath, Nano Lett., 2011, 11, 4337–4342 CrossRef CAS PubMed.
- G. V. Naik, V. M. Shalaev and A. Boltasseva, Adv. Mater., 2013, 25, 3264–3294 CrossRef CAS PubMed.
- C. T. Riley, J. S. T. Smalley, K. W. Post, D. N. Basov, Y. Fainman, D. Wang, Z. Liu and D. J. Sirbuly, Small, 2016, 12, 892–901 CrossRef CAS PubMed.
- X. Tian, H. Luo, R. Wei, M. Liu, Z. Yang, Z. Luo, H. Zhu, J. Li and J. Qiu, Nanoscale, 2019, 11, 13988–13995 RSC.
- J. Kim, A. Dutta, G. V. Naik, A. J. Giles, F. J. Bezares, C. T. Ellis, J. G. Tischler, A. M. Mahmoud, H. Caglayan, O. J. Glembocki, A. V. Kildishev, J. D. Caldwell, A. Boltasseva and N. Engheta, Optica, 2016, 3, 339–346 CrossRef CAS.
- N. Kinsey, C. DeVault, J. Kim, M. Ferrera, V. M. Shalaev and A. Boltasseva, Optica, 2015, 2, 616–622 CrossRef CAS.
- M. Z. Alam, I. De Leon and R. W. Boyd, Science, 2016, 352, 795–797 CrossRef CAS PubMed.
- G. Garcia, R. Buonsanti, E. L. Runnerstrom, R. J. Mendelsberg, A. Llordes, A. Anders, T. J. Richardson and D. J. Milliron, Nano Lett., 2011, 11, 4415–4420 CrossRef CAS PubMed.
- B. T. Diroll, P. Guo, R. P. H. Chang and R. D. Schaller, ACS Nano, 2016, 10, 10099–10105 CrossRef CAS PubMed.
- P. Guo, R. D. Schaller, L. E. Ocola, B. T. Diroll, J. B. Ketterson and R. P. H. Chang, Nat. Commun., 2016, 7, 12892 CrossRef CAS PubMed.
- M. Z. Alam, S. A. Schulz, J. Upham, I. De Leon and R. W. Boyd, Nat. Photonics, 2018, 12, 79–83 CrossRef CAS.
- X. Tian, H. Luo, R. Wei, C. Zhu, Q. Guo, D. Yang, F. Wang, J. Li and J. Qiu, Adv. Mater., 2018, 30, 1801021 CrossRef PubMed.
- X. Tian, R. Wei, Q. Guo, Y.-J. Zhao and J. Qiu, Adv. Mater., 2018, 30, 1801638 CrossRef PubMed.
- X. Tian, R. Wei, M. Liu, C. Zhu, Z. Luo, F. Wang and J. Qiu, Nanoscale, 2018, 10, 9608–9615 RSC.
- R. Wei, H. Zhang, X. Tian, T. Qiao, Z. Hu, Z. Chen, X. He, Y. Yu and J. Qiu, Nanoscale, 2016, 8, 7704–7710 RSC.
- R. Wei, X. Tian, Z. Hu, H. Zhang, T. Qiao, X. He, Q. Chen, Z. Chen and J. Qiu, Opt. Express, 2016, 24, 25337–25344 CrossRef CAS PubMed.
- G.-K. Lim, Z.-L. Chen, J. Clark, R. G. S. Goh, W.-H. Ng, H.-W. Tan, R. H. Friend, P. K. H. Ho and L.-L. Chua, Nat. Photonics, 2011, 5, 554 CrossRef CAS.
- U. Keller, Nature, 2003, 424, 831–838 CrossRef CAS PubMed.
- N. Liaros, P. Aloukos, A. Kolokithas-Ntoukas, A. Bakandritsos, T. Szabo, R. Zboril and S. Couris, J. Phys. Chem. C, 2013, 117, 6842–6850 CrossRef CAS.
- M. Louhichi, S. Romdhane, A. Fkiri, L. S. Smiri and H. Bouchriha, Appl. Surf. Sci., 2015, 356, 998–1004 CrossRef CAS.
- R. Cuscó, E. Alarcón-Lladó, J. Ibáñez, L. Artús, J. Jiménez, B. Wang and M. J. Callahan, Phys. Rev. B: Condens. Matter Mater. Phys., 2007, 75, 165202 CrossRef.
- K. Samanta, P. Bhattacharya, R. S. Katiyar, W. Iwamoto, P. G. Pagliuso and C. Rettori, Phys. Rev. B: Condens. Matter Mater. Phys., 2006, 73, 245213 CrossRef.
- A. Kelchtermans, K. Elen, K. Schellens, B. Conings, H. Damm, H.-G. Boyen, J. D'Haen, P. Adriaensens, A. Hardy and M. K. Van Bael, RSC Adv., 2013, 3, 15254–15262 RSC.
- Y. Zhang, T. Wei, W. Dong, C. Huang, K. Zhang, Y. Sun, X. Chen and N. Dai, Appl. Phys. Lett., 2013, 102, 213117 CrossRef.
- R. Buonsanti, A. Llordes, S. Aloni, B. A. Helms and D. J. Milliron, Nano Lett., 2011, 11, 4706–4710 CrossRef CAS PubMed.
- Z. Lu, J. Zhou, A. Wang, N. Wang and X. Yang, J. Mater. Chem., 2011, 21, 4161–4167 RSC.
- M. Kauranen and A. V. Zayats, Nat. Photonics, 2012, 6, 737 CrossRef CAS.
- A. V. Zayats, I. I. Smolyaninov and A. A. Maradudin, Phys. Rep., 2005, 408, 131–314 CrossRef CAS.
- G. S. He, L.-S. Tan, Q. Zheng and P. N. Prasad, Chem. Rev., 2008, 108, 1245–1330 CrossRef CAS PubMed.
- L. W. Tutt and T. F. Boggess, Prog. Quantum Electron., 1993, 17, 299–338 CrossRef CAS.
- J. He, Y. Qu, H. Li, J. Mi and W. Ji, Opt. Express, 2005, 13, 9235–9247 CrossRef CAS PubMed.
- A. D. Lad, P. Prem Kiran, G. Ravindra Kumar and S. Mahamuni, Appl. Phys. Lett., 2007, 90, 133113 CrossRef.
- F. Hache, D. Ricard, C. Flytzanis and U. Kreibig, Appl. Phys. A, 1988, 47, 347–357 CrossRef.
- U. Gurudas, E. Brooks, D. M. Bubb, S. Heiroth, T. Lippert and A. Wokaun, J. Appl. Phys., 2008, 104, 073107 CrossRef.
- L. De Boni, E. L. Wood, C. Toro and F. E. Hernandez, Plasmonics, 2008, 3, 171 CrossRef CAS.
- H. B. Liao, R. F. Xiao, J. S. Fu, H. Wang, K. S. Wong and G. K. L. Wong, Opt. Lett., 1998, 23, 388–390 CrossRef CAS PubMed.
- S.-W. Chu, H.-Y. Wu, Y.-T. Huang, T.-Y. Su, H. Lee, Y. Yonemaru, M. Yamanaka, R. Oketani, S. Kawata, S. Shoji and K. Fujita, ACS Photonics, 2014, 1, 32–37 CrossRef CAS.
- J. Huang, N. Dong, S. Zhang, Z. Sun, W. Zhang and J. Wang, ACS Photonics, 2017, 4, 3063–3070 CrossRef CAS.
- J. M. Luther, P. K. Jain, T. Ewers and A. P. Alivisatos, Nat. Mater., 2011, 10, 361 CrossRef CAS PubMed.
- J. Wang, B. Gu, X.-W. Ni and H.-T. Wang, Opt. Laser Technol., 2012, 44, 390–393 CrossRef.
-
R. W. Boyd, Nonlinear Optics, Elsevier, Amsterdam, The Netherlands, 3rd edn, 2008, pp. 1–65 Search PubMed.
- M. Sheik-Bahae, A. A. Said, T. Wei, D. J. Hagan and E. W. V. Stryland, IEEE J. Quantum Electron., 1990, 26, 760–769 CrossRef CAS.
- R. Wei, H. Zhang, Z. Hu, T. Qiao, X. He, Q. Guo, X. Tian, Z. Chen and J. Qiu, Nanotechnology, 2016, 27, 305203 CrossRef PubMed.
- M. Liu, D. Zhou, Z. Jia, Z. Li, N. Li, S. Li, Z. Kang, J. Yi, C. Zhao, G. Qin, H. Song and W. Qin, J. Mater. Chem. C, 2017, 5, 4034–4039 RSC.
- Z. Liu, H. Mu, S. Xiao, R. Wang, Z. Wang, W. Wang, Y. Wang, X. Zhu, K. Lu, H. Zhang, S.-T. Lee, Q. Bao and W. Ma, Adv. Mater., 2016, 28, 3535–3542 CrossRef CAS PubMed.
- J. H. Bechtel, J. Appl. Phys., 1975, 46, 1585–1593 CrossRef.
- L. Gong, Z. Ye, J. Lu, L. Zhu, J. Huang, X. Gu and B. Zhao, Vacuum, 2010, 84, 947–952 CrossRef CAS.
- K. F. Cai, E. Müller, C. Drašar and A. Mrotzek, Mater. Sci. Eng., B, 2003, 104, 45–48 CrossRef.
- E.
G. Gamaly, A. V. Rode and B. Luther-Davies, J. Appl. Phys., 1999, 85, 4213–4221 CrossRef CAS.
Footnote |
| † Electronic supplementary information (ESI) available. See DOI: 10.1039/c9na00694j |
|
| This journal is © The Royal Society of Chemistry 2020 |
Click here to see how this site uses Cookies. View our privacy policy here.  Open Access Article
 ab,
Rongfei
Wei
*c,
Dandan
Yang
a and
Jianrong
Qiu
*ad


 ,
,  is the effective length for the three-photon absorption process. Also, for simplicity, the SA behavior upon the excitation wavelength of 1550 nm can be fitted using eqn (3) as shown in Fig. 4 due to only the occurrence of the SA response. Considering the excitation energy (1550 nm; 0.8 eV) is very smaller than the bandgap of AZO, five photons are required for an electron located at the valence band to jump into the conduction band (i.e., five-photon absorption). However, it is difficult to detect these higher-order nonlinearities due to their small probability. Thus, only the SA response from ground-state plasmon bleaching was observed upon the excitation of 1550 nm.


