 Open Access Article
Oriented attachment mechanism of triangular Ag nanoplates: a molecular dynamics study†
Tonnam
Balankura
*a,
Tianyu
Yan
a,
Omid
Jahanmahin
a,
Jenwarin
Narukatpichai
a,
Alan
Ng
a and
Kristen A.
Fichthorn
 *ab
*ab
aDepartment of Chemical Engineering, The Pennsylvania State University, University Park, PA 16802, USA. E-mail: fichthorn@psu.edu
bDepartment of Physics, The Pennsylvania State University, University Park, PA 16802, USA
First published on 30th March 2020
Abstract
We use molecular-dynamics simulations to probe the experimentally observed aggregation of PVP-covered triangular Ag nanoplates to form 2D sheets in solution. We find lateral plate attachment is the most favorable aggregation pathway – consistent with experiment. The mechanism is general and suggests new processing strategies for creating 2D architectures in solution-phase syntheses.
A firm understanding of the mechanisms of nanocrystal growth and assembly in solution will be beneficial for many aspects of materials synthesis. From a fundamental standpoint, many crystals grow in solution via Ostwald ripening, or the classical scenario in which crystals of sufficient size grow by monomer addition, while smaller, unstable particles simultaneously dissolve.1 In addition, there is a large body of literature indicating that non-classical mechanisms can also be operative in crystal growth (see, for example, ref. 2–5). Among these, oriented attachment (OA) has received considerable attention.6–11 OA is the aggregation of two crystallites in a way that produces a single crystal12 or a crystal with planar defects at the attachment plane.13 Considering all possible morphologies that could occur when two nanocrystals aggregate, we can envision many random, polycrystalline structures and a vanishingly small subset of aggregates that would exhibit OA. Thus, the frequency with which OA is observed experimentally and the wide range of systems for which it is observed2,3,5,14 is intriguing.
There have been a number of studies focused on resolving the forces and interactions that drive OA. In a broad sense, Zhang, et al. concluded that the extent of internal nanoparticle order and its associated electrostatic field are key factors governing OA.15 This view represents a significant body of work aimed at understanding OA on the basis of possible interparticle interactions. For example, Zhang and Banfield performed force-field based static energy calculations to predict that OA is governed by long-range electrostatic interactions.16,17 similarly, several groups probed the role of dipole–dipole interactions – with mixed results. In their numerical study, Yasui and Kato found that dipole–dipole interactions could direct the alignment of sufficiently large BaTiO3 nanoparticles.18 We performed atomistic molecular dynamics (MD) simulations of the aggregation of TiO2 (anatase) nanocrystals. Despite possessing high dipole moments, these nanocrystals did not aggregate along the direction of their dipoles, as local electrostatic forces at nanocrystal edges became more important at close separations.19 Schapotschnikow and co-workers reached a similar conclusion in their MD simulation studies of PbSe nanocrystals.20 Yasui and Kato predicted that van der Waals (vdW) torque could induce the alignment of BaTiO3 nanocrystals of size smaller than 5 nm.21 Zhang et al. demonstrated with experiments and theory that vdW torque can contribute to the alignment of TiO2 nanocrystals in solution when the crystals reach single nm separations.22
It is evident from a number of studies that OA is a kinetic process, as the aggregates that form are frequently low-dimensional or branched structures that appear to be far from equilibrium.12,23–31 Thus, it is also important to understand the mechanisms and kinetic barriers that govern OA. Along these lines, our group used MD simulations based on the ReaxFF reactive force field to probe the OA of TiO2 (anatase) nanocrystals with adsorbed water.32 These calculations showed that short-range hydrogen-bonding interactions can lead to nanocrystal association. In their associated state, the nanocrystals sample many different relative orientations until they attain a configuration in which they are primed for OA. Similar motions were observed for iron oxide nanocrystals in the in situ transmission electron microscopy (TEM) study of Li et al.33 Our studies showed that solvent-mediated forces tend to align the nanoparticles so that they rotate to approach one another in a solution via preferred pathways.34 The MD simulations by Sathiyanarayanan et al. indicated that solvent can be less ordered (and less dense) around nanocrystal edges and corners and that this promotes aggregation at the ends of a growing nanobar.35 Zhang and colleagues recently determined that solvent can play a key role in creating free energy barriers for the aggregation of zinc oxide crystals.22 It has been proposed in a few experimental studies23,28 that capping molecules can play a key role in directing OA and this is the topic of the present study.
In this study, we used atomistic MD simulations to probe the origins of OA observed experimentally in the growth of Ag plates.30,31 In the experimental studies, triangular plates with edge lengths ranging from 300–1000 nm and thicknesses between 25–30 nm were grown in polyethylene glycol30 or N,N-dimethylformamide (DMF)31 under the protection of polyvinylpyrrolidone (PVP). The plates were observed to aggregate laterally, “side-to-side” via an apparent OA mechanism to create larger 2D sheets in both studies. It is evident that “face-to-face” aggregation would lead to significantly lower free energies for the aggregates in these systems, so the side-to-side aggregates represent a metastable state that is accessed through a favorable kinetic mechanism. An understanding of the driving forces for lateral plate aggregation would be beneficial in designing processing strategies to create 2D structures for a variety of applications.36 As we will discuss below, our study reveals the origins of lateral plate attachment.
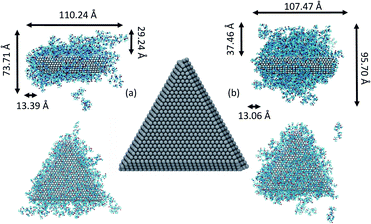
We consider the approach and fusion of two triangular Ag plates covered with PVP capping agent. We studied three different systems consisting of two Ag plates covered by 148 and 234 molecules in vacuum and 148 PVP molecules in ethylene glycol (EG) solvent. In all simulations, we used PVP molecules with 10 repeat units. The Ag plates, shown in Fig. 1, have triangular {111} faces, and sides consisting of {111} and {110} facets. The plates have a 21.2 Å thickness and edge length of 80.9 Å. This shape has an edge-to-thickness ratio of 4![[thin space (1/6-em)]](https://www.rsc.org/images/entities/char_2009.gif) :
:![[thin space (1/6-em)]](https://www.rsc.org/images/entities/char_2009.gif) 1, matching with an experimentally observed ratio in ref. 30. To be consistent with plates observed in experiments,37 a stacking fault is built in the middle layer to create a divide between the {111} and {110} side facets. In this configuration, the 8 layers of {111} planes are stacked in an ABCABABC configuration.
1, matching with an experimentally observed ratio in ref. 30. To be consistent with plates observed in experiments,37 a stacking fault is built in the middle layer to create a divide between the {111} and {110} side facets. In this configuration, the 8 layers of {111} planes are stacked in an ABCABABC configuration.
To characterize the attachment mechanisms, we consider two different pathways for plate aggregation: a face-to-face pathway, in which plates aggregate on their large, triangular {111} facets and; a side-to-side pathway, in which plates match their {111} and {110} side facets. While our simulations allow for some variation of plate configurations within these two approach pathways, a complete sampling of all possible plate configurations is difficult in MD simulations of these relatively large systems. Thus, it is possible that these are not the exact pathways by which the Ag plates would aggregate. By limiting our calculations to two basic aggregation pathways, we can compare the propensity of the systems to attach in two possible end states.
As discussed in the ESI,† we use the first-principles-based metal–organic many-body (MOMB) force field38 to describe interactions in our system. We also included a potential to describe long-range vdW interactions between the Ag plates. To compare attachment from the side-to-side and face-to-face pathways, we calculate the potential of mean force (PMF) along these pathways using umbrella sampling39 and umbrella integration.40 Umbrella sampling is performed using the collective variables module in LAMMPS.41 Details of the PMF calculations are given in the ESI.†
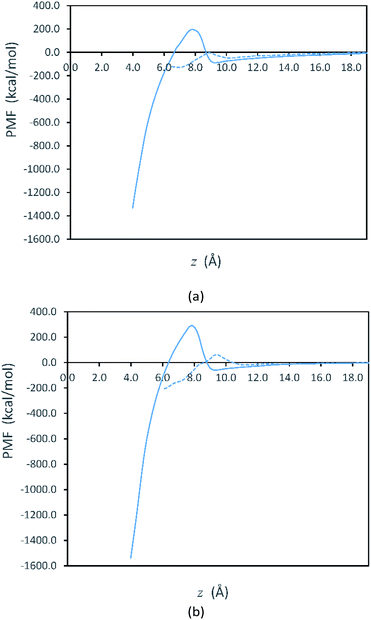
Fig. 2 shows free energy profiles from PMF calculations for side-to-side and face-to-face attachments in the vacuum systems. Here, we see that the PMF profiles are flat when the plates are sufficiently far apart. At these separations, the free energy is set to zero as the reference value for both systems. Although our initialization trajectories included plate separations beginning with z > 70 Å, we observed that the PMF is approximately constant (zero) for longer separations up to 25 Å. Thus, the values at larger separations are not shown in Fig. 2. For the plates to attach, they must overcome the free energy barriers shown in Fig. 2. After overcoming the free energy barrier, the plates proceed to attachment and the PMF decreases to a minimum. We note that the PMFs obtained in solvent, shown in Fig. S1 in the ESI,† are qualitatively similar to those in Fig. 2.
Fig. 2 represents the fact that the free energy minimum is significantly deeper for face-to-face attachment than it is for side-to-side attachment, reflecting the greater reduction of surface area for face-to-face attachment. However, while face-to-face attachment is favored thermodynamically, it is also evident from Fig. 2 that side-to-side attachment is favored kinetically, as the barrier for side-to-side attachment is significantly smaller than that for face-to-face attachment. Thus, our results indicate that the lateral attachment of Ag plates is driven by kinetics. The lower barrier for side-to-side attachment is consistent with observation of lateral OA for Ag nanoplates in experiments.30,31
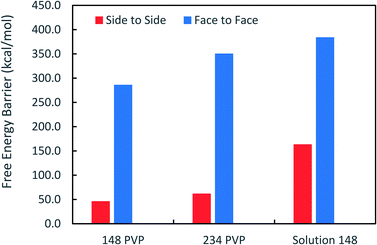
Fig. 3 shows that the free energy barriers for attachment in all of the systems studied. Here, we can see that increasing the number of PVP molecules leads to an increase in the free energy barriers for both attachment conformations in vacuum. These results are in agreement with experiments, which show that with increasing PVP concentration, small nanoplates continue to grow individually without aggregation.31 The free energy barriers for the solution-phase system are larger than those for the vacuum systems but are still consistent with the trend that we see in vacuum.
It has been suggested that OA occurs on facets that are the least protected by adsorbed capping molecules.23,28 The system that most exemplifies this idea is the plates with 234 PVP in vacuum. Fig. 1(b) shows top-down and side views of the PVP configurations surrounding a single plate with 234 PVP. Here, we see that the coverage of PVP on the face of the plate with 234 PVP molecules is significantly higher than its coverage of the sides of the plate. Concomitantly, the free energy barrier for the plates to aggregate on their faces is almost six times higher than the barrier for the sides (Fig. 3). Thus, for well-covered plates, it appears that the idea of facet-selective coverage can describe OA. However, it is less clear that this idea applies to the system with 148 PVP or for the system including solvent.
Similar to the 234-molecule system, the plates with 148 molecules in vacuum exhibit a free energy barrier for face-to-face aggregation that is six times higher than the barrier for side-to-side aggregation. However, the density differences between molecules adsorbed on the faces and sides are less obvious in Fig. 1(a). The two-dimensional density map in Fig. S2 in the ESI† shows that the PVP density is only slightly higher near the center of the face than it is on the sides for this system.
The system containing solvent shows the greatest discrepancy with the idea that OA occurs on facets that are the least protected by capping molecules. In solvent, the binding of PVP to the Ag nanocrystal facets is significantly weakened42 so that PVP does not completely cover all facets. Fig. S3 in the ESI† that indicates that a significant fraction of the PVP resides in the solution phase. Additionally, Fig. S3† shows that the density of PVP on the side facets is higher than that on the large, triangular facets for the solution-phase system. Despite these features, the barrier for face-to-face aggregation in the solution-phase system is just over two times larger than the barrier for side-to-side aggregation. Thus, another explanation is needed to describe the aggregation trends in these systems.
To understand the origins of the free energy barriers in Fig. 3, we observed successive snapshots of the plates as they approached each other. A sequence of snapshots of the plates covered with 148 PVP in vacuum is shown in Fig. 4. From animations based on these snapshots, it is apparent that there is a continuous expulsion of PVP from the inter-plate gap as the plates approach one another. PVP vacates the inter-plate gap in two ways: (1) it migrates to the neighboring surfaces of the aggregate; (2) it desorbs from the aggregate. In the vacuum systems, PVP tends to remain adsorbed to the plates (which is energetically favorable) and desorption is infrequent. Considering the vacuum systems, desorption is more frequent for the plates with 234 molecules than for those with 148 molecules. The aggregation mechanism in solvent is qualitatively similar to the mechanism in vacuum – though solvent must be expelled from the inter-plate gap together with PVP for aggregation to occur. Additionally, it was difficult to detect desorption due to the significant amount of PVP present in the solution phase and its facile equilibration with the plate surfaces.
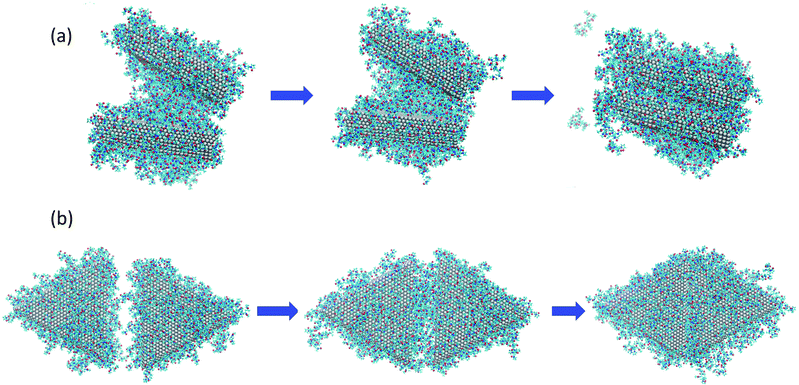 | ||
| Fig. 4 Sequence of images as nanoplates covered with 148 PVP molecules in vacuum aggregate for (a) the face-to-face configuration, at distances of z = 35.0, 25.0, and 7.9 Å going from left to right and; (b) the side-to-side configuration, at distances of z = 35.0, 25.0, and 9.0 Å, going from left to right. The right-most images in (a) and (b) are configurations for which free energy maxima are observed in Fig. 2(a). | ||
Based on the observed aggregation mechanism, we can qualitatively explain differences in the free energy barriers for side-to-side and face-to-face aggregation in the vacuum systems. Due to the relatively small area of the side facets, side-to-side attachment requires less molecular transport to evacuate the inter-particle gap than face-to-face attachment. Additionally, the relatively small number of PVP molecules from the sides tend to be easily accommodated on the large faces so that relatively few desorption events occur. We counted the number of PVP displaced to the vacuum at the end of side-to-side attachment and found that 12% of the PVP desorbed from the plate surfaces for the 148-molecule system and 16% desorbed for the 234-molecule system. These factors promote relatively low free energy barriers for side-to-side attachment.
In contrast, a relatively large number of PVP molecules needs to be relocated when plates aggregate face-to-face. These molecules need to pass from the gap to a side facet. If the PVP coverage is high, it is unlikely that they can be accommodated on the sides and they need to diffuse from the sides to a face that is not in the gap. If the PVP coverage is sufficiently high, not all of the gap molecules can fit on the non-gap faces and they desorb. For face-to-face aggregation, 15% of the PVP desorbed from the plate surfaces to the vacuum for the 148-molecule system and 18% desorbed for the 234-molecule system. The percentage of desorptions is higher for face-to-face than for side-to-side aggregation and higher for 234 molecules than for 148 molecules. Thus, the need for transport across the large face, diffusion around two edges, and possibly desorption promotes high free energy barriers for face-to-face attachment – especially when the PVP coverage is high.
We note that in the MOMB force field (as well as in experiment43), PVP binds somewhat more strongly to the relatively open {110} side facets than it does to the {111} facets that form the large triangular faces.38,42,44,45 However, with 234 molecules and to a lesser extent with 148 molecules in vacuum, the PVP coverage is too high for this selectivity to be evident. Thus, PVP covers all the facets – perhaps preferring the large {111} facets in second-layer adsorption for entropic reasons. In the solution-phase system, the facet selectivity of {110} becomes evident (see Fig. S3†), yet side-to-side aggregation is still preferred – though not by as much as in the vacuum systems.
Fig. 5 shows snapshots of single plates covered with PVP in EG solution. Here we see, consistent with Fig. S3,† that the coverage of PVP on the large triangular faces is sparse and much less dense than it seems from a side view of the plate. The greater apparent density in the side view in Fig. 5(a) results from the high PVP density on the sides of the plates that is evident in Fig. 5(b). Thus, as plates approach one another in a face-to-face configuration, PVP molecules bound to the side facets will hinder aggregation. Although selective aggregation might be more facile if certain facets are completely devoid of capping molecules while others are completely protected, our results imply that adsorbed capping molecules can potentially couple all the facets of both crystals when aggregation occurs. While the complete ramifications of our findings have yet to be explored, it seems likely that the mechanism observed here may have some generality for systems in which capping molecules bind relatively strongly to all nanocrystal surfaces and for which strong, directional nanocrystal forces (e.g., dipole–dipole interactions) are absent. We note that while this manuscript was in review, a similar mechanism was identified for the aggregation of spherical Au nanoparticles capped with thiol ligands.46 Together, these findings indicate the generality and utility of this mechanism.
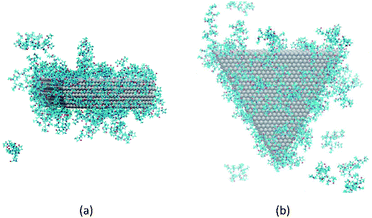 | ||
| Fig. 5 Configuration of PVP molecules around a nanoplate in EG solution. (a) A side view and (b) a top view. Solvent molecules are not shown, for clarity. | ||
Conclusions
In summary, MD simulations have revealed that the aggregation mechanism of PVP-covered triangular Ag nanoplates is one in which PVP capping molecules continuously diffuse around the aggregate and/or desorb to vacate the inter-particle gap so that aggregation can occur. Since the side facets of the plates contain less adsorbed PVP than the large, triangular faces, less transport is required to vacate the gap and the free energy barrier for side-to-side aggregation is lower. Our simulations demonstrate that an obvious facet-selective binding of capping molecules (e.g., all of the molecules bound to one type of facet and none bound to another) is not needed for capping molecules to direct OA. The insights from this work may be useful in designing processes to create two-dimensional plates for a variety of applications.36Conflicts of interest
There are no conflicts to declare.Acknowledgements
This work is funded by the Department of Energy, Office of Basic Energy Sciences, Materials Science Division, Grant DEFG02-07ER46414. TB acknowledges training provided by the Computational Materials Education and Training (CoMET) NSF Research Traineeship (grant number DGE-1449785). This work used the Extreme Science and Engineering Discovery Environment (XSEDE) supported by NSF/OCI-1053575.References
- P. W. Voorhees, J. Stat. Phys., 1985, 38, 231–252 CrossRef.
- V. K. Ivanov, P. P. Fedorov, A. Y. Baranchikov and V. V. Osiko, Russ. Chem. Rev., 2014, 83, 1204–1222 CrossRef CAS.
- J. J. De Yoreo, P. U. P. A. Gilbert, N. A. J. M. Sommerdijk, R. L. Penn, S. Whitelam, D. Joester, H. Zhang, J. D. Rimer, A. Navrotsky, J. F. Banfield, A. F. Wallace, F. M. Michel, F. C. Meldrum, H. Cölfen and P. M. Dove, Science, 2015, 349, aaa6760 CrossRef PubMed.
- B. Jin, Y. Wang, Z. Liu, A. France-Lanord, J. C. Grossman, C. Jin and R. Tang, Adv. Mater., 2019, 31, 1–6 Search PubMed.
- M. Jehannin, A. Rao and H. Cölfen, J. Am. Chem. Soc., 2019, 141, 10120–10136 CrossRef CAS PubMed.
- M. Niederberger and H. Cölfen, Phys. Chem. Chem. Phys., 2006, 8, 3271–3287 RSC.
- S. Yu, A. J. Sutherland, Q. Zhang and S. Liu, J. Mater. Chem., 2009, 19, 173–312 RSC.
- J. Zhang, F. Huang and Z. Lin, Nanoscale, 2010, 2, 18–34 RSC.
- W. Lv, W. He, X. Wang, Y. Niu, H. Cao, J. H. Dickerson and Z. Wang, Nanoscale, 2014, 6, 2531–2547 RSC.
- H. Ataee-Esfahani and S. E. Skrabalak, RSC Adv., 2015, 5, 47718–47727 RSC.
- K. A. Fichthorn, Chem. Eng. Sci., 2015, 121, 10–15 CrossRef CAS.
- R. L. Penn and J. F. Banfield, Geochim. Cosmochim. Acta, 1999, 63, 1549–1557 CrossRef CAS.
- R. L. Penn and J. F. Banfield, Science, 1998, 281, 969–971 CrossRef CAS PubMed.
- J. Lee, J. Yang, S. G. Kwon and T. Hyeon, Nat. Rev. Mater., 2016, 16034 CrossRef CAS.
- H. Zhang, J. J. De Yoreo and J. F. Banfield, ACS Nano, 2014, 8, 6526–6530 CrossRef CAS PubMed.
- H. Zhang and J. F. Banfield, CrystEngComm, 2014, 16, 1568–1578 RSC.
- H. Zhang and J. Banfield, J. Phys. Chem. Lett., 2012, 3, 2882–2886 CrossRef CAS.
- K. Yasui and K. Kato, J. Phys. Chem. C, 2012, 116, 319–324 CrossRef CAS.
- M. Alimohammadi and K. A. Fichthorn, Nano Lett., 2009, 9, 4198–4203 CrossRef CAS PubMed.
- P. Schapotschnikow, M. A. Van Huis, H. W. Zandbergen, D. Vanmaekelbergh and T. J. H. Vlugt, Nano Lett., 2010, 10, 3966–3971 CrossRef CAS PubMed.
- K. Yasui and K. Kato, J. Phys. Chem. C, 2015, 119, 24597–24605 CrossRef CAS.
- X. Zhang, Z. Shen, J. Liu, S. N. Kerisit, M. E. Bowden, M. L. Sushko, J. J. De Yoreo and K. M. Rosso, Nat. Commun., 2017, 8, 2–9 CrossRef PubMed.
- K. S. Cho, D. V. Talapin, W. Gaschler and C. B. Murray, J. Am. Chem. Soc., 2005, 127, 7140–7147 CrossRef CAS PubMed.
- J. H. Yu, J. Joo, M. P. Hyun, S. Il Baik, W. K. Young, C. K. Sung and T. Hyeon, J. Am. Chem. Soc., 2005, 127, 5662–5670 CrossRef CAS PubMed.
- D. Zitoun, N. Pinna, N. Frolet and C. Belin, J. Am. Chem. Soc., 2005, 127, 15034–15035 CrossRef CAS PubMed.
- A. Halder and N. Ravishankar, Adv. Mater., 2007, 19, 1854–1858 CrossRef CAS.
- W. K. Koh, A. C. Bartnik, F. W. Wise and C. B. Murray, J. Am. Chem. Soc., 2010, 132, 3909–3913 CrossRef CAS PubMed.
- C. Schliehe, B. H. Juarez, M. Pelletier, S. Jander, D. Greshnykh, M. Nagel, A. Meyer, S. Foerster, A. Kornowski, C. Klinke and H. Weller, Science, 2010, 74, 550–554 CrossRef PubMed.
- V. Yuwono, N. Burrows, J. Soltis and R. L. Penn, J. Am. Chem. Soc., 2010, 132, 2163–2165 CrossRef CAS PubMed.
- Z. Liu, H. Zhou, Y. S. Lim, J. H. Song, L. Piao and S. H. Kim, Langmuir, 2012, 28, 9244–9249 CrossRef CAS PubMed.
- M. H. Kim, D. K. Yoon and S. H. Im, RSC Adv., 2015, 5, 14266–14272 RSC.
- M. Raju, A. C. T. van Duin and K. A. Fichthorn, Nano Lett., 2014, 14, 1836–1842 CrossRef CAS PubMed.
- D. Li, M. H. Nielsen, J. R. I. Lee, C. Frandsen, J. F. Banfield and J. J. De Yoreo, Science, 2012, 336, 1014–1018 CrossRef CAS PubMed.
- Y. Qin and K. A. Fichthorn, Phys. Rev. E, 2006, 73, 020401 CrossRef PubMed.
- R. Sathiyanarayanan, M. Alimohammadi, Y. Zhou and K. A. Fichthorn, J. Phys. Chem. C, 2011, 115, 18983–18990 CrossRef CAS.
- Y. Chen, Z. Fan, Z. Zhang, W. Niu, C. Li, N. Yang, B. Chen and H. Zhang, Chem. Rev., 2018, 118, 6409–6455 CrossRef CAS PubMed.
- C. Lofton and W. Sigmund, Adv. Funct. Mater., 2005, 15, 1197–1208 CrossRef CAS.
- Y. Zhou, W. A. Saidi and K. A. Fichthorn, J. Phys. Chem. C, 2014, 118, 3366–3374 CrossRef CAS.
- G. M. Torrie and J. P. Valleau, J. Comput. Phys., 1977, 23, 187–199 CrossRef.
- J. Kästner and W. Thiel, J. Chem. Phys., 2005, 123, 144104 CrossRef PubMed.
- G. Fiorin, M. L. Klein and J. Hénin, Mol. Phys., 2013, 111, 3345–3362 CrossRef CAS.
- T. Balankura, X. Qi and K. A. Fichthorn, J. Phys. Chem. C, 2018, 122, 14566–14573 CrossRef CAS.
- Z. Chen, J. W. Chang, C. Balasanthiran, S. T. Milner and R. M. Rioux, J. Am. Chem. Soc., 2019, 141, 4328–4337 CrossRef CAS PubMed.
- W. A. Al-Saidi, H. Feng and K. A. Fichthorn, Nano Lett., 2012, 12, 997–1001 CrossRef CAS PubMed.
- W. A. Saidi, H. Feng and K. A. Fichthorn, J. Phys. Chem. C, 2013, 117, 1163–1171 CrossRef CAS.
- P. Guo and Y. Gao, Phys. Rev. Lett., 2020, 124, 066101 CrossRef PubMed.
Footnote |
| † Electronic supplementary information (ESI) available: Methods; potential of mean force; capping molecule density map. See DOI: 10.1039/d0na00124d |
| This journal is © The Royal Society of Chemistry 2020 |

