
 Open Access Article
 This Open Access Article is licensed under a Creative Commons Attribution-Non Commercial 3.0 Unported Licence
Improved conductivity and ionic mobility in nanostructured thin films via aliovalent doping for ultra-high rate energy storage†
Clayton T.
Kacica
 and
Pratim
Biswas
*
and
Pratim
Biswas
*
Aerosol and Air Quality Research Laboratory, Center for Aerosol Science and Engineering, Department of Energy, Environmental and Chemical Engineering, Washington University in St. Louis, 1 Brookings Drive, St. Louis, MO 63130, USA. E-mail: pbiswas@wustl.edu; Fax: +1-314-935-5464; Tel: +1-314-935-5548
First published on 16th April 2020
Abstract
A high-rate lithium ion battery electrode consisting of nanostructured copper-doped TiO2 films, synthesized using a single-step, template-free aerosol chemical vapor deposition technique, is reported herein. A narrowing of the band gap of the copper-doped films from 2.92 to 1.93 eV corresponds to a large increase in electronic conductivity, overcoming a major drawback of pristine TiO2 in electronic applications. Lithium-ion batteries using copper-doped films as the negative electrode exhibit improved charge retention at ultra-high charge rates, up to 50C. Additionally, over 2000 charge–discharge cycles at a rate of 10C, the copper-doped TiO2 electrodes display higher stable cycling capacities. Cyclic voltammetry (CV) and a galvanostatic intermittent titration technique (GITT) provide insight into the chemical diffusion of Li+ in the TiO2 matrix, with copper-doped TiO2 electrodes exhibiting an order of magnitude higher value in CV measurements over pristine TiO2. GITT provided the state-of-charge (SoC) resolved chemical diffusion coefficient of Li+ and suggests that a minimum value occurs at a moderate SoC of 60%, with values near the extremes being over two orders of magnitude higher. Both techniques indicate increased Li+ mobility due to copper-doping, supporting improved electrochemical performance in ultra-high rate battery testing.
1. Introduction
Next-generation lithium-ion batteries (LIBs) will be instrumental in many consumer products, ranging from electric vehicles (EVs) to handheld electronics.1–3 Improved battery technologies will be especially important for EVs, as the batteries used in EVs represent a significant portion of the vehicle cost.4,5 Current batteries experience capacity fade over time, reducing vehicle range and eventually necessitating costly replacement.6–8 Additionally, new battery technologies that permit fast charging are sought after to reduce charging time to be comparable with filling a tank with gas.9 The development of high-rate electrode materials with long lifetimes is of great interest.Titanium dioxide (TiO2) has received significant attention as an electrode material due to its high stability, rate performance, abundance, and low price.10–14 Additionally, the high charging–discharging potential of TiO2 inhibits the formation of Li dendrites and the growth of a solid-electrolyte interphase (SEI) layer, greatly reducing the possibility of short circuiting and significantly enhancing battery safety.15 Specifically, in comparison to other TiO2 polymorphs, TiO2's anatase crystal structure possesses a good balance of stability and theoretical capacity (335 mA h g−1).16–18 However, TiO2's relatively low intrinsic electronic conductivity and Li+ mobility significantly hinder its high-rate performance.19–21 A variety of TiO2 morphologies, such as solid particles,22 hollow particles,23 fibers,24 tubes,25 rods,26 and sheets,20 have been investigated, all of which have shorter Li+ diffusion lengths and enhanced 1-dimensional (1-D) charge transport. Recent work has focused on improving the intrinsic conductivity of TiO2 by modifying its electronic structure through aliovalent doping.27 Dopant ions may induce the formation of localized states in the band structure, narrowing the band gap and increasing the electrical conductivity.27–30 A variety of dopant metallic cations, such as Nb5+, Ta5+, Zn2+, Mo6+, and Cr3+, as well as non-metallic anions, such as N3−, S2−, and F−, have been shown to improve anatase TiO2's electrochemical performance.30–38 Additionally, the mechanism by which dopant ions improve performance has been investigated. A variety of synthetic routes have been utilized to create doped TiO2, including hydrothermal,39 sol–gel,40 microwave,41 atomic layer deposition,42 spray pyrolysis,43 and combustion44 techniques. However, many of these synthesis techniques do not allow direct control of the final electrode morphology because they require post-processing and slurry casting to prepare the electrode.
Aerosol chemical vapor deposition (ACVD) is capable of synthesizing nanostructured, oriented TiO2 films directly on current collectors in a single step, without the use of templates and post-processing.45 As seen in Fig. 1a, ACVD involves feeding a heated reaction chamber with a metal organic precursor, which undergoes thermal decomposition to nucleate metal oxide nanoparticles. These nanoparticles then grow through condensation and coagulation until they diffuse and deposit on the substrate, where they sinter. By controlling the rates of particle nucleation, growth, and deposition the morphology of the resultant film can be controlled.46,47 Previous studies have determined that a columnar morphology exhibits the most favorable electrical properties.48,49 As shown schematically in Fig. 1b, excellent electrical connection with the substrate is achieved due to the direct deposition, as well as enhanced electrical conductivity due to the 1-D charge transport. Additionally, materials with multiple components can be synthesized by simultaneously introducing multiple precursors into the reaction chamber.
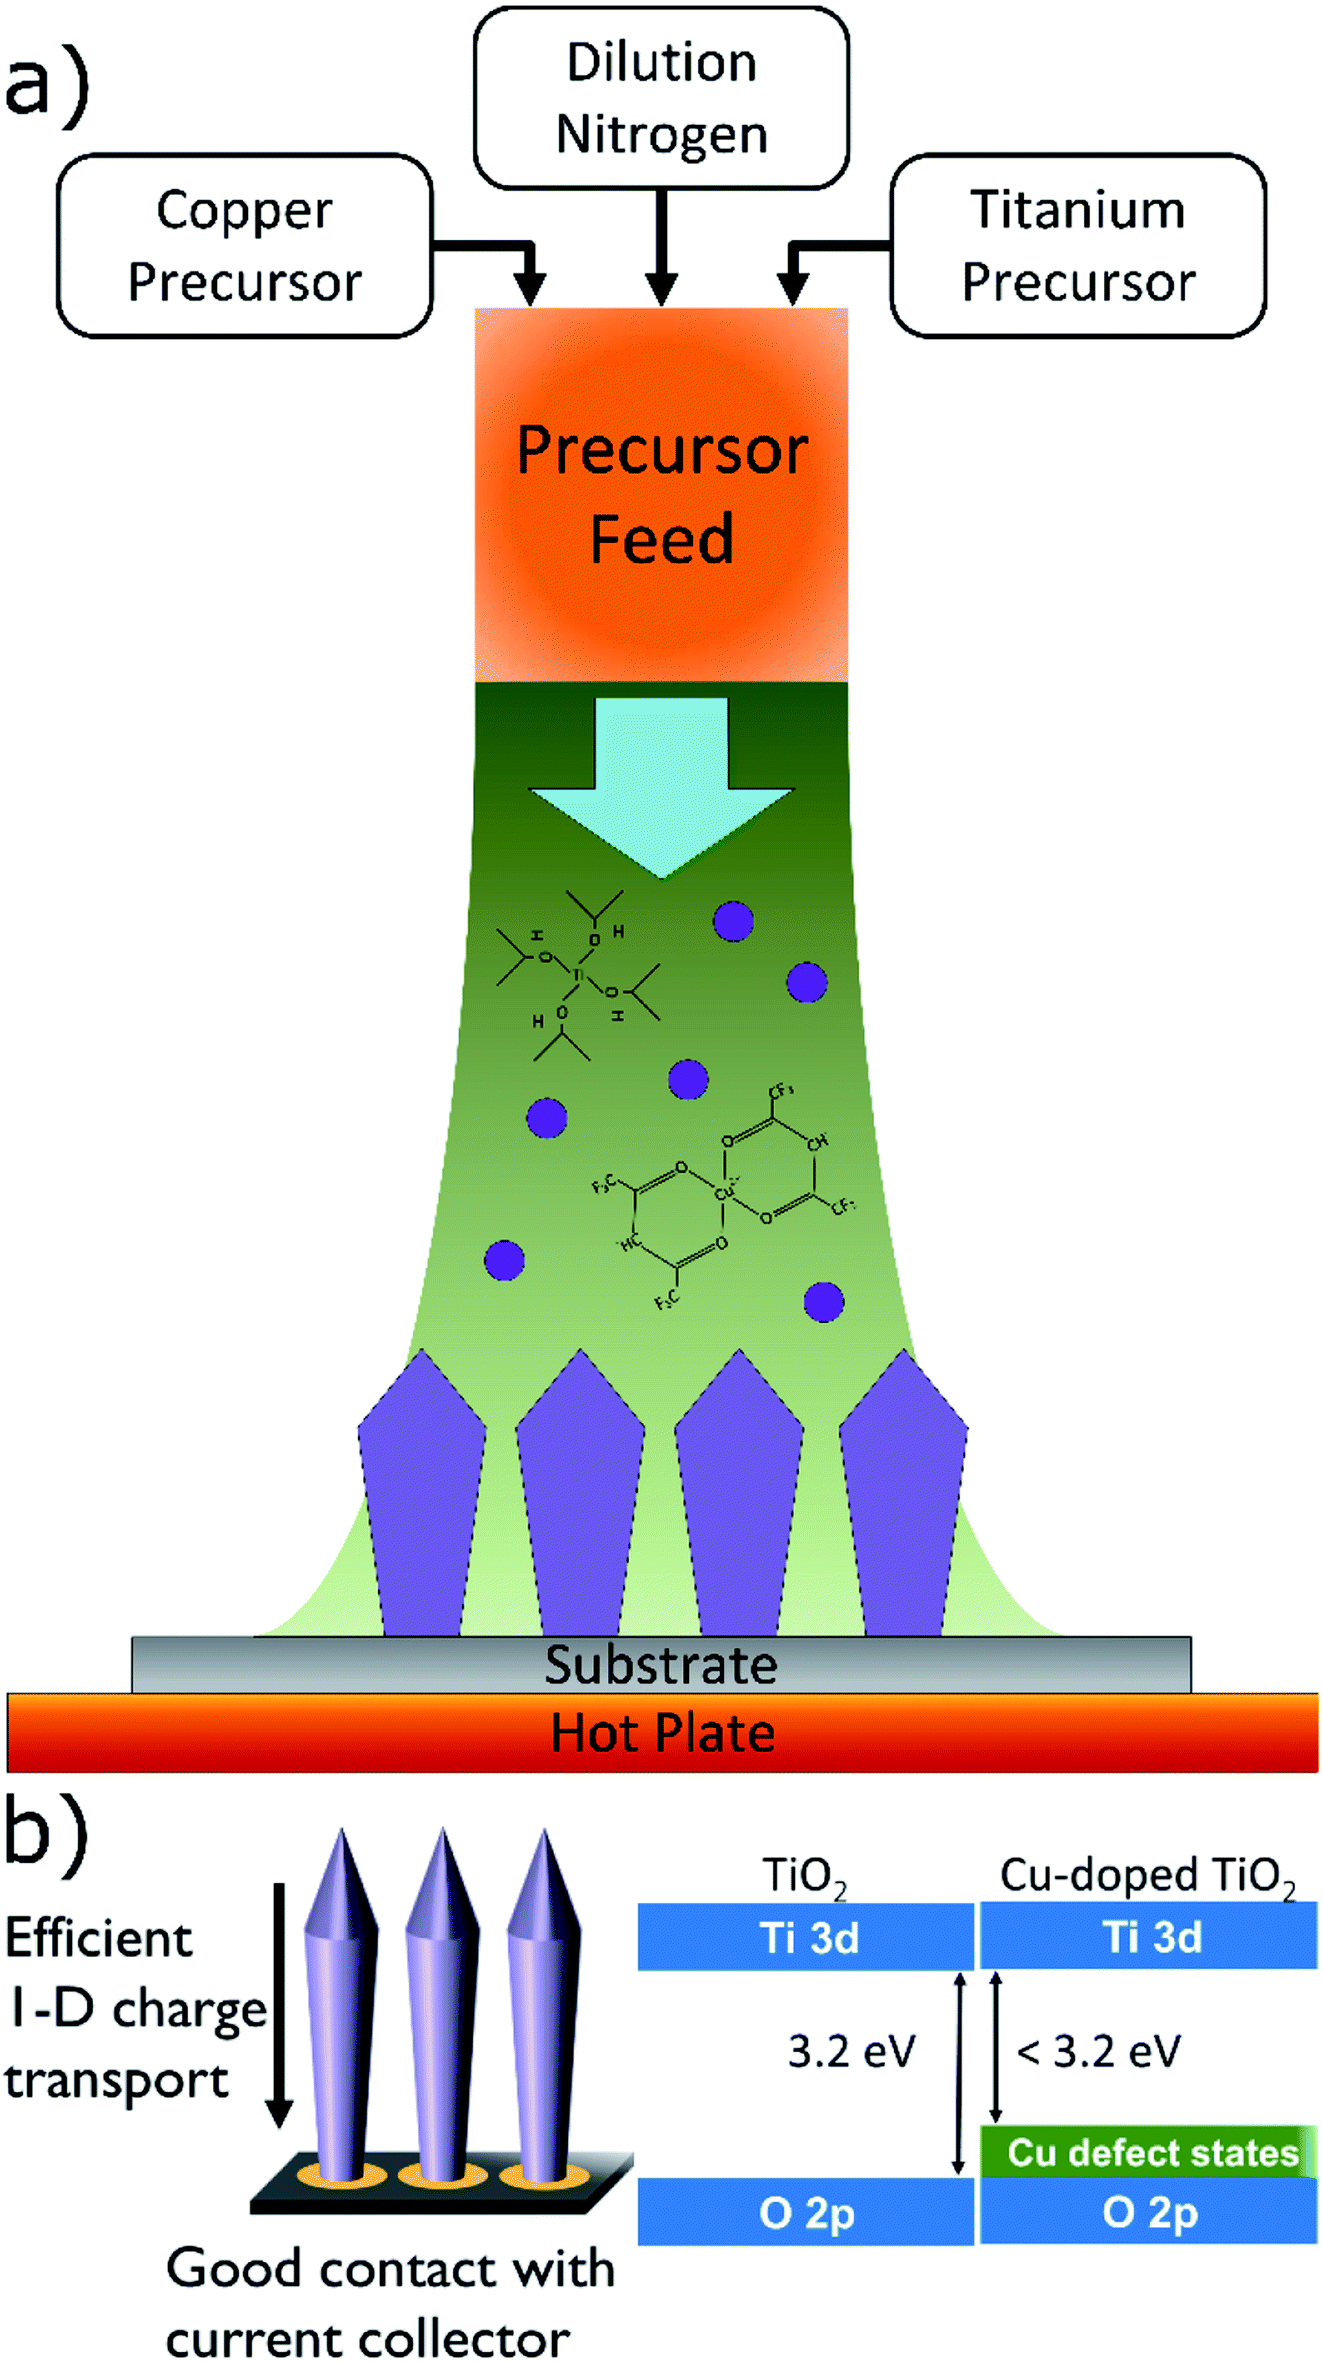 | ||
| Fig. 1 Schematics of (a) an aerosol vapor deposition reactor, (b) deposited film with columnar morphology (left), and localized states in the band gap of TiO2 introduced by dopant ions (right). | ||
Herein, we describe the use of an ACVD technique to synthesize nanostructured Cu-doped TiO2 electrodes. The electrochemical performance of the doped TiO2 electrodes is measured in high-rate LIB cycling experiments and cycle life assessment to determine the effect of Cu-doping. Finally, we investigate the chemical diffusion coefficient of Li+ in the TiO2 matrix using cyclic voltammetry and galvanostatic intermittent titration techniques.
2. Experimental
2.1 Aerosol chemical vapor deposition synthesis
ACVD was used to deposit nanostructured TiO2 and Cu-doped TiO2 films directly onto stainless steel, silicon, and borosilicate glass substrates. Titanium(IV) isopropoxide (TTIP) (>97%, Sigma-Aldrich) was used as a precursor to TiO2, and copper(II) hexafluoroacetylacetonate hydrate (Cu(hfa)) (Sigma-Aldrich) was used as a Cu source. During deposition both precursors were supplied as vapor via a bubbler, using N2 as the carrier gas. Using hot baths, the bubbler containing TTIP was heated to 30 °C, and the bubbler containing Cu(hfa) was heated to 40 °C using a hot water bath. All experiments used a reaction chamber substrate temperature of 500 °C and a deposition time of 30 minutes.For the deposition of Cu-doped TiO2 films, a flow rate of 450 cm3 of N2 was maintained to supply TTIP vapor to the reaction chamber. A separate flow of N2 supplying Cu(hfa) vapor was varied between 100 and 400 cm3 to obtain different dopant concentrations. These two gas streams were combined with a stream of dilution N2, to achieve a total flow rate of 900 cm3, prior to entering the reaction chamber.
To deposit undoped TiO2 films, a flow rate of 450 cm3 of N2 supplied TTIP vapor to the reaction chamber. This gas stream was diluted with an additional 450 cm3 of N2 prior to entering the reaction chamber.
Deposition was performed on silicon wafers or borosilicate glass for characterization. Stainless-steel (SS316, ESPI Metals) with a thickness of 25 um was used as a substrate for electrode fabrication for electrochemical characterization. The stainless-steel was punched into 15 mm discs, then weighed before and after deposition to determine the electrode mass.
2.2 Materials characterization
A scanning electron microscope (SEM) (Nova NanoSEM 230, FEI Co.) equipped with an energy dispersive X-ray spectrometer (EDS) was used to study the film morphology and elemental composition. Elemental compositions are reported as weight percentages. An X-ray photoelectron spectroscope (XPS) (PHI VersaProbe II, Physical Electronics) equipped with Ar sputtering was used to determine the chemical states present in the material. Film crystallinity was determined using an X-ray diffractometer (XRD) (d8 Advance Diffractometer, Bruker) with Cu Kα radiation (0.15418 nm wavelength) at 40 kV and 40 mA. An ultraviolet-visible spectrophotometer (UV-vis) (Shimadzu UV-2600) was used to determine the absorbance and band gap of the films.2.3 Electrochemical characterization
All electrochemical characterization was done using coin cell batteries (CR 2032), which were prepared in an Ar-filled glove box (Unilab, MBraun Inc.) with O2 and H2O concentrations controlled to <0.1 ppm. Each coin cell consisted of a Cu-doped TiO2 working electrode, a metallic lithium foil counter electrode, a porous separator (Celgard® 2400), and a liquid electrolyte of 1 M LiPF6 dissolved in ethylene carbonate/dimethyl carbonate (EC/DMC = 1![[thin space (1/6-em)]](https://www.rsc.org/images/entities/char_2009.gif) :1 v/v) (Sigma-Aldrich). Electrochemical testing was performed on a multichannel potentiostat/galvanostat (Bio-logic) at room temperature. The coin cell batteries were aged for 24 hours before testing. The cycling rate (C-rate) was determined based on TiO2's theoretical capacity of 335 mA h g−1, which corresponds to 1 Li+ stored per formula unit of TiO2. A rate of 1C was defined as a full charge being completed in 1 hour. Electrochemical measurements were performed in the potential range of 1.0–3.2 V. Long-term galvanostatic charging was performed at a rate of 10C for a total of 2000 cycles. Rate performance experiments were performed at rates varying from 1 to 50C, for 10 cycles at each rate. Cyclic voltammetry measurements were conducted at scan rates ranging from 0.05 to 2 mV s−1. Galvanostatic intermittent titration technique measurements were performed by applying 30 minute pulses of current at a rate equivalent to 0.2C separated by 30 minutes of open-circuit.
:1 v/v) (Sigma-Aldrich). Electrochemical testing was performed on a multichannel potentiostat/galvanostat (Bio-logic) at room temperature. The coin cell batteries were aged for 24 hours before testing. The cycling rate (C-rate) was determined based on TiO2's theoretical capacity of 335 mA h g−1, which corresponds to 1 Li+ stored per formula unit of TiO2. A rate of 1C was defined as a full charge being completed in 1 hour. Electrochemical measurements were performed in the potential range of 1.0–3.2 V. Long-term galvanostatic charging was performed at a rate of 10C for a total of 2000 cycles. Rate performance experiments were performed at rates varying from 1 to 50C, for 10 cycles at each rate. Cyclic voltammetry measurements were conducted at scan rates ranging from 0.05 to 2 mV s−1. Galvanostatic intermittent titration technique measurements were performed by applying 30 minute pulses of current at a rate equivalent to 0.2C separated by 30 minutes of open-circuit.
3. Results and discussion
3.1 Characterization of Cu-doped TiO2 material
Cu-doped TiO2 films with various doping levels were prepared by modifying the ratio of Cu(hfa) to TTIP in the reactor feed. Three different doping levels are considered, in addition to an undoped TiO2 reference. Elemental compositions were determined using XPS with Ar sputtering to a depth of 20 nm. Three regions of the XPS spectrum were investigated to determine the chemical states present: the Ti 2p peaks near 460 eV, O 1s peak near 530 eV, and Cu 2p peaks near 930 eV. Table 1 lists the elemental compositions based on these regions of the XPS spectra, with film compositions of 0%, 2.7%, 5.1%, and 7.2% Cu obtained for the control, low, medium, and high doping conditions. XPS spectra of the Ti 2p and Cu 2p regions are shown in Fig. 2. As seen in Fig. 2a, energies for the Ti 2p3/2 peak are located at 458.8, 459.0, 459.0, and 458.9 eV for the 0%, 2.7%, 5.1%, and 7.2% Cu films. These values are consistent with previously reported binding energies for Ti4+ in TiO2.28,50 The absence of a shift in the energies indicates that incorporating copper into TiO2 does not affect the oxidation state of Ti.| Cu(hfa) flow (cm3) | Doping level | Concentration (wt%) | ||
|---|---|---|---|---|
| Cu | Ti | O | ||
| 0 | None | — | 59.6 ± 0.9 | 40.4 ± 0.7 |
| 100 | Low | 2.7 ± 0.2 | 57.2 ± 0.7 | 40.1 ± 0.7 |
| 150 | Medium | 5.1 ± 0.3 | 55.1 ± 0.6 | 39.8 ± 0.6 |
| 400 | High | 7.2 ± 0.6 | 53.1 ± 0.5 | 39.7 ± 0.7 |
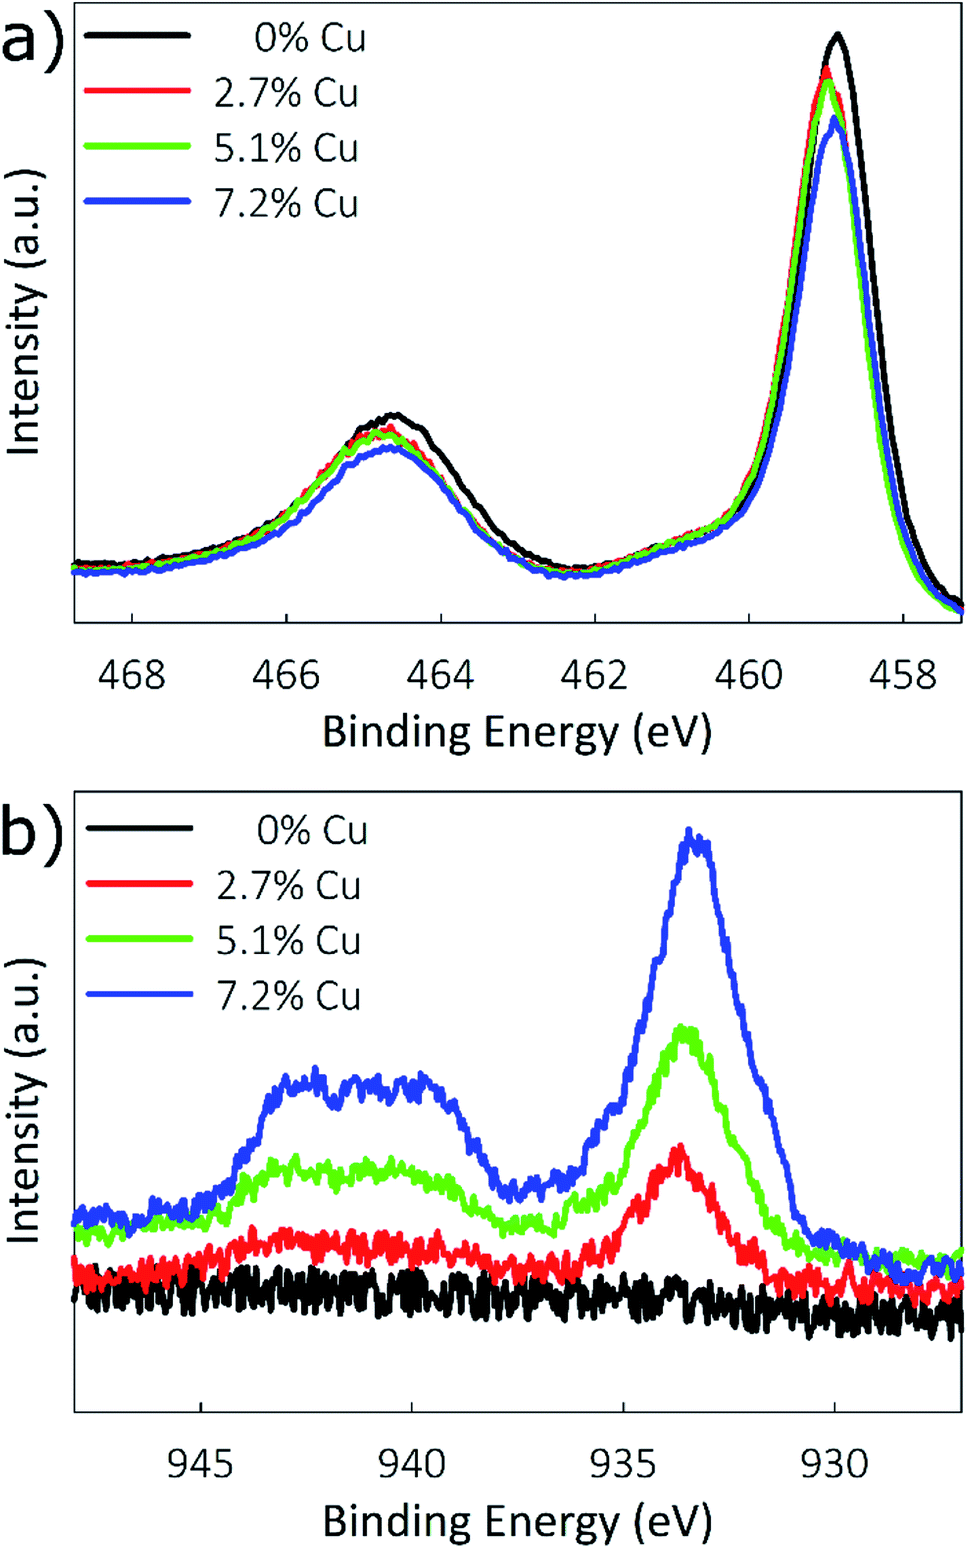 | ||
| Fig. 2 X-ray photoelectron spectra of the (a) TiO2 2p and (b) Cu 2p regions. | ||
XPS spectra for the Cu 2p3/2 region are shown in Fig. 2b, and were used to determine the oxidation state of Cu. Literature reports the placements of the 2p3/2 peaks for Cu0, Cu1+, Cu2+, and Cu(OH)2 at 932.6, 932.4, 933.6, and 934.7 eV, respectively.28 The placement of the 2p3/2 peaks in Fig. 2b mostly closely matches that of Cu2+, being located at 933.7, 933.7, and 933.5 eV for the 2.7%, 5.1%, and 7.2% Cu films, respectively. Additionally, another characteristic of Cu2+ is the presence of a satellite structure consisting of two shake-up peaks located at 6 and 8 eV above the prominent 2p3/2 peak, which is caused by ligand–metal 3d charge transfer. Because Cu0 and Cu1+ possess full 3d shells, for these oxidation states this distinctive charge transfer cannot occur.27 These Cu2+ shake-up satellites can be clearly seen between 939 and 943 eV in Fig. 2b.
Additionally, a modified Auger parameter (α′) was measured using the positions of the Cu 2p3/2 peak (BE) and the Cu LMM peak (KE) to better distinguish between Cu oxidation states. Calculated as,
| α′ = BE (Cu 2p3/2) + KE (Cu LMM), | (1) |
The morphology of the synthesized films was determined using SEM to image the film cross-section. Fig. 3a–d show that the nanostructured TiO2 and doped TiO2 films retain a columnar morphology for all samples up to 5.1% Cu, and transition to a granular–columnar mix is observed at 7.2% Cu. Based on previous studies, the columnar films provide superior electrochemical performance.45 Film height was measured to be between 2.2 and 2.5 μm, and the column width between 200 and 250 nm.
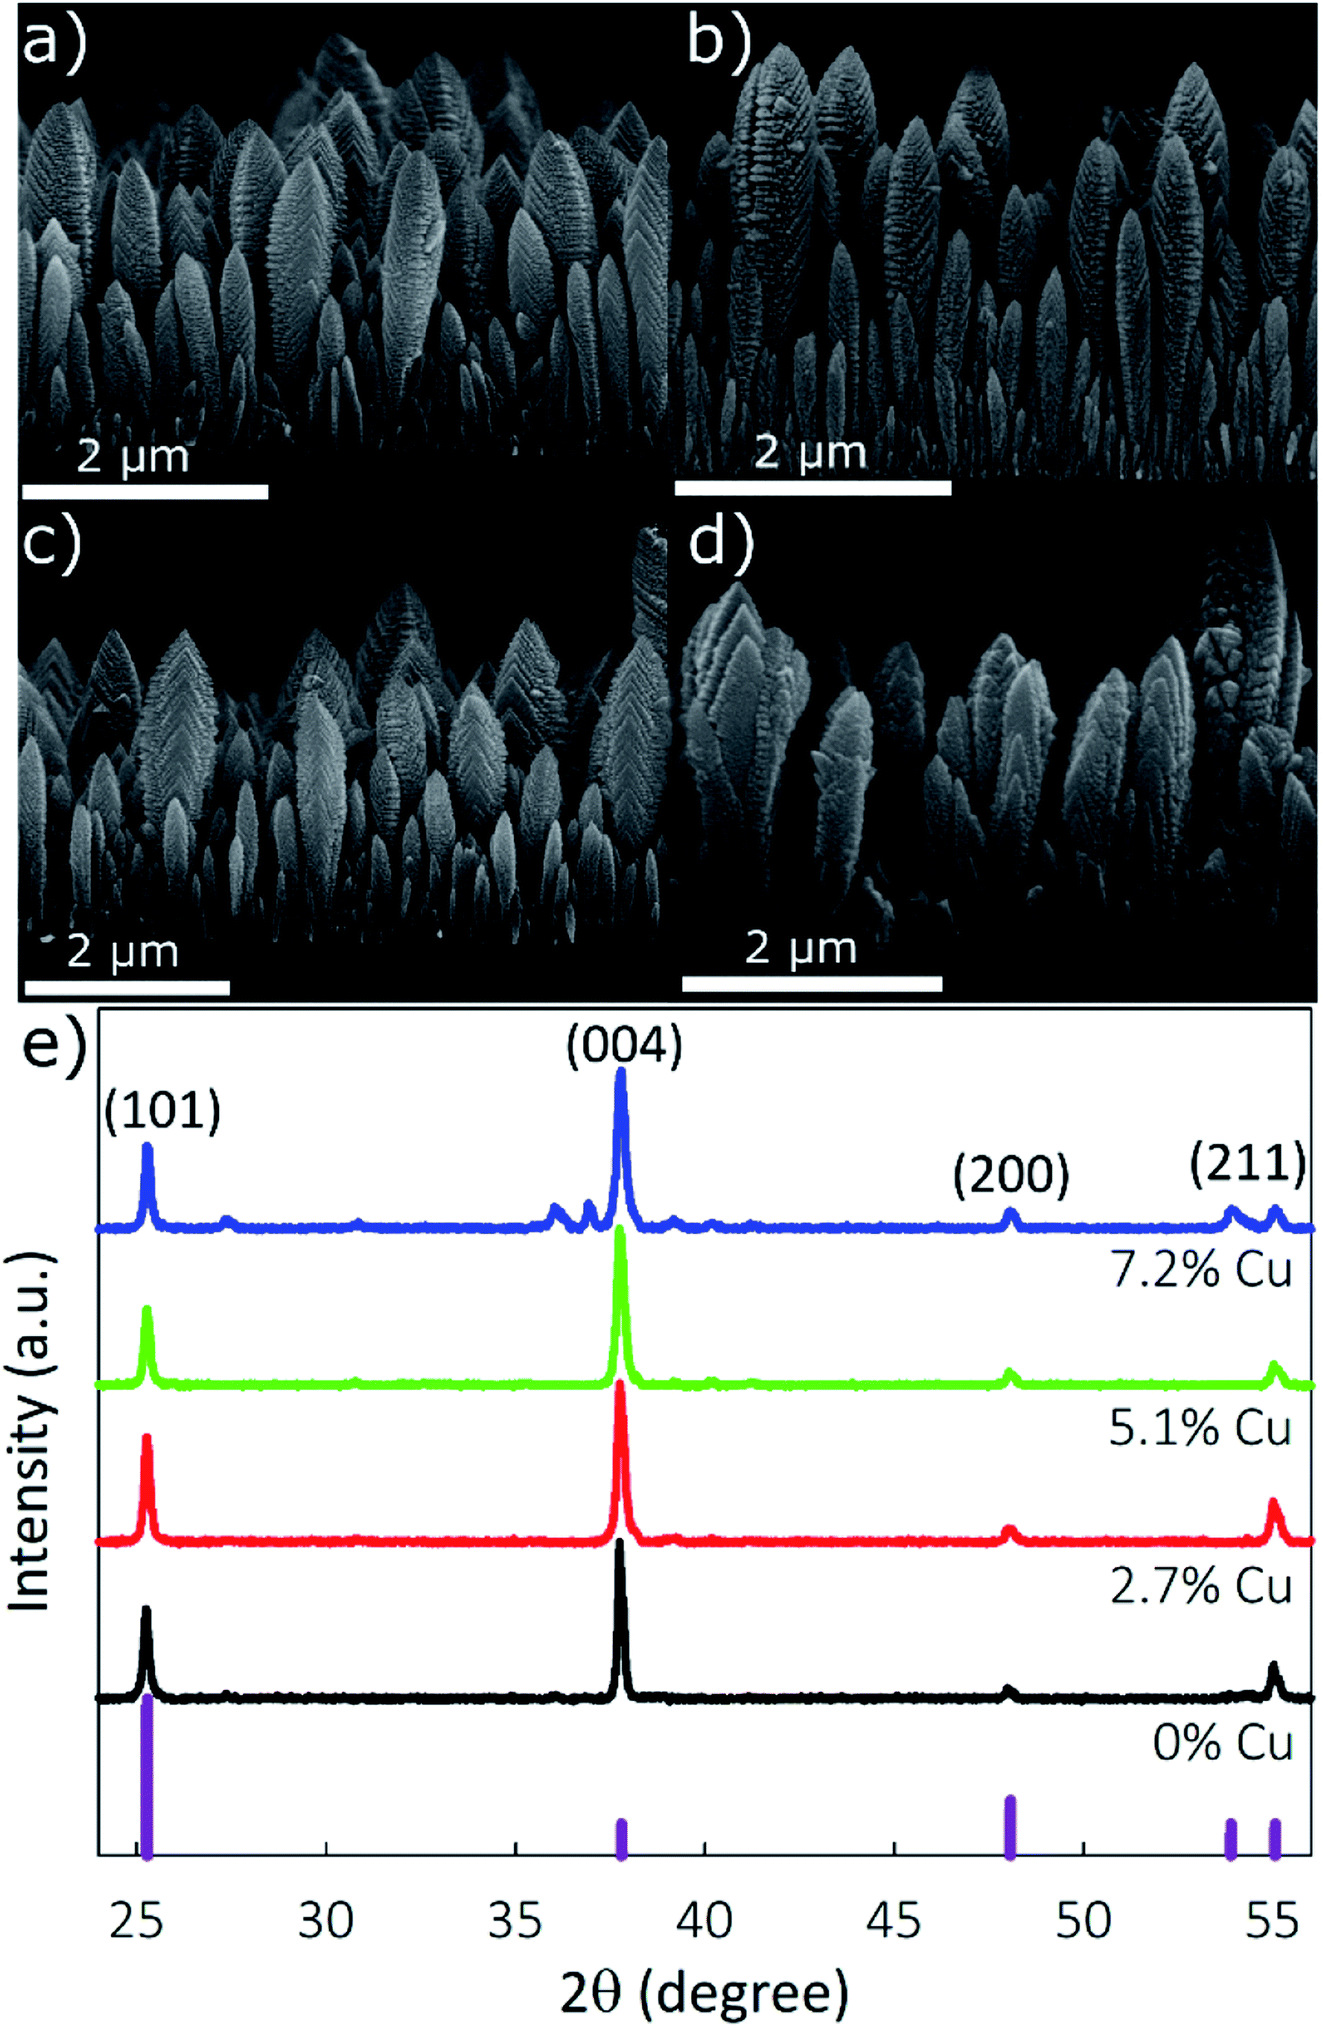 | ||
| Fig. 3 Scanning electron microscopy images of (a) 0%, (b) 2.7%, (c) 5.1%, and (d) 7.2% Cu-doped TiO2. (e) X-ray diffraction patterns of (bottom to top) 0%, 2.7%, 5.1%, and 7.2% Cu-doped TiO2 nanostructured films. | ||
The film's crystallinity, determined using XRD, is shown in Fig. 3e. Peaks located at 2θ values of 25.26°, 37.74°, 47.98°, and 55.02° correspond to the (101), (004), (200), and (211) planes of anatase TiO2, JCPDS card no. 21-1272. For the 2.7% or 5.1% Cu samples, no peaks suggesting the formation of crystalline copper species are observed, supporting the XPS results indicating that Cu is internally doped in the TiO2 lattice. Due to the similar ionic radii of Ti and Cu (rTi = 0.68 Å; rCu = 0.72 Å), Ti can be substituted by Cu without generating significant tension in the anatase structure. Minimal peak shifts are observed due to the incorporation of Cu, with calculated lattice parameters a and c changing from 0.3792 and 0.9525 nm, respectively, for pristine-TiO2 to 0.3794 and 0.9534 nm, respectively, for the 7.2% Cu sample. The XRD spectra of the 7.2% Cu sample have distinct peaks at 27.60°, 36.06°, 36.92°, and 52.98° which are not present in other films, showing the loss of pure-phase crystallinity due to the formation of impurities. The peaks located at 27.60 and 36.06 can be indexed to the (110) and (101) planes of rutile TiO2 (ICSD: 00-021-1276), while the peaks at 36.92° and 52.98° correspond to the (002) and (020) planes of CuO.
The poor electronic conductivity of TiO2 is one drawback to its use as a battery electrode. The use of nanostructured 1-D structures increases the apparent conductivity by restricting charge transport to a single dimension. It has been shown that aliovalent doping of TiO2 also leads to increased conductivity.51 As a semiconductor, the band gap of TiO2 is closely tied to its conductivity: a narrower band gap indicates higher conductivity. However, due to the 1-D nature of this material standard conductivity measurement techniques may not give accurate results, necessitating difficult single-column measurements. Alternatively, band gap energies can be readily determined using optical techniques. Band gap energies calculated from the absorbance spectra obtained through UV-vis spectrometry are shown in Fig. 4a. A Tauc plot was generated from the absorbance data, using the following equation:52
| f(α) = (αhν)1/n, | (2) |
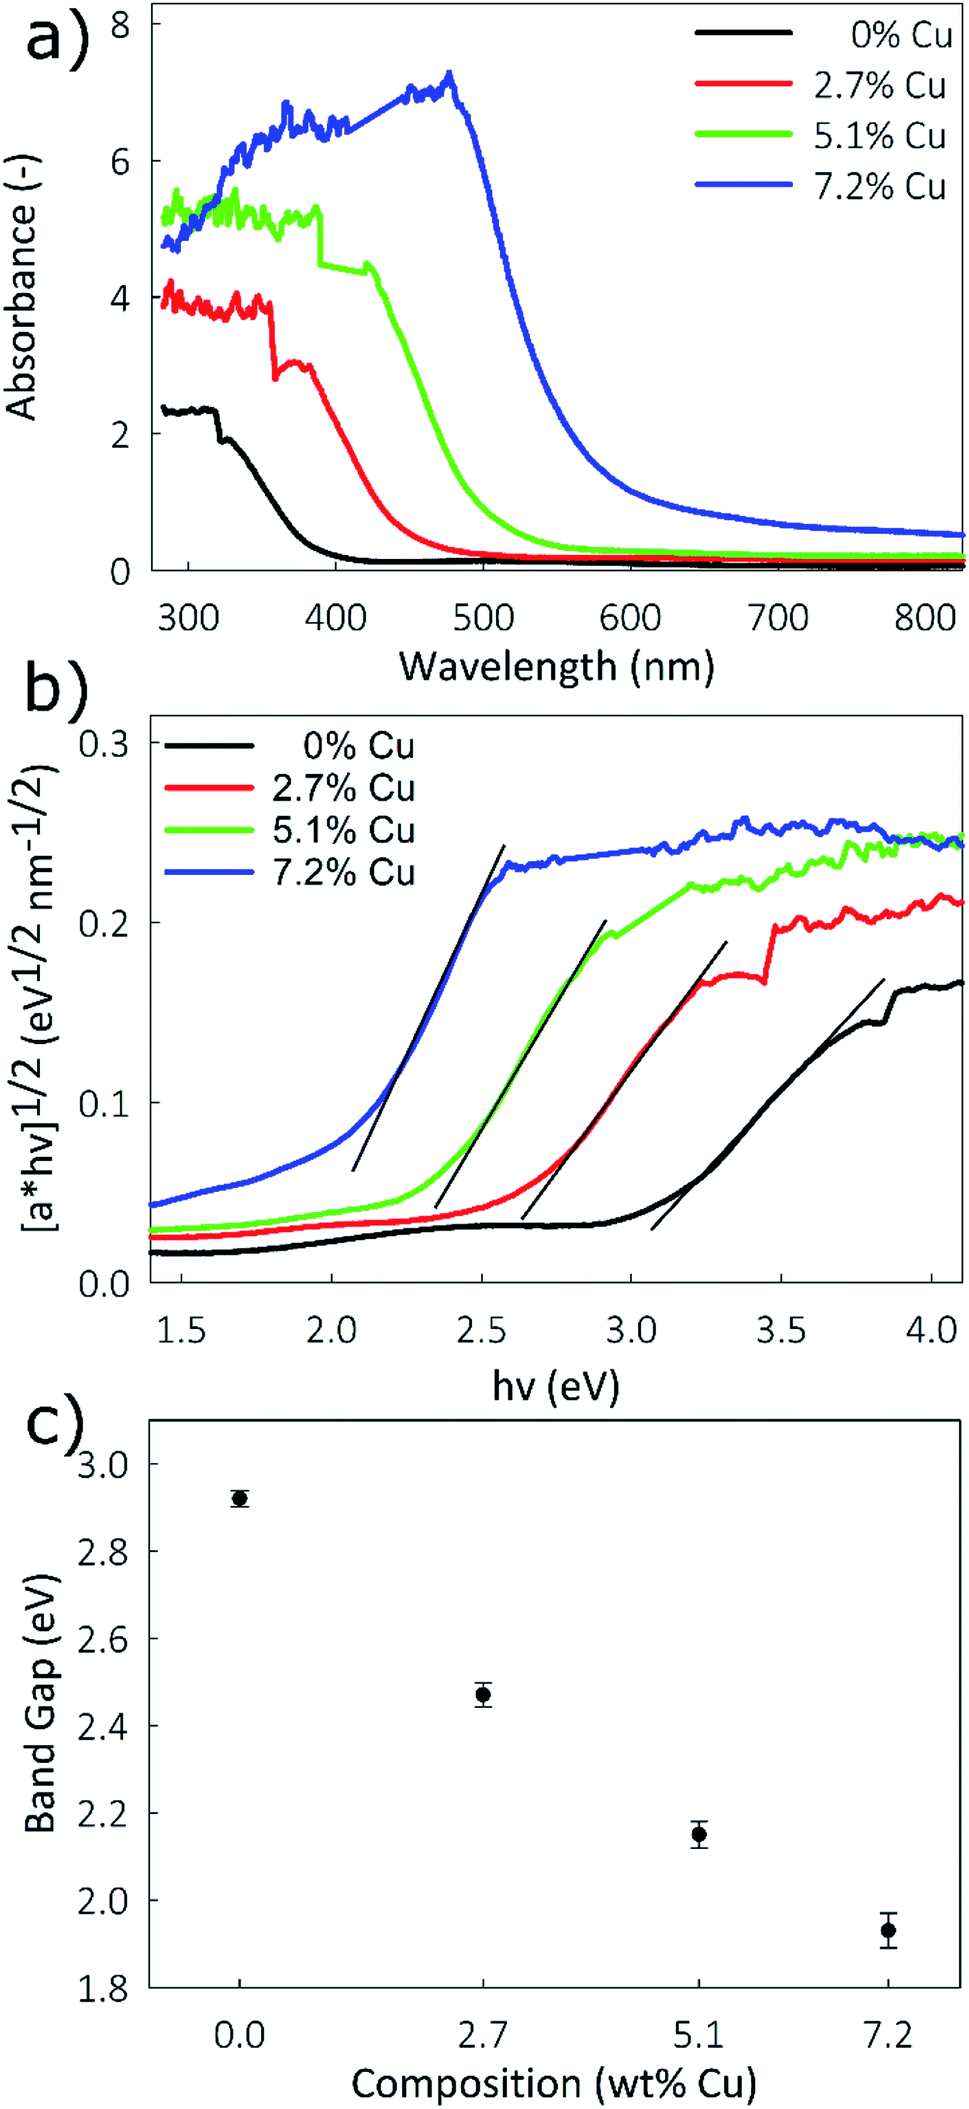 | ||
| Fig. 4 (a) UV-vis spectra, (b) Tauc plot of [αhν]1/2vs. hν, and (c) plot of band gap vs. Cu concentration for the Cu-doped TiO2 nanostructured films. | ||
3.2 Electrochemical characterization
Electrochemical characterization was performed using a Li-ion half-cell configuration, with the synthesized films acting as the negative electrode and metallic lithium foil acting as the counter electrode. As shown in Fig. 5, galvanostatic cycling was performed in the potential window of 1.0–3.2 V at charge rates between 1 and 50C to determine the rate performance of the material. At a charge rate of 1C, the capacity of the film is largely independent of the Cu concentration, with gravimetric capacities between 180 and 183 mA h g−1. This finding implies that at low charge rates the conductivity of TiO2 is not a limiting factor and the full material is utilized. At a charge rate of 10C, the doped samples perform notably better than the undoped control. The 0%, 2.7%, 5.1%, and 7.2% Cu films, respectively, retain 71.4%, 80.9%, 87.5% and 74.6% of the capacity obtained at 1C, showing that the benefit of Cu-doping has a more pronounced effect at higher rates. This benefit is clear at a charge rate of 50C, with the 5.1% Cu film retaining 70.7% of its 1C capacity, compared to the undoped TiO2 film's 39.4% retention. After cycling at a rate of 50C, the charge rate was lowered to 5C, and all films recovered over 98% of their previous capacities at 5C. This recovery indicates that the material can be discharged at high rates without causing a large irreversible capacity loss. Based on the conductivity results, the 7.2% Cu electrode would be expected to have the best performance, due to its higher conductivity. However, the lower degree of crystallinity shown by XRD may be inhibiting its performance. This improved rate performance due to Cu-doping could be due to either a reduction in the Li+ diffusion barrier due to increased width of the diffusion path, or due to the increase in electrical conductivity of the film. As XRD showed little shift in the peak positions due to Cu-doping, indicating that the lattice parameters of the anatase crystal structure remain unchanged, it is believed that the enhanced conductivity is the dominant factor.56 | ||
| Fig. 5 Rate performance for charge rates between 1 and 50C. | ||
To determine the electrode's longevity, long-term galvanostatic cycling was performed at a constant charge rate of 10C for 2000 cycles in the potential window of 1.0–3.2, and the results are shown in Fig. 6. Capacity losses between 8 and 10% are observed in the first 100 cycles for all samples, after which the capacities largely stabilize. Final capacities of 78.7, 101.5, 117.1, and 92.1 mA h g−1 are obtained for the 0%, 2.7%, 5.1%, and 7.2% Cu films, representing retentions of 72%, 77.9%, 82.6%, and 79.4% of the first cycle capacity, respectively. Coulombic efficiencies, ESI Fig. S1,† are higher for the 2.7% and 5.1% Cu films than for the undoped control and remain above 99.8% over 2000 cycles.
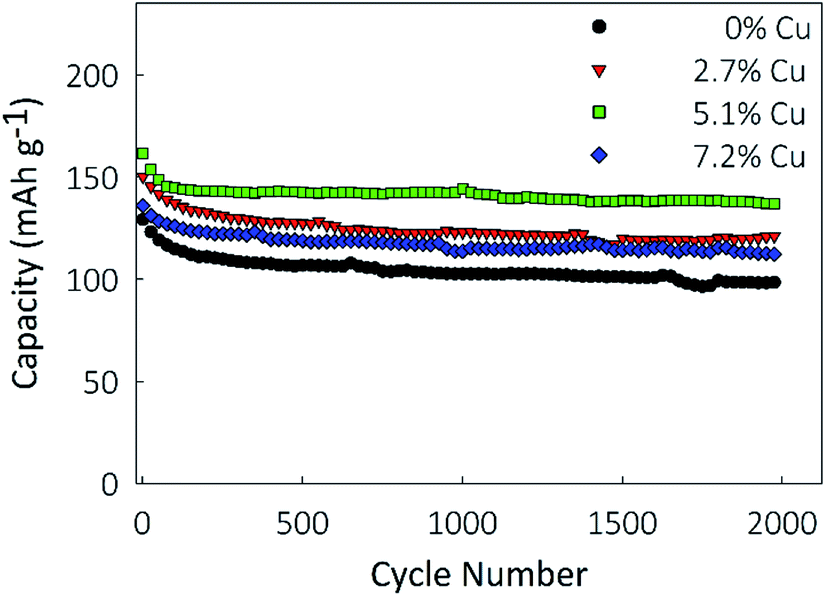 | ||
| Fig. 6 Cycling performance at a rate of 10C over 2000 cycles. | ||
The corresponding charge/discharge curves are presented in ESI Fig. S2a–d† for the 1st, 10th, 100th, and 1000th cycle for each of the electrodes. A similar profile is observed for each of the samples over the entirety of the 1000 cycles represented, further supporting the high stability of the electrodes over many cycles. For all four electrodes, a similar drop of capacity is seen between the 10th and 100th cycle. However, for the 5.1% Cu electrode, shown in ESI Fig. S2c,† the 100th and 1000th cycle profiles overlap closely, indicating negligible capacity fade between the cycles. These findings show that the incorporation of Cu into TiO2 measurably improved the cyclability and lifetime of the nanostructured films, and significantly improved their capacity.
Electrochemical impedance spectroscopy, ESI Fig. S3,† performed on the 0% and 5.1% Cu electrodes shows a decrease in the bulk resistance of the Cu containing electrode, confirming an increase in the conductivity of the material.
3.3 Lithium diffusivity measurements
Lithium diffusion during the intercalation and deintercalation processes is of vital importance for high-rate battery performance. Cyclic voltammetry (CV) measurements, shown in Fig. 7a for the 5.1% Cu film, were performed at scan rates ranging from 0.05 to 2 mV s−1 for all films. Only two peaks, corresponding to the oxidation and reduction reactions, are seen, indicating that no side reactions occur during these reactions. By increasing the scan rate, larger peak currents are obtained and the potential difference between the oxidation and reduction peaks is increased. A similar trend is observed for the other films as well. A Randles–Sevcik plot was constructed by relating the peak current density to the square root of the scan rate, as shown in Fig. 7b. The linear trend suggests diffusion-limited oxidation and reduction reactions. Additionally, increased copper concentrations lead to higher peak current densities for both the oxidation and reduction reactions. The chemical diffusion coefficient was determined from the Randles–Sevcik equation,57 | (3) |
 | (4) |
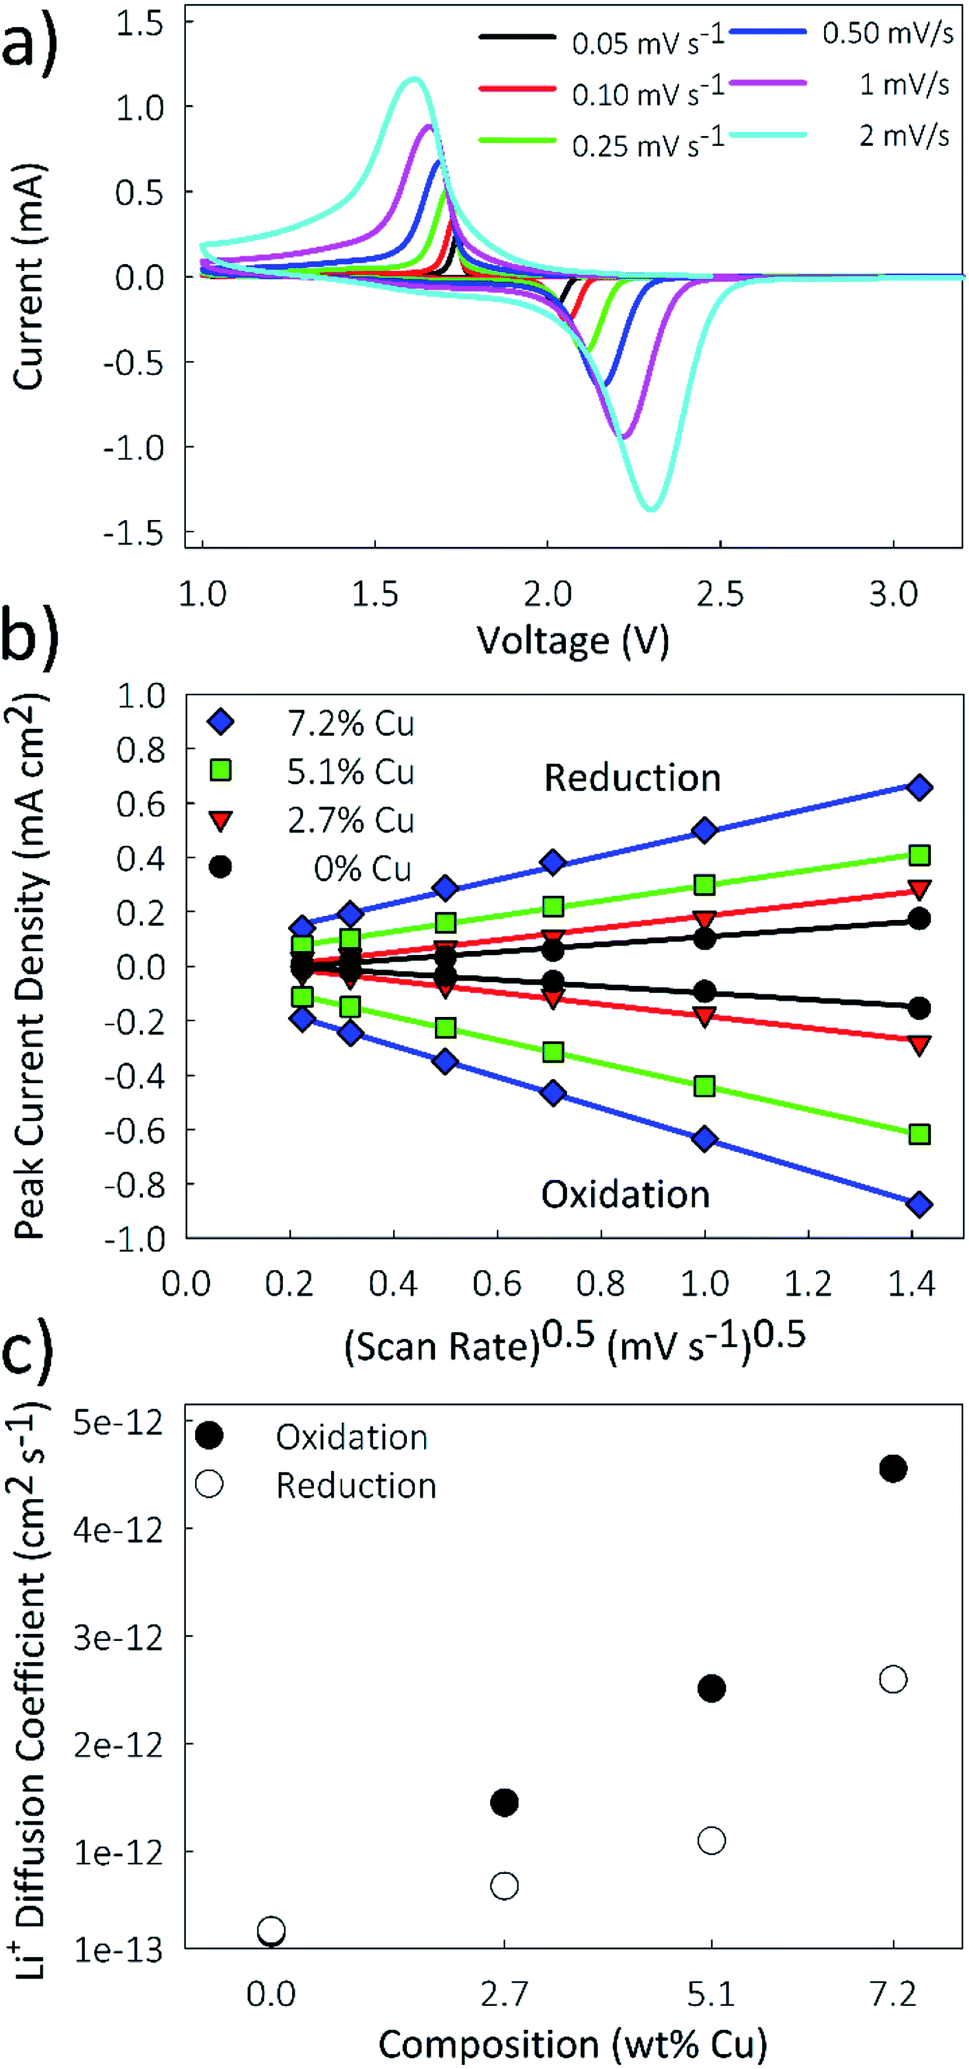 | ||
| Fig. 7 (a) Cascade cyclic voltammograms at scan rates ranging from 0.05 to 2 mV s−1, (b) Randles–Sevcik plot of peak current density vs. (scan rate)1/2, and (c) plot of lithium diffusion coefficient vs. Cu concentration for the Cu-doped TiO2 nanostructured films. | ||
| Sample | D ox (cm2 s−1) | D red (cm2 s−1) |
|---|---|---|
| 0% Cu | 2.41 × 10⁻¹³ | 2.66 × 10⁻¹³ |
| 2.7% Cu | 1.45 × 10⁻¹² | 6.79 × 10⁻¹³ |
| 5.1% Cu | 2.51 × 10⁻¹² | 1.10 × 10⁻¹² |
| 7.2% Cu | 4.56 × 10⁻¹² | 2.59 × 10⁻¹² |
A limitation to calculating chemical diffusion coefficients using CV measurements is that they are state-of-charge (SoC) averaged values. However, the diffusivity may change during the charging process due to differences in the lithiated and unlithiated TiO2. Alternatively, a galvanostatic intermittent titration technique (GITT) measurement allows for diffusion coefficients to be calculated as a function of SoC. This technique involves applying pulses of constant current separated by open-circuit intervals, while measuring the cell potential. From this, the chemical diffusion coefficient can be calculated as59
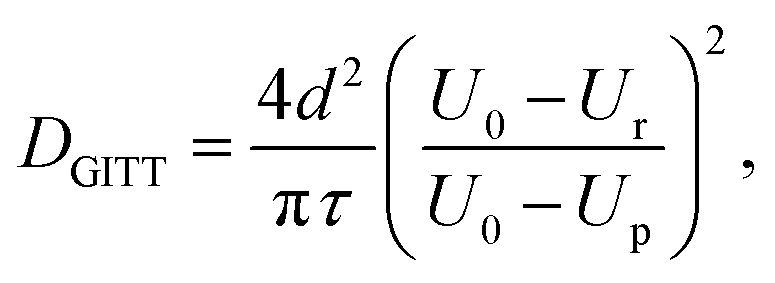 | (5) |
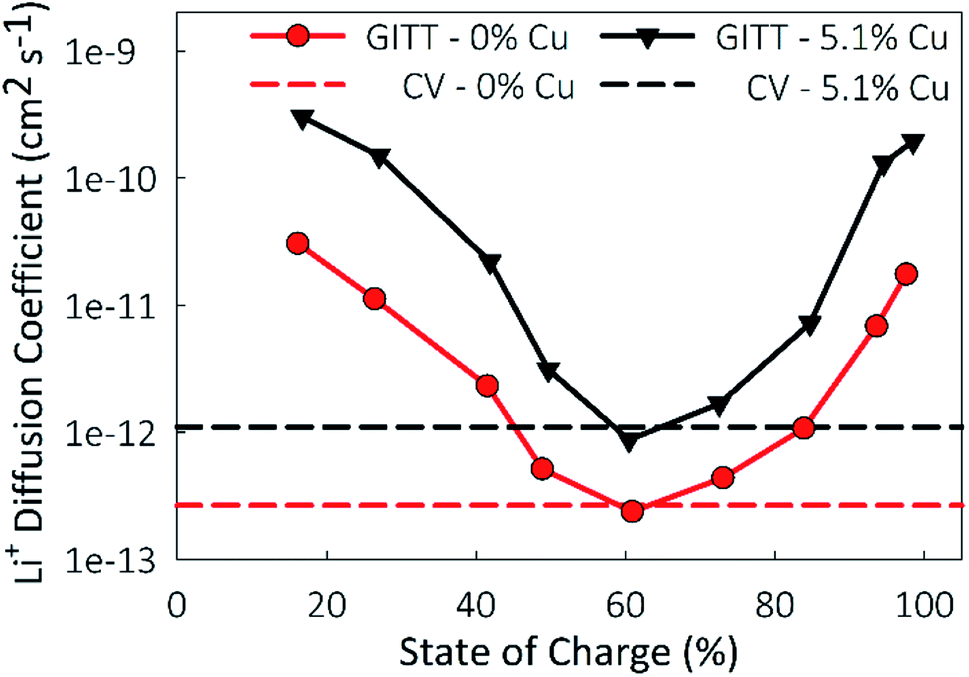 | ||
| Fig. 8 State of charge dependent lithium diffusion coefficients plotted for the undoped TiO2 control and the 5.1% Cu-doped TiO2 material. State of charge independent lithium diffusion coefficients calculated from CV measurements included for reference. | ||
4. Conclusions
Nanostructured Cu-doped TiO2 films with a columnar morphology were synthesized using an aerosol chemical vapor deposition technique, with compositions up to 7.2% Cu. It is confirmed that Cu is incorporated as Cu2+ by replacing Ti, while retaining a highly crystalline anatase structure. UV-vis measurements indicate a narrowing of the band gap with increased Cu concentrations, from 2.92 eV for pristine TiO2 to 1.93 eV for the 7.2% Cu film. Since electrical conductivity is directly related to band gap, this narrowing indicates an increase in conductivity for the Cu-doped films. Electrochemical measurements show that the Cu-doped films performed consistently better as the anode in high-rate lithium ion battery testing than pristine TiO2. Stable performance was seen at ultra-high rates up to 50C, with up to 70% capacity retention for the Cu-doped films compared to only 40% for the pristine TiO2 compared to their respective capacities at 1C. Long-term cycling showed remarkable stability over 2000 cycles at a rate of 10C, with higher capacities observed for the Cu-doped films. Lithium diffusion measurements were performed with both CV and GITT techniques and showed improved chemical diffusion coefficients for Li+ ions for the Cu-doped films. As Li+ diffusion is coupled with electron mobility, the increased conductivity of the Cu-doped films may be the factor permitting faster Li+ diffusion. Enhanced high-rate performance of Cu-doped TiO2 films is attributed to the increase in Li+ mobility resulting from an increase in film conductivity.Conflicts of interest
There are no conflicts of interest to declare.Acknowledgements
The authors are thankful for the funding from the National Science Foundation Division of Materials Research, grant no. DMR 1806147. The use of the Bruker d8 Advance X-ray diffractometer in the Earth and Planetary Sciences at Washington University in St. Louis is supported by the National Science Foundation, grant no. NSF EAR-1161543.References
- M. A. Hannan, M. M. Hoque, A. Mohamed and A. Ayob, Renewable Sustainable Energy Rev., 2017, 69, 771–789 CrossRef.
- A. Mahmoudzadeh Andwari, A. Pesiridis, S. Rajoo, R. Martinez-Botas and V. Esfahanian, Renewable Sustainable Energy Rev., 2017, 78, 414–430 CrossRef.
- R. Schmuch, R. Wagner, G. Hörpel, T. Placke and M. Winter, Nat. Energy, 2018, 3, 267–278 CrossRef CAS.
- B. Nykvist and M. Nilsson, Nat. Clim. Change, 2015, 5, 329 CrossRef.
- O. Schmidt, A. Hawkes, A. Gambhir and I. Staffell, Nat. Energy, 2017, 2, 17110 CrossRef.
- A. Cordoba-Arenas, S. Onori, Y. Guezennec and G. Rizzoni, J. Power Sources, 2015, 278, 473–483 CrossRef CAS.
- Y. Zou, X. Hu, H. Ma and S. E. Li, J. Power Sources, 2015, 273, 793–803 CrossRef CAS.
- L. Su, J. Zhang, C. Wang, Y. Zhang, Z. Li, Y. Song, T. Jin and Z. Ma, Appl. Energy, 2016, 163, 201–210 CrossRef CAS.
- N. Nitta, F. Wu, J. T. Lee and G. Yushin, Mater. Today, 2015, 18, 252–264 CrossRef CAS.
- A. R. Armstrong, G. Armstrong, J. Canales, R. García and P. G. Bruce, Adv. Mater., 2005, 17, 862–865 CrossRef CAS.
- V. Subramanian, A. Karki, K. I. Gnanasekar, F. P. Eddy and B. Rambabu, J. Power Sources, 2006, 159, 186–192 CrossRef CAS.
- J. Xu, C. Jia, B. Cao and W. F. Zhang, Electrochim. Acta, 2007, 52, 8044–8047 CrossRef CAS.
- Y. Ren, Z. Liu, F. Pourpoint, A. R. Armstrong, C. P. Grey and P. G. Bruce, Angew. Chem., 2012, 124, 2206–2209 CrossRef.
- T. Xia, W. Zhang, W. Li, N. A. Oyler, G. Liu and X. Chen, Nano Energy, 2013, 2, 826–835 CrossRef CAS.
- Y. Zhang, Y. Meng, K. Zhu, H. Qiu, Y. Ju, Y. Gao, F. Du, B. Zou, G. Chen and Y. Wei, ACS Appl. Mater. Interfaces, 2016, 8, 7957–7965 CrossRef CAS PubMed.
- N. Li, G. Liu, C. Zhen, F. Li, L. Zhang and H.-M. Cheng, Adv. Funct. Mater., 2011, 21, 1717–1722 CrossRef CAS.
- Z. Yang, D. Choi, S. Kerisit, K. M. Rosso, D. Wang, J. Zhang, G. Graff and J. Liu, J. Power Sources, 2009, 192, 588–598 CrossRef CAS.
- H. Usui, Y. Domi, S. Yoshioka, K. Kojima and H. Sakaguchi, ACS Sustainable Chem. Eng., 2016, 4, 6695–6702 CrossRef CAS.
- L. Kavan, Chem. Rec., 2012, 12, 131–142 CrossRef CAS PubMed.
- H.-C. Wang, C.-Y. Fan, Y.-P. Zheng, X.-H. Zhang, W.-H. Li, S.-Y. Liu, H.-Z. Sun, J.-P. Zhang, L.-N. Sun and X.-L. Wu, Chem.–Eur. J., 2017, 23, 9666–9673 CrossRef CAS PubMed.
- U. Diebold, Surf. Sci. Rep., 2003, 48, 53–229 CrossRef CAS.
- A. K. Rai, L. T. Anh, J. Gim, V. Mathew, J. Kang, B. J. Paul, J. Song and J. Kim, Electrochim. Acta, 2013, 90, 112–118 CrossRef CAS.
- H. Ren, R. Yu, J. Wang, Q. Jin, M. Yang, D. Mao, D. Kisailus, H. Zhao and D. Wang, Nano Lett., 2014, 14, 6679–6684 CrossRef CAS PubMed.
- D. Pham-Cong, J.-H. Kim, S.-Y. Jeong, J. H. Choi, J. Kim and C.-R. Cho, Electrochem. Commun., 2015, 60, 204–207 CrossRef CAS.
- J. Brumbarov and J. Kunze-Liebhäuser, J. Power Sources, 2014, 258, 129–133 CrossRef CAS.
- Y.-M. Jiang, K.-X. Wang, X.-X. Guo, X. Wei, J.-F. Wang and J.-S. Chen, J. Power Sources, 2012, 214, 298–302 CrossRef CAS.
- J. Su, Z. Li, Y. Zhang, Y. Wei and X. Wang, RSC Adv., 2016, 6, 16177–16182 RSC.
- G. Colón, M. Maicu, M. C. Hidalgo and J. A. Navío, Appl. Catal., B, 2006, 67, 41–51 CrossRef.
- M. Amirsalehi and M. Askari, J. Mater. Sci.: Mater. Electron., 2018, 29, 13068–13076 CrossRef CAS.
- A. J. Gardecka, M. Lübke, C. F. Armer, D. Ning, M. V. Reddy, A. S. Williams, A. Lowe, Z. Liu, I. P. Parkin and J. A. Darr, Solid State Sci., 2018, 83, 115–121 CrossRef CAS.
- Z. Ali, S. N. Cha, J. I. Sohn, I. Shakir, C. Yan, J. M. Kim and D. J. Kang, J. Mater. Chem., 2012, 22, 17625–17629 RSC.
- T. V. Thi, A. K. Rai, J. Gim, S. Kim and J. Kim, J. Alloys Compd., 2014, 598, 16–22 CrossRef CAS.
- Z. Bi, M. P. Paranthaman, B. Guo, R. R. Unocic, H. M. Meyer III, C. A. Bridges, X.-G. Sun and S. Dai, J. Mater. Chem. A, 2014, 2, 1818–1824 RSC.
- Y. Yang, X. Ji, M. Jing, H. Hou, Y. Zhu, L. Fang, X. Yang, Q. Chen and C. E. Banks, J. Mater. Chem. A, 2015, 3, 5648–5655 RSC.
- J. Ni, S. Fu, C. Wu, J. Maier, Y. Yu and L. Li, Adv. Mater., 2016, 28, 2259–2265 CrossRef CAS PubMed.
- Y. Ma, B. Ding, G. Ji and J. Y. Lee, ACS Nano, 2013, 7, 10870–10878 CrossRef CAS PubMed.
- Y. Tanaka, H. Usui, Y. Domi, M. Ohtani, K. Kobiro and H. Sakaguchi, ACS Appl. Energy Mater., 2019, 2, 636–643 CrossRef CAS.
- H. Usui, Y. Domi, K. Takama, Y. Tanaka and H. Sakaguchi, ACS Appl. Energy Mater., 2019, 2, 3056–3060 CrossRef CAS.
- M. Nasir, S. Bagwasi, Y. Jiao, F. Chen, B. Tian and J. Zhang, Chem. Eng. J., 2014, 236, 388–397 CrossRef CAS.
- U. G. Akpan and B. H. Hameed, Appl. Catal., A, 2010, 375, 1–11 CrossRef CAS.
- J. Niu, P. Lu, M. Kang, K. Deng, B. Yao, X. Yu and Q. Zhang, Appl. Surf. Sci., 2014, 319, 99–106 CrossRef CAS.
- K. Vasu, M. B. Sreedhara, J. Ghatak and C. N. R. Rao, ACS Appl. Mater. Interfaces, 2016, 8, 7897–7901 CrossRef CAS PubMed.
- T. Boningari, S. N. R. Inturi, M. Suidan and P. G. Smirniotis, Chem. Eng. J., 2018, 339, 249–258 CrossRef CAS.
- P. Wang, G. Zhao, Y. Liu and Y. Lu, Appl. Catal., A, 2017, 544, 77–83 CrossRef CAS.
- T. S. Chadha, A. M. Tripathi, S. Mitra and P. Biswas, Energy Technol., 2014, 2, 906–911 CrossRef CAS.
- W.-J. An, E. Thimsen and P. Biswas, J. Phys. Chem. Lett., 2010, 1, 249–253 CrossRef CAS.
- W.-J. An, D. D. Jiang, J. R. Matthews, N. F. Borrelli and P. Biswas, J. Mater. Chem., 2011, 21, 7913–7921 RSC.
- K. Haddad, A. Abokifa, S. Kavadiya, T. S. Chadha, P. Shetty, Y. Wang, J. Fortner and P. Biswas, CrystEngComm, 2016, 18, 7544–7553 RSC.
- C. T. Kacica, L. S. Wang, T. S. Chadha and P. Biswas, Energy Technol., 2018, 6, 1966–1974 CrossRef CAS.
- T. Aguilar, J. Navas, R. Alcántara, C. Fernández-Lorenzo, J. J. Gallardo, G. Blanco and J. Martín-Calleja, Chem. Phys. Lett., 2013, 571, 49–53 CrossRef CAS.
- C. N. R. Rao, J. Phys. Chem. Lett., 2015, 6, 3303–3308 CrossRef CAS.
- M. B. Bouzourâa, Y. Battie, A. En Naciri, F. Araiedh, F. Ducos and N. Chaoui, Opt. Mater., 2019, 88, 282–288 CrossRef.
- G. Konstantatos and E. H. Sargent, Nat. Nanotechnol., 2010, 5, 391 CrossRef CAS PubMed.
- H. A. Ahmed, S. I. Abu-Eishah, A. I. Ayesh and S. T. Mahmoud, J. Phys.: Conf. Ser., 2017, 869, 012027 CrossRef.
- H. S. Park, D. H. Kim, S. J. Kim and K. S. Lee, J. Alloys Compd., 2006, 415, 51–55 CrossRef CAS.
- H. Usui, Y. Domi, S. Ohnishi and H. Sakaguchi, ACS Appl. Nano Mater., 2019, 2, 5360–5364 CrossRef CAS.
- L. Li, J. Zhang, Y. Zou, W. Jiang, W. Lei and Z. Ma, J. Electroanal. Chem., 2019, 833, 573–579 CrossRef CAS.
- T. Xia, W. Zhang, J. Murowchick, G. Liu and X. Chen, Nano Lett., 2013, 13, 5289–5296 CrossRef CAS PubMed.
- W. Jayawardana, C. L. Carr, D. Zhao and E. H. Majzoub, J. Electrochem. Soc., 2018, 165, A2824–A2832 CrossRef CAS.
Footnote |
| † Electronic supplementary information (ESI) available: Additional electrochemical characterization. See DOI: 10.1039/d0na00160k |
| This journal is © The Royal Society of Chemistry 2020 |