 Open Access Article
Au nano-urchins enabled localized surface plasmon resonance sensing of beta amyloid fibrillation†
Radhika V.
Nair
 a,
Pae Jian
Yi
 a,
Parasuraman
Padmanabhan
 b,
Balázs
Gulyás
 b and
V. M.
Murukeshan
 *a
*a
aCenter for Optical and Laser Engineering (COLE), School of Mechanical and Aerospace Engineering, Nanyang Technological University (NTU), 639798, Singapore. E-mail: mmurukeshan@ntu.edu.sg
bLee Kong Chian School of Medicine, Nanyang Technological University, 639798, Singapore
First published on 17th March 2020
Abstract
Early stage detection of neurodegenerative diseases such as Alzheimer's disease (AD) is of utmost importance, as it has become one of the leading causes of death of millions of people. The gradual intellectual decline in AD patients is an outcome of fibrillation of amyloid beta 1–42 (Aβ1–42) peptides in the brain. In this paper, we present localized surface plasmon resonance (LSPR) based sensing of Aβ1–42 fibrillation using Au nano-urchins. Strongly localized field confinement at the spiky nanostructures of nano-urchin surfaces enables them to detect very low concentrations of Aβ1–42. In addition, the LSPR peak of Au nano-urchins, which is very sensitive to ambient conditions, shows significant responses at different fibrillation stages of Aβ1–42. Reduction in LSPR peak intensity with an increase in the fibrillation is chosen as the sensing parameter here. This paper in this context provides LSPR based highly sensitive, label-free and real-time sensing of Aβ1–42 fibrillation that is highly advantageous compared to the existing techniques which require binding additives or fluorescent biomarkers.
Alzheimer's disease (AD) is a neurodegenerative disorder caused due to the cerebral accumulation of neurotoxic amyloid beta (Aβ) oligomers.1,2 Rapid aggregation of Aβ1–42, which is a protein abundant in the central nervous system of humans, results in the formation of soluble oligomers known as amyloid β-derived diffusible ligands (ADDLs).3 Proteolytic activities of β and γ secretase on amyloid proteins lead to the formation of Aβ1–42 fibrils which trigger the onset of AD.4 Clinical symptoms of AD such as memory loss and personality changes appear only in the progressed stage of Aβ1–42 fibrillation.5 At this stage the disease becomes acute and medication may not have a positive impact on the patient. Hence it is crucial to detect Aβ1–42 fibrillation at a very early stage. Recently various biosensing and bioimaging techniques have been developed for the detection of such chronic diseases.6,7 Computerized tomography (CT) scan, positron emission tomography (PET) and magnetic resonance imaging (MRI) are the brain imaging techniques currently used to detect various biochemical changes in the brain.8–10 These approaches suffer from the disadvantage that they work only after the progression of the disease. Enzyme-linked immunosorbent assay and optical dye (Thioflavin T and Congo Red) binding are the other techniques used for the study of kinetics of Aβ1–42 fibrillation.11,12 These techniques also have disadvantages such as non-specific binding, low stability and cross-reactivity.13 As a result, these techniques are susceptible to false-positive results. Fluorescence resonance energy transfer (FRET) is also frequently used for the study of amyloid beta kinetics.14,15 The efficiency of FRET depends hugely on the distance between the binding sites and on the covalent or mechanical linking of proteins with the donor and acceptor molecules.16 Hence FRET requires proper understanding of the covalent modification of proteins and careful examination which makes the technique time consuming and complex.
Various optical techniques using photonic crystals, quantum dots, fluorescence correlation spectroscopy etc. have been reported for the real time monitoring and imaging of beta amyloid fibrillation.17–19 Nanoscale structures are reported to be highly significant in biosensing applications.20,21 Recently, metal nanoparticles have become extremely significant in biosensing research owing to the generation of surface plasmon resonances (SPR).22–26 Due to the high sensitivity of SPR towards local environmental changes, it serves as a feasible candidate for biosensing and imaging applications.27,28 Apart from high sensitivity, SPR based sensing provides real-time and label-free sensing of biomolecules.29,30 Metal nanoparticles can be used directly in the assay without any binding additive or fluorescent biomarkers. Metal nanoparticles have been used by various groups for sensing different fibrillation stages of Aβ1–42.31–33 Metal nanostructures with patterned nano features are also used for various bio applications.34 In this paper we present the study of fibrillation kinetics of Aβ1–42 using Au nano-urchins. Au nano-urchins have various advantages over spherical metal nanoparticles. The sharp spiky morphology of urchins provides larger surface area for the binding of Aβ1–42 monomers than spherical particles.35 In addition, the sharp tips of the spiky structures over the surface provide stronger localized field enhancement giving rise to better sensitivity towards trace level sensing. Various applications of Au nano-urchins such as in electrochemical biosensors for the detection of genetically modified DNA, melamine sensors, gas sensors and SERS sensors have been reported so far.36–41 Here, we introduce a novel application of Au nano-urchins where each stage of Aβ1–42 fibrillation can be sensed based on the intensity of localized surface plasmon resonance (LSPR). Au urchins are observed to be sensitive to nano-molar concentration of Aβ1–42 while metal nanospheres are sensitive to millimolar or micromolar concentrations of Aβ1–42.42
We performed finite difference time domain (FDTD) simulations to prove the localized electric field enhancement in Au nano-urchins compared to Au nano-spheres. A mesh size of 0.2 nm was used in simulations. Au nano-spheres and nano-urchins of diameter 100 nm were modelled using Lumerical software. Separation between the particles is 5 nm in all the simulations. These nanostructures were then excited with a Gaussian source of 633 nm wavelength. Frequency domain field monitors were used for the study of electric field distribution around the structures. Fig. 1(a) and (b) show the electric field distribution around Au nano-spheres and nano-urchins, respectively. Electric field enhancement (|E|) of around 9 times is observed for Au nano-urchins (22.8) compared to Au nano-spheres (2.63). Hotspots with enhanced electric field intensity are observed to be generated at the vicinity of spiky nanostructures which are highly useful in LSPR based sensing applications.
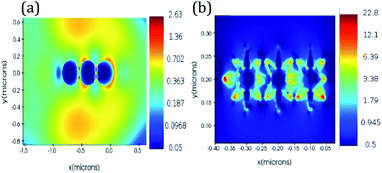 | ||
| Fig. 1 FDTD simulations of electric field enhancement in (a) Au nanospheres (diameter = 100 nm) and (b) Au nano-urchins (diameter = 100 nm) at an excitation wavelength of 633 nm. | ||
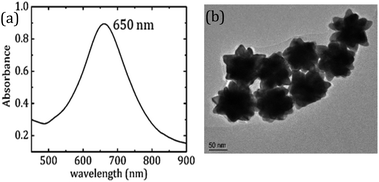
Based on the results obtained from FDTD simulations, we experimentally examined the potential of Au nano-urchins in amyloid beta (Aβ1–42) peptide fibrillation sensing which is the biomarker for Alzheimer's disease. Au nano-urchins of diameter 100 nm (3.84 × 10⁹ particles per ml, in 0.1 mM PBS) were purchased from Sigma Aldrich. The optical absorption spectrum of Au nano-urchins is shown in Fig. 2(a). The LSPR peak of Au nano-urchins is observed at 650 nm. The transmission electron microscopy (TEM) image of Au nano-urchins of diameter 100 nm is shown in Fig. 2(b). Spiky nano protrusions over the surface of Au urchins are clearly evident from TEM images.
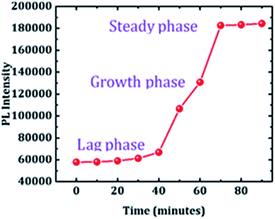
Aβ1–42 peptide was purchased from Abcam (purity > 95%). Aβ1–42 solution was prepared by mixing 1 mg of Aβ1–42 in 100 μl of NaOH. Further, the solution is diluted to a concentration of 1 mg ml−1 in phosphate buffered saline (PBS). Samples were then aliquoted to 100 μl parts and were stored at −20 °C. Fibrillation kinetics of Aβ1–42 was first tested using the Thioflavin T (ThT) assay which is the standard method used to confirm the activity of Aβ1–42 peptide.31 ThT emission gets enhanced when it is bound to Aβ1–42 fibrils. This emission feature of ThT is used for the detection of various fibrillation stages of Aβ1–42. To study the kinetics of Aβ1–42, 100 μM ThT stock solution is diluted to 1 μM with de-ionised water. 100 μl of Aβ1–42 solution is then mixed with 1 μM ThT solution. Emission studies were performed at an excitation wavelength of 410 nm which corresponds to the absorption peak of ThT. Fluorescence intensity was measured every 10 minutes. Fig. 3 shows the emission plot of ThT at various incubation times of Aβ1–42. The growth process of Aβ1–42 was observed to show three phases – lag phase, growth phase and steady phase. A slight increase in emission intensity until 40 minutes indicates the self-assembly of Aβ1–42 monomers during the lag phase. After 40 minutes a sharp increase in emission intensity is observed which is due to the binding of a large number of Aβ1–42 fibrils to ThT during the growth phase. After 60 minutes, fibrillation reaches a steady phase beyond which there is no notable increase in ThT emission. Though ThT can sense Aβ1–42 fibrillation, due to the possible disadvantage of cross-reactivity and non-specific binding, label free LSPR based sensing can be a better option for bio sensing.
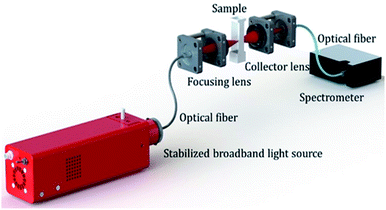
Samples for biosensing study were prepared by mixing 50 μl of Aβ1–42 solution with 500 μl of Au nano-urchins. The solution was further diluted to 1 ml using PBS. The experimental set-up for the study of LSPR is shown in Fig. 4. A stabilized broadband light source (360 nm to 2600 nm) is used as the excitation source. An optical fiber is used to couple the source to the focusing lens assembly. Focused light falls on the sample in a cuvette. Transmitted light through the sample is collected using the lens assembly which is coupled to a spectrometer using an optical fiber. Absorbance (LSPR) values are then deducted from the transmission data. It is easy to reconfigure the system according to the requirement. Flexibility of using spectrometers in the required range, and the possibility of changing the focal spot on the sample are the advantages of this method over commercial spectroscopy instruments.
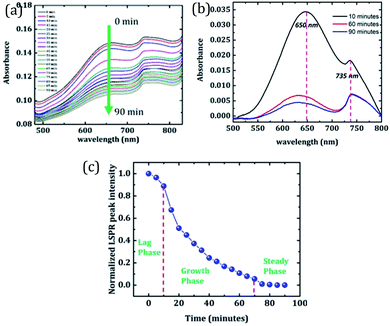
In order to sense the fibrillation stages of Aβ1–42, an absorbance study of the sample is performed at various time intervals. Excitation over the range of 400 nm to 800 nm is used to monitor the change in absorption of Au nano-urchins (650 nm peak) in the presence of Aβ1–42. Data are recorded at every 5 minute interval for 90 minutes. Fig. 5(a) shows a change in absorption of Aβ1–42 with time. A gradual reduction in Au nano-urchin absorbance is observed with the increase of time.
In order to clearly identify the absorption peak of Au nano-urchins in PBS, baseline-corrected data are given in Fig. 5(b). Baseline correction is done based on the absorption of PBS and the same buffer solution is used for suspending Au nano-urchins and amyloid beta peptides and is used for Fig. 2 as well. Absorbance data of samples at incubation times of 10 min, 60 min and 90 min are plotted in Fig. 5(b). The absorbance peak at 650 nm corresponds to Au nano-urchins and that at 735 nm corresponds to the absorption of beta amyloid. A decrease in LSPR intensity with time is clearly visible from Fig. 5(b). Absorption enhancement observed in the wavelength range 700 nm to 800 nm is attributed to mutual absorption contribution from PBS and Aβ1–42 (ESI†). The absorbance peak intensity at 650 nm is used as the sensing parameter for the sensing of Aβ1–42 fibrillation.
Fig. 5(c) shows a change in 650 nm peak (LSPR peak) intensity with time. It is observed from the graph that the peak intensity remains almost constant until 10 minutes which indicates the lag phase of Aβ1–42. At this stage Aβ1–42 monomers slowly start getting aggregated. Since the solution lacks agglomerates, the LSPR intensity of Au urchins is not affected at this stage. A rapid reduction in peak intensity is observed in the time interval from 10 minutes to 70 minutes suggesting the growth phase of Aβ1–42. Many Aβ1–42 fibrils are formed at this stage and these fibrils tend to bind around Au nano-urchins hindering their plasmonic response. This resulted in the reduction of LSPR peak intensity. As more and more fibrils surround Au nano-urchins, the LSPR intensity gets rapidly reduced. After 70 minutes, the absorbance values remain constant indicating the steady phase where Aβ1–42 fibrillation has almost completed. It is inferred from the results that the LSPR peak of Au nano-urchins can be used as an efficient sensing tool for the sensing of Aβ1–42 fibrillation. LSPR peak intensity changes even at a short interval of 5 minutes clearly suggest the sensitivity of the LSPR peak of Au nano-urchins towards biosensing applications.
According to the literature, the presence of Au nanoparticles may not always cause inhibition or acceleration of beta amyloid peptide aggregation.1,43 The interaction between Au nanoparticles and beta amyloid peptides are dependent on the surface charge properties of bare Au nanoparticles which are highly dependent on the surface functionalization of Au nanoparticles. Xiong et al. have reported that a negative surface charge on bare Au nanoparticles results in the lack of coupling between beta amyloid peptides and bare Au nanoparticles resulting in almost null influence on beta amyloid fibrillation.44 In the present work we have used bare Au nano-urchins purchased from Sigma Aldrich, stabilized in PBS buffer solution. There may be a change in the refractive index due to fibrillation of beta amyloid.
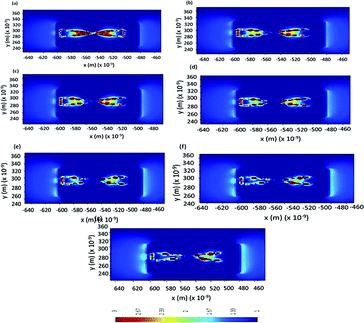
In order to confirm the effect of refractive index, FDTD simulations are performed to study LSPR intensity decay during the fibrillation process. An increase in fibrillation is represented as an increase in effective refractive index in FDTD simulations. Au nano-urchins are distributed on beta amyloid fibrils in simulations as seen in FESEM images. Electric field calculations are performed between Au nano-urchin spikes and the separation between the spikes is considered as 5 nm in all simulations. Simulations are performed at an excitation wavelength of 633 nm. Fig. 6(a–g) show the electric field calculations between the spikes for various refractive index values of fibrils (refractive indices from 1.6 to 1.9 in steps of 0.5 representing various fibrillation stages of beta amyloid). A reduction in LSPR field distribution around the urchin spikes is observed with an increase in refractive indices of fibrils and the results agree with the experimental observations.
The experiment is repeated using Au nanospheres of diameter 100 nm to confirm the better sensitivity of Au nano-urchins towards beta amyloid sensing. The experimental parameters are the same as those for Au nano-urchins. Fig. 7 shows the comparison between LSPR sensing study of beta amyloid fibrillation at the nano-molar concentration level using Au nano-urchins and Au nanoparticles. It is observed from the results that the Au nanospheres do not show much change in optical absorption compared to Au nano-urchins at various fibrillation stages of beta amyloid fibrillation at nano-molar concentration, limiting the low concentration beta amyloid fibrillation sensing capability of Au nanospheres.
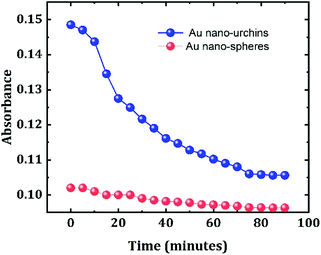 | ||
| Fig. 7 Comparison between LSPR sensing of beta amyloid fibrillation at the nano-molar concentration level using Au nano-urchins (blue) and Au nano-spheres (red). | ||
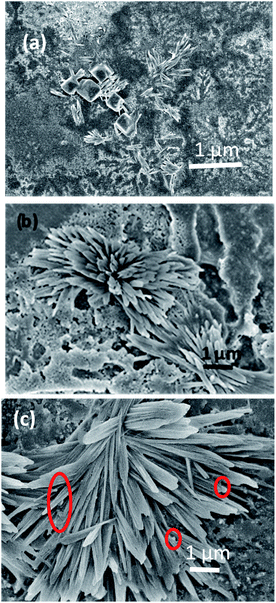
Further, to double-check the Aβ1–42 fibril formation, Field Emission Scanning Electron Microscopy (FESEM) images of Aβ1–42 were taken at different incubation times. Radial growth of beta amyloid fibrils is observed in Fig. 8(a–c). Pompom like growth of beta amyloid fibrils has been already reported in the literature.45Fig. 8(a–c) show the FESEM images of Aβ1–42 mixed with Au nano-urchins for incubation times of 5 minutes (lag phase), 40 minutes (growth phase) and 90 minutes (steady phase), respectively. It is clear from Fig. 8(a) that Aβ1–42 fibrils are in the lag phase. A few small fibrils of length around 400 nm are observed in the lag phase which indicates the beginning of monomer aggregation. Au nano-urchins are observed as a white layer in the background. Nucleation of monomers to fully grown fibrils appears to occur at various regions in Fig. 8(b) indicating the growth phase. From Fig. 8(c) it is inferred that the fibrils are elongated and almost the whole area is covered with fibrils of length 2 μm to 3 μm indicating the steady phase of Aβ1–42 fibrillation. Au nano-urchins are found to be bound at various points on the inner as well as outer surfaces of fibrils which are indicated using red circles in Fig. 8(c). FESEM images confirm the results obtained from Au urchin based LSPR study.
A major advantage of using Au nano-urchins in beta amyloid fibrillation sensing lies in the peripheral diagnosis of Alzheimer's disease (AD). According to the previous literature, tissue level changes of AD are detectable years before their clinical expression.46 These changes in beta amyloid proteins reflect in the body fluids as these proteins are excreted to different body fluids. There are reports on non-invasive detection of beta amyloid from body fluids such as saliva and blood.47,48 Hence peripheral diagnosis of AD in an non-invasive way is highly significant in early stage detection of beta amyloid fibrillation. In the present work, LSPR sensing with Au nano-urchins mainly targets future peripheral diagnostic applications rather than in vivo applications. For the in vivo applications, further optimization of the aspect ratio is required to cross the blood brain barrier. Though the cytotoxicity of Au nanoparticles is not fully studied, they are observed to be biocompatible in comparison with other metal nanoparticles. Au nanostructures are also known to induce nanoparticle induced endothelial leakage which will be helpful for the transportation of nanomedicine.49 With further optimization of the aspect ratio of Au nano-urchins, these structures may be useful for in vivo applications.
One of the advantages of using Au nano-urchins for beta amyloid fibrillation sensing is the possibility of fibrillation sensing at low concentrations due to the enhanced localized plasmon resonance. Though this paper reports on the nano-molar concentration level sensing as a starting point, there is a scope for further improvement in the sensing concentration by changing the density and thickness of spikes over the surface of Au nano-urchins which will have a huge influence on the localized SPR field enhancement. Though optical dyes such as ThT and Congo red can give similar information on the fibrillation kinetics of beta amyloid, the concentration for accurate sensing is observed to be higher which can adversely affect the capability of optical dyes in early stage beta amyloid fibrillation sensing.50
Conclusions
In conclusion, we demonstrate LSPR based sensing of Aβ1–42 fibrillation using Au nano-urchins in this paper. The LSPR peak of Au nano-urchins is observed to be highly sensitive to structural changes of Aβ1–42 during the fibrillation process even at nano-molar concentration. The progress in the fibrillation process is sensed based on the reduction in LSPR peak intensity of Au nano-urchins. Enhanced localized electric field generation at the spiky structures over Au nano-urchins and high sensitivity of LSPR to ambient conditions enable them to act as an efficient biosensor. We envisage that this work can lead to the realization of highly sensitive, label free and real time sensing of beta amyloid enabling AD detection.Conflicts of interest
There are no conflicts to declare.Acknowledgements
The authors acknowledge NTU, COLE-EDB, and Ministry of Education, MoE Singapore (RG 192/17) for financial support.Notes and references
- T. John, A. Gladytz, C. Kubeil, L. L. Martin, H. J. Risselada and B. Abel, Nanoscale, 2018, 10, 20894–20913 RSC
.
- X. Yi, C. Feng, S. Hu, H. Li and J. Wang, Analyst, 2016, 141, 331–336 RSC
.
- X. Wang, G. Perry, M. A. Smith and X. Zhu, Neurodegener. Dis., 2010, 7, 56–59 CrossRef CAS PubMed
.
- J. Nunan and D. H. Small, FEBS Lett., 2000, 483, 6–10 CrossRef CAS PubMed
.
- J. Zhao, X. Zhang, C. R. Yonzon, A. J. Hoes and R. P. Van Duyne, Nanomedicine, 2006, 1, 219–228 CrossRef CAS PubMed
.
- Y. Xia, M. V. Matham, H. Su, P. Padmanabhan and B. Gulyás, J. Biomed. Nanotechnol., 2016, 12, 1553–1584 CrossRef CAS PubMed
.
- S. Padmanabhan, V. K. Shinoj, V. M. Murukeshan and P. Padmanabhan, J. Biomed. Optic., 2010, 15, 017005 CrossRef PubMed
.
- P. Scheltens, Dialogues Clin. Neurosci., 2009, 11, 191–199 Search PubMed
.
- C. Marcus, E. Mena and R. M. Subramaniam, Clin. Nucl. Med., 2014, 39, 413–426 CrossRef PubMed
.
- S. Shokouhi, D. Claassen and W. R. Riddle, J. Alzheimer’s Dis. Park., 2014, 4, 2 Search PubMed
.
- D. Tes, K. Kratkiewicz, A. Aber, L. Horton, M. Zafar, N. Arafat, A. Fatima and M. R. Avanaki, Biomed. Eng. Comput. Biol., 2018, 9, 117959721878108 CrossRef PubMed
.
- L. Song, D. R. Lachno, D. Hanlon, A. Shepro, A. Jeromin, D. Gemani, J. A. Talbot, M. M. Racke, J. L. Dage and R. A. Dean, Alzheimer's Res. Ther., 2016, 8, 1–15 CrossRef PubMed
.
- E. I. Yakupova, L. G. Bobyleva, I. M. Vikhlyantsev and A. G. Bobylev, Biosci. Rep., 2019, 39, 1–22 CrossRef PubMed
.
- T. Takahashi and H. Mihara, Chem. Commun., 2012, 48, 1568–1570 RSC
.
- M. C. Owen, D. Gnutt, M. Gao, S. K. T. S. Wärmländer, J. Jarvet, A. Gräslund, R. Winter, S. Ebbinghaus and B. Strodel, Chem. Soc. Rev., 2019, 48, 3946–3996 RSC
.
- B. T. Bajar, E. S. Wang, S. Zhang, M. Z. Lin and J. Chu, Sensors, 2016, 16, 1488 CrossRef PubMed
.
- Y. Guan, K. J. Cao, A. Cantlon, K. Elbel, E. A. Theodorakis, D. M. Walsh, J. Yang and J. V. Shah, ACS Chem. Neurosci., 2015, 6, 1503–1508 CrossRef CAS PubMed
.
- M. Yamao, K. Aoki, N. Yukinawa, S. Ishii, M. Matsuda and H. Naoki, PLoS One, 2016, 0164254 Search PubMed
.
- S. Santi, V. Musi, E. Descrovi, V. Paeder, J. Di Francesco, L. Hvozdara, P. Van Der Wal, H. A. Lashuel, A. Pastore, R. Neier and H. P. Herzig, ChemPhysChem, 2013, 14, 3476–3482 CrossRef CAS PubMed
.
- V. M. Murukeshan, J. K. Chua, S. K. Tan and Q. Y. Lin, Opt. Express, 2008, 16, 13857 CrossRef CAS PubMed
.
- J. K. Chua and V. M. Murukeshan, Phys. Scr., 2009, 80, 1–5 CrossRef
.
- P. Palladino, A. M. Aura and G. Spoto, Anal. Bioanal. Chem., 2016, 408, 849–854 CrossRef CAS PubMed
.
- P. P. Vachali, B. Li, A. Bartschi and P. S. Bernstein, Arch. Biochem. Biophys., 2015, 572, 66–72 CrossRef CAS PubMed
.
- A. Abbas, M. J. Linman and Q. Cheng, Biosens. Bioelectron., 2012, 26, 1815–1824 CrossRef PubMed
.
- R. V. Nair, K. Dileep, V. S. Gummaluri and C. Vijayan, Plasmonics, 2017, 12, 1649–1656 CrossRef CAS
.
- R. V. Nair, A. Prakash and C. Vijayan, J. Phys. D. Appl. Phys., 2018, 51, 04510 Search PubMed
.
- X. Zhao, T. Huang, P. S. Ping, X. Wu, P. Huang, J. Pan, Y. Wu and Z. Cheng, Sensors, 2018, 18(7), 2056 CrossRef PubMed
.
- S. Raveendran, H. T. Lim, T. Maekawa, M. Vadakke Matham and D. Sakthi Kumar, Nanoscale, 2018, 10, 13959–13968 RSC
.
- E. Helmerhorst, D. J. Chandler, M. Nussio and C. D. Mamotte, Clin. Biochem. Rev., 2012, 33, 161–173 Search PubMed
.
- D. Hao, C. Hu, J. Grant, A. Glidle and D. R. S. Cumming, Biosens. Bioelectron., 2018, 100, 23–27 CrossRef CAS PubMed
.
- Y. H. Liao, Y. J. Chang, Y. Yoshiike, Y. C. Chang and Y. R. Chen, Small, 2012, 8, 3631–3639 CrossRef CAS PubMed
.
- P. A. T. Martins, S. Alsaiari, K. Julfakyan, Z. Nie and N. M. Khashab, Chem. Commun., 2017, 53, 2102–2105 RSC
.
- Y. Xia, P. Padmanabhan, S. Sarangapani, B. Gulyás and M. Vadakke Matham, Sci. Rep., 2019, 9, 1–11 CrossRef PubMed
.
- K. V. Sreekanth, J. K. Chua and V. M. Murukeshan, Appl. Opt., 2010, 49, 6710–6717 CrossRef PubMed
.
- Z. Li, K. Sun, Z. Du, B. Chen and X. He, Nanomaterials, 2018, 8, 265 CrossRef PubMed
.
- X. Wang, D. P. Yang, P. Huang, M. Li, C. Li, D. Chen and D. Cui, Nanoscale, 2012, 4, 7766–7772 RSC
.
- Y. H. Su, S. L. Tu, S. W. Tseng, Y. C. Chang, S. H. Chang and W. M. Zhang, Nanoscale, 2010, 2, 2639–2646 RSC
.
- Y. M. Sabri, A. E. Kandjani, S. J. Ippolito and S. K. Bhargava, Sci. Rep., 2016, 6, 1–10 CrossRef PubMed
.
- M. Azimzadeh, N. Nasirizadeh, M. Rahaie and H. Naderi-Manesh, RSC Adv., 2017, 7, 55709–55719 RSC
.
- Z. Aghili, N. Nasirizadeh, A. Divsalar, S. Shoeibi and P. Yaghmaei, Biosens. Bioelectron., 2017, 95, 72–80 CrossRef CAS PubMed
.
- L. Chen, Y. Huang, T. T. Xing, L. Ge, T. Yang, B. Chen and C. Z. Huang, J. Mater. Chem. C, 2017, 5, 7806–7812 RSC
.
- E. A. Elbassal, C. Morris, T. W. Kent, R. Lantz, B. Ojha, E. P. Wojcikiewicz and D. Du, J. Phys. Chem. C Nanomater. Interfaces, 2017, 121(36), 20007–20015 CrossRef CAS PubMed
.
- P. C. Ke, E. H. Pilkington, Y. Sun, I. Javed, A. Kakinen, G. Peng, F. Ding and T. P. Davis, Adv. Mater., 2019, 1901690 Search PubMed
.
- N. Xiong, Y. Zhao, X. Dong, J. Zheng and Y. Sun, Small, 2017, 13, 1–14 Search PubMed
.
- G. Plascencia-Villa, A. Ponce, J. F. Collingwood, M. Josefina Arellano-Jiménez, X. Zhu, J. T. Rogers, I. Betancourt, M. José-Yacamán and G. Perry, Sci. Rep., 2016, 6, 1–12 CrossRef PubMed
.
- A. L. Clos, R. Kayed and C. A. Lasagna-Reeves, Front. Neurol., 2012, 1–10 Search PubMed
.
- M. N. Sabbagh, J. Shi, M. Lee, L. Arnold, Y. Al-Hasan, J. Heim and P. McGeer, BMC Neurol., 2018, 18, 155 CrossRef PubMed
.
- Y. K. Yoo, J. Kim, G. Kim, Y. S. Kim, H. Y. Kim, S. Lee, W. W. Cho, S. Kim, S. M. Lee, B. C. Lee, J. H. Lee and K. S. Hwang, Sci. Rep., 2017, 7, 1–10 CrossRef PubMed
.
- J. K. Tee, L. X. Yip, E. S. Tan, S. Santitewagun, A. Prasath, P. C. Ke, H. K. Ho and D. T. Leong, Chem. Soc. Rev., 2019, 48, 5381–5407 RSC
.
- L. P. Jameson, N. W. Smith and S. V. Dzyuba, ACS Chem. Neurosci., 2012, 3, 807–819 CrossRef CAS PubMed
.
Footnote |
| † Electronic supplementary information (ESI) available. See DOI: 10.1039/d0na00164c |
| This journal is © The Royal Society of Chemistry 2020 |

