 Open Access Article
Gelation of uranyl ions and gel-derived uranium oxide nanoparticles for gas sensing†
Li
Ding
a,
Jennifer
Leduc
b,
Thomas
Fischer
 b,
Sanjay
Mathur
 *b and
Yan
Li
 *a
*a
aBeijing National Laboratory for Molecular Sciences, Key Laboratory for the Physics and Chemistry of Nanodevices, State Key Laboratory of Rare Earth Materials, Chemistry and Applications, College of Chemistry and Molecular Engineering, Peking University, Beijing 100871, China. E-mail: yanli@pku.edu.cn
bInstitute of Inorganic Chemistry, University of Cologne, Greinstr. 6, Cologne, 50939, Germany. E-mail: sanjay.mathur@uni-koeln.de
First published on 6th May 2020
Abstract
We developed a sol–gel method to synthesize uranium oxide nanoparticles with a clean surface and mixed valences of uranium at the surface. Uranyl gel was formed in ethylene glycol without incorporating any organic gelator and was readily converted to uranium dioxide nanoparticles with uniform size via microwave treatment. The as-prepared uranyl gel showed a high storage modulus of 0.48 kPa. The formation of the gel skeleton benefits from interlinkage of uranyl ions, which was revealed by UV-Vis spectroscopy and X-ray absorption. The U![[double bond, length as m-dash]](https://www.rsc.org/images/entities/char_e001.gif) Oax bond was elongated by 0.1 Å and the U–Oeq bond was shortened by 0.25 Å by the gelation. The gel showed thixotropic and self-healing properties owing to the soft connection in the gel skeleton and photo-response attributed to the photo-reduction reaction between uranyl ions and matrix solvent. With the great inclusion properties, the uranyl gel was decomposed by microwave treatment into uranium dioxide nanoparticles with a size of ∼4 nm. The resultant UO2 nanoparticles were easily oxidized in air, and thus presented an n-type semiconductor behaviour and sensitivity to both oxidative and reductive gases such as NO2, EtOH, CO, and NH3.
Oax bond was elongated by 0.1 Å and the U–Oeq bond was shortened by 0.25 Å by the gelation. The gel showed thixotropic and self-healing properties owing to the soft connection in the gel skeleton and photo-response attributed to the photo-reduction reaction between uranyl ions and matrix solvent. With the great inclusion properties, the uranyl gel was decomposed by microwave treatment into uranium dioxide nanoparticles with a size of ∼4 nm. The resultant UO2 nanoparticles were easily oxidized in air, and thus presented an n-type semiconductor behaviour and sensitivity to both oxidative and reductive gases such as NO2, EtOH, CO, and NH3.
Introduction
Uranium with abundant 5f electrons exhibits splendid chemical properties such as variable valence states and multiple oxide phases. The thermodynamically stable phases of the binary oxides are UO2, U4O9, U3O8 and UO3.1 Many other metastable oxides also exist. Uranium oxide with flexible oxidation states has widespread applications in catalysis.2–8 For example, U3O8 is efficient for destruction of a range of volatile chloro-organic compounds under mild conditions.2,9 U3O8/ZrO2 is a remarkable heterogeneous catalyst for the oxidation of HCl to Cl2.6 However, the application of uranium oxide in other fields is still relatively rare.Transition metal oxide semiconductors have been widely studied as gas sensing materials and their n/p-type nature affects the behaviour in gas detection.10–15 Uranium oxides with variable valence states can easily produce defects. As a result, the surface chemistry of uranium oxides is more sensitive to the changes of the peripheral environment. The oxygen ions adsorbed on defects can undergo electron transfer with the gas molecules, thereby affecting the conductivity of the oxides. Meanwhile, the semiconducting properties of uranium oxides are closely related to their stoichiometry.16–18 UO2 with a fluorite structure is able to accommodate up to 10% additional oxygen in its lattice without any change of the structure, acting as a p-type semiconductor.19 Further increase of the O/U ratio results in a change of structure to U3O8, which is an n-type semiconductor.1 Thus, the versatile properties of uranium oxides endow them with great potential in gas sensing.
Gas sensing is based on the adsorption and/or reaction occurring at the surface, so it is meaningful to control the size of the uranium oxide in the nanometer range to obtain a high specific surface area. Synthesis of uranium oxide nanoparticles was recently realized by liquid-phase pyrolysis in an oleic acid/oleylamine system and hydrothermal/solvothermal methods.4,12,20–26 The hydrothermal/solvothermal treatments show poor control over the size and morphology of the resultant nanoparticles. The liquid-phase pyrolysis process exhibits good controllability on the size and morphology of the nanoparticles, but the organic capping reagents adsorbed on their surface hinder the sensing performance.
The sol–gel method has been a conventional pathway to prepare microspheres of uranium dioxide in the nuclear industry. In this process, hexamethylenetetramine, urea and some polymers are used to promote the formation of uranyl gels.27,28 Then the uranium dioxide microspheres are obtained by further annealing the gel. It is of interest to develop a sol–gel process with a simple recipe for the synthesis of uranium oxide nanoparticles.
Herein, we established a gel-based preparation for urania nanoparticles and fabricated urania-based gas sensing devices. The gel formed immediately after mixing the uranyl ethylene glycol (EG) solution with ammonia solution. Then the urania nanoparticles were obtained by microwave-assisted decomposition of the gel. The urania nanoparticles have a uniform size of ∼4 nm and present a U3O8 surface layer, which leads to inversed semiconductive properties from p-type to n-type. The unique surface properties endow the nanoparticles with sensitivity towards both reductive and oxidative gases.
Experimental
Materials and methods
Ethylene glycol (EG) (A.R., Sinopharm Chemical Reagent), ammonia water (30%) (A.R., Beijing TongGuang Fine Chemical), and U3O8 (A.R., China National Nuclear) were used. All chemicals were used as received.Preparation of uranyl nitrate hexahydrate (UNH)
2.5 g (3 mmol) U3O8 and 2 mL HNO3 were mixed in an evaporating basin until no reddish-brown gas evolution was observed anymore. The uranyl nitrate solution was heated and after the solvent had evaporated, a yellow crystalline raw-product was obtained. Then the raw product was purified via recrystallization from water three times at room temperature.General procedure for the preparation of the uranyl-EG (ethylene glycol) gel
1.3 mL ethylene glycol and 0.2 mL (0.1 M in ethylene glycol) uranyl nitrate solution were mixed with a defined amount of ammonia (5–100 μL). The resultant reaction mixture was allowed to stand. A transparent yellow gel formed within seconds.Preparation of uranium dioxide nanoparticles
The crystalline uranium dioxide nanoparticles were obtained by reducing the uranyl EG gel under microwave irradiation. Typically, 7 mL of the uranyl EG gel were transferred to a pressure-resistant microwave vessel and maintained at 200 °C and 12.0 bar for 30 min under irradiation in dynamic power mode at 50 W. The product was centrifuged and washed with deionized water and ethanol three times followed by drying in a vacuum at 60 °C. The microwave reaction was achieved using a commercialized Discover® SP Sequential Microwave Synthesis System.Characterization
The phase composition was determined using a Stoe-Stadi MP X-ray diffractometer operating in transmission mode using Mo-Kα1 (λ = 0.7093 Å) radiation. The morphologies of nanoparticles were investigated with a scanning electron microscope (SEM, Hitachi S-4800) and a transmission electron microscope (TEM, Zeiss LEO 912, 120 kV). The X-ray photoelectron spectra (XPS) were recorded with a Surface Science Instruments ESCA M-Probe using monochromatic Al-Kα radiation (hν = 1486.6 eV). The spectra were fitted and analysed with CasaXPS software. The X-ray absorption fine structure (XAFS) spectra at the uranium L3-edge (E0 = 17![[thin space (1/6-em)]](https://www.rsc.org/images/entities/char_2009.gif) 166 eV) were collected at the BL14W1 beamline of the Shanghai Synchrotron Radiation Facility (SSRF). The energy was calibrated according to the absorption edge of the Zr foil at the K-edge (17
166 eV) were collected at the BL14W1 beamline of the Shanghai Synchrotron Radiation Facility (SSRF). The energy was calibrated according to the absorption edge of the Zr foil at the K-edge (17![[thin space (1/6-em)]](https://www.rsc.org/images/entities/char_2009.gif) 997 eV). Rheological experiments were performed on a rheometer (MCR301, Anton Paar): frequency sweep tests were carried out at a fixed strain of 0.5%; amplitude sweep tests were performed at a fixed frequency of 1 Hz. The UV-Vis measurements were performed on a PerkinElmer Lambda 750 spectrophotometer. The photoluminescence (PL) emission spectra were recorded with a Hitachi F-7000 luminescence spectrometer with an excitation wavelength of 375 nm. A light response test was performed by illumination under Xe light of 150 W.
997 eV). Rheological experiments were performed on a rheometer (MCR301, Anton Paar): frequency sweep tests were carried out at a fixed strain of 0.5%; amplitude sweep tests were performed at a fixed frequency of 1 Hz. The UV-Vis measurements were performed on a PerkinElmer Lambda 750 spectrophotometer. The photoluminescence (PL) emission spectra were recorded with a Hitachi F-7000 luminescence spectrometer with an excitation wavelength of 375 nm. A light response test was performed by illumination under Xe light of 150 W.
Gas sensing measurements
The gas sensing properties of uranium dioxide nanoparticles towards different gases (NO2, EtOH, NH3 and CO) were examined using a customized gas sensing system operating at 200 °C, interfaced to a Keithley 2400 source meter and controlled by Lab View software for resistivity measurements.Mott–Schottky measurements
All electrochemical measurements were performed using a one-compartment, 3-electrode cell with the UO2/FTO sample as the working electrode, platinum (Pt) wire as the counter electrode and a saturated calomel electrode (SCE) as the reference electrode. 0.1 M Na2SO4 was used as the electrolyte. The Keithley 2400 source meter applied the potential and an Agilent E4980A LCR meter recorded the capacitance controlled by the Lab View software.Safety instruction
The uranium used in this work has activity less than 0.2 kBq g−1. However, prolonged exposure to radioactive material (by oral or nasal routes) may have adverse health effects and must be avoided.Results and discussion
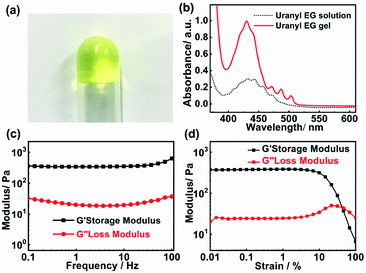
Fig. 1a presents a photograph of the uranyl gel in an inverted glass tube, which exhibits a transparent yellow jelly-like appearance. The mechanical viscoelastic properties of the uranyl gel were investigated by rheological studies (strain and frequency sweeps). As shown in Fig. 1c and d, the measurements at a constant strain of 0.5% revealed that the storage modulus (G′) is 0.29 kPa larger than the loss modulus (G′′) and both of them (G′ and G′′) are independent of the angular frequency (ω). The amplitude of the storage modulus amounts to 0.48 kPa in the linear regime, which is at the same magnitude range as reported for Eu(III) metallogels (0.41 kPa).29 Furthermore, we found that the uranyl-EG gel showed ‘thixotropy’ (Fig. S1†), which is a time-dependent shear thinning property. This phenomenon indicates that the gel network was not rigid and easy to recover.The gelation abilities of uranyl nitrate were examined by varying the NH4OH concentration, additional amount of water, and uranyl nitrate concentration (Table 1). The critical gelation concentration (CGC) was evaluated to be 3.3 mM and 0.15 wt% of uranyl nitrate, which was at a low concentration level when compared to other metallogels.30–32 In addition, the ammonia concentration played a critical role in the gelation process. When the concentration of ammonium hydroxide was less than 0.3 vol%, a stable solution was obtained. An excess of ammonium hydroxide (33 vol%) or water (3.0 vol%) directly led to precipitation of uranyl hydroxide which was due to fierce hydrolysis of uranyl ions under the alkaline conditions. Therefore, the absorbance was enhanced in the range of 400–500 nm after gelation, which was due to the increasing oligomerisation of uranyl ions (Fig. 1b). It was reported that the molar absorption of (UO2)3(OH)5+ species (474 ± 7 mol−1 cm−1 at 429.0 nm) is 48 times that of free UO22+ (9.7 ± 2 mol−1 cm−1 at 413.8 nm).33,34
| NH4OH conc. (vol%) | Additional H2O (vol%) | UO2(NO3)2·6H2O conc. (mM) | |||
|---|---|---|---|---|---|
| a S, G and P denote solution, gelation, and precipitation, respectively. | |||||
| 0.3 | S | 0 | G | 3.3 | S |
| 1.3 | G | 0.1 | G | 6.6 | G |
| 2.0 | G | 0.3 | G | 9.9 | G |
| 4.6 | G | 1.6 | G | 13.2 | G |
| 33 | P | 3.0 | P | 16.5 | P |
From the results shown above, we inferred that both the ammonia and water concentrations influenced the degree of hydrolysis of uranyl ions and thus the gelation properties. It is well known that the degree of hydrolysis varies with pH of the solution. When increasing the pH, oxo/hydroxo bridges can be created between the uranyl centered polyhedra, leading to the formation of higher nuclearities (e.g., [(UO2)2(OH)2]2+, [(UO2)3(OH)5]+ and [(UO2)4(OH)7]+).35,36 This fact is confirmed by detailed studies on uranyl ion hydrolysis, following eqn (1).37
| mUO22+ + nH2O → [(UO2)m(OH)n](2m−n)+ + mH+ | (1) |
Owing to the very low concentration (3.3–13.2 mmol L−1) of uranyl ions in the gel and the precursor solution, the vibration signal of the U![[double bond, length as m-dash]](https://www.rsc.org/images/entities/char_e001.gif) O bond was submerged in the signals of the solvent and hard to distinguish. As shown in Fig. S2(a),† the absorption in the IR spectra were mainly contributed by the solvent, ethylene glycol (EG). In the spectrum of EG, the peak at 1657 cm−1 (bending vibration mode of H–O–H) implied the existence of residual water. However, in the spectra of uranyl-EG solution and uranyl-EG-gel, this band almost disappeared. It was likely caused by the water consumption from the hydrolysis of uranyl ions, according to eqn (1). For more discussion, please see the ESI.†
O bond was submerged in the signals of the solvent and hard to distinguish. As shown in Fig. S2(a),† the absorption in the IR spectra were mainly contributed by the solvent, ethylene glycol (EG). In the spectrum of EG, the peak at 1657 cm−1 (bending vibration mode of H–O–H) implied the existence of residual water. However, in the spectra of uranyl-EG solution and uranyl-EG-gel, this band almost disappeared. It was likely caused by the water consumption from the hydrolysis of uranyl ions, according to eqn (1). For more discussion, please see the ESI.†
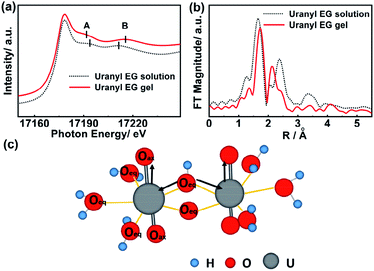
The coordination environment around uranium atoms in the uranyl EG gel and uranyl EG solution was further identified via XAFS analysis at the uranium L3-edge. The signal at 17![[thin space (1/6-em)]](https://www.rsc.org/images/entities/char_2009.gif) 178 eV was detected in both spectra and was assigned to uranium in the +6 oxidation state, indicating that the oxidation state did not change during gelation.38 Two prominent resonance features are visible in the XANES spectra of uranyl-containing compounds (A and B, Fig. 2a). Feature A (∼17
178 eV was detected in both spectra and was assigned to uranium in the +6 oxidation state, indicating that the oxidation state did not change during gelation.38 Two prominent resonance features are visible in the XANES spectra of uranyl-containing compounds (A and B, Fig. 2a). Feature A (∼17![[thin space (1/6-em)]](https://www.rsc.org/images/entities/char_2009.gif) 190 eV) is attributable to the short axial U–O bonds in the dioxygenyl species, while feature B (∼17
190 eV) is attributable to the short axial U–O bonds in the dioxygenyl species, while feature B (∼17![[thin space (1/6-em)]](https://www.rsc.org/images/entities/char_2009.gif) 210–17
210–17![[thin space (1/6-em)]](https://www.rsc.org/images/entities/char_2009.gif) 215 eV) is attributable to the longer U–O equatorial bonds.39,40 Upon gelation, feature A shifts to a lower photon energy (17
215 eV) is attributable to the longer U–O equatorial bonds.39,40 Upon gelation, feature A shifts to a lower photon energy (17![[thin space (1/6-em)]](https://www.rsc.org/images/entities/char_2009.gif) 194 to 17
194 to 17![[thin space (1/6-em)]](https://www.rsc.org/images/entities/char_2009.gif) 191 eV), while feature B shifts to higher energy (17
191 eV), while feature B shifts to higher energy (17![[thin space (1/6-em)]](https://www.rsc.org/images/entities/char_2009.gif) 211 to 17
211 to 17![[thin space (1/6-em)]](https://www.rsc.org/images/entities/char_2009.gif) 215 eV). Energy shifts of these resonance features were reported to be inversely proportional to the changes in the corresponding U–O bond lengths.41 The extended X-ray absorption fine structure spectroscopy measurement in R space, which allows determination of the bond length of the central uranium atom to the coordinating ligand atoms, is depicted in Fig. 2b. The first peak is assigned to the U
215 eV). Energy shifts of these resonance features were reported to be inversely proportional to the changes in the corresponding U–O bond lengths.41 The extended X-ray absorption fine structure spectroscopy measurement in R space, which allows determination of the bond length of the central uranium atom to the coordinating ligand atoms, is depicted in Fig. 2b. The first peak is assigned to the U![[double bond, length as m-dash]](https://www.rsc.org/images/entities/char_e001.gif) O bond (axial position) and amounts to 1.64 Å for the uranyl EG solution and to 1.73 Å for the uranyl EG gel. The second peak was assigned to the U–O bond (equatorial plane), and amounts to 2.37 Å and 2.12 Å for the uranyl EG solution and the uranyl EG gel, respectively.42 The bond length data were all within the range of the axial U
O bond (axial position) and amounts to 1.64 Å for the uranyl EG solution and to 1.73 Å for the uranyl EG gel. The second peak was assigned to the U–O bond (equatorial plane), and amounts to 2.37 Å and 2.12 Å for the uranyl EG solution and the uranyl EG gel, respectively.42 The bond length data were all within the range of the axial U![[double bond, length as m-dash]](https://www.rsc.org/images/entities/char_e001.gif) O bond (1.77 Å) and U–O bond (2.42 Å) of uranium nitrate reported in the literature with the consideration of phase correction.43 These results illustrated that both a longer U
O bond (1.77 Å) and U–O bond (2.42 Å) of uranium nitrate reported in the literature with the consideration of phase correction.43 These results illustrated that both a longer U![[double bond, length as m-dash]](https://www.rsc.org/images/entities/char_e001.gif) O bond and a shorter U–O bond are present in the gel phase, which indicates a stronger coordination tendency of the ligands in the equatorial plane as compared to the uranyl EG solution (Fig. 2c). Fierce hydrolysis of the uranyl ions in the gel occurred, which resulted in more bridge O atoms and shorted the equatorial U–O bond.
O bond and a shorter U–O bond are present in the gel phase, which indicates a stronger coordination tendency of the ligands in the equatorial plane as compared to the uranyl EG solution (Fig. 2c). Fierce hydrolysis of the uranyl ions in the gel occurred, which resulted in more bridge O atoms and shorted the equatorial U–O bond.
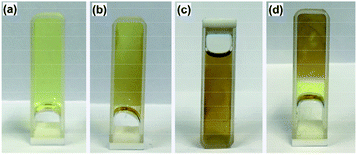
Besides the hydrolysis effect, the uranyl ion exhibited interactions with the solvent ethylene glycol. Aliphatic alcohols are moderately strong quenchers of the excited state of the uranyl ion.44–46 The quenching occurred in a kinetic encounter between [*UO2]2+ and alcohol and was accompanied by the reduction of uranium(VI) and oxidation of the organic species to generate aldehydes. Fig. S3† shows the luminescence quenching of the uranyl ion by EG. By taking advantage of the quenching effect, the gel shows a photo-response. The uranyl EG gel was exposed to light illumination for different time periods (5 min and 10 min) as shown in Fig. 3b and c. Interestingly, the gel showed a reversible photo-response. After 5 min of illumination, the gel turned brown, but remained in the gel state. After 10 min, the color was darker and the gel converted to a solution, which was caused by a heating effect from the light, confirmed through a heating experiment. Upon removing the light, the gel was gradually recovered within two days, thus demonstrating a reversible photo-response as a result of oxygen permeation into the cuvette.
The photo-reduced product was collected by centrifugation and the gel skeleton information was obtained via TEM. It shows that the skeleton retained a porous network (Fig. S5†). The pore size is approximately 15 nm. Electron diffraction shows polycrystalline diffraction rings representing interplanar distances of 0.315 nm, 0.275 nm and 0.191 nm, which correspond to the (111), (200), and (220) crystal planes of UO2, respectively. This indicates that U(VI) was reduced in situ to U(IV) during the photoreaction of the gel.
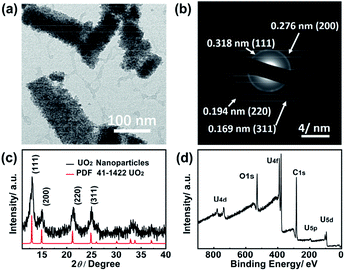
With the great inclusion properties, the uranyl EG was used as precursor for the synthesis of uranium oxide nanoparticles. Fig. 4a shows the TEM image of nanoparticles obtained from the microwave decomposition. The XRD pattern (Fig. 4c) was unambiguously assigned to the cubic phase UO2. The peaks at 2θ = 13.7°, 15.6°, 21.8° and 25.6° were indexed to the (111), (200), (220) and (311) planes, respectively. Peak broadening resulted from the nano-scale size of the particles. The size distribution of UO2 is shown in Fig. S4† based on measurements of 109 particles in TEM images. The mean size is 3.4 ± 0.6 nm, which is in accordance with the result from the Debye–Scherrer equation calculation (∼4 nm).47
The XRD pattern coincided with the results from the electron diffraction pattern (Fig. 4b). The distances of 0.318 nm, 0.276 nm, 0.194 nm and 0.169 nm were attributed to the (111), (200), (220) and (311) planes, respectively. The XPS survey spectrum (Fig. 4d) revealed that the sample solely contained U, O, and C elements with no coexisting impurities. The two peaks located at 392 eV and 381 eV were assigned to the binding energy of U 4f5/2 and U 4f7/2, respectively.48
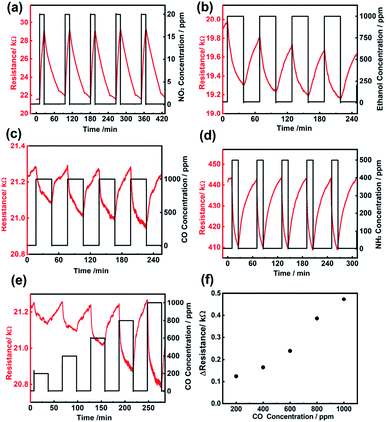
UO2 is a semiconductor, which can accommodate an excess or deficiency of oxygen without changing its crystal phase. This pronounced valence variation gives rise to the sensitivity of electrical conductivity towards oxidizing and reducing gases.49 In our synthesis procedures, besides the uranium source, only water, ethylene glycol, and ammonia were introduced into the system. Therefore, the urania nanoparticles obtained present a clean surface. Indeed, nanoparticles with a clean surface are highly desired in gas sensing. Herein, gas sensing devices were prepared on ceramic substrates with four evaporated Pt electrodes used for the input of the heating power, as well as to monitor the resistance of the sensing materials (Fig. S6†). The dynamic sensing behavior of the uranium dioxide sensor upon exposure to different gases was investigated at 200 °C (Fig. 5). In the case of the oxidizing gas NO2, the resistance of the UO2 sensor increased (20 ppm, ΔR = 7.8 kΩ, sensitivity ∼ 36%). The order of magnitude of sensitivity is comparable to the previously reported ones using other oxides: 10–40% at 1–5 ppm NO2 for a SnO2–ZnO core–shell nanofiber sensor,50 35% at 500 ppb NO2 for In2O3 nanowires, and 30–200% at 1 ppm NO2 for WO3 nanorods.51,52
We also applied the nanoparticles in sensing reductive gases. A resistance decrease of the UO2 sensor was observed in the case of reducing gases such as ethanol (1000 ppm, ΔR = −0.6 kΩ, sensitivity ∼ 3%), CO (1000 ppm, ΔR = −0.3 kΩ, sensitivity ∼ 1.4%), and NH3 (500 ppm, ΔR = −30 kΩ, sensitivity ∼ 6.8%). Fig. 5e and f show the CO gas sensing response, expressed as a resistance variation, for 200, 400, 600, 800, and 1000 ppm CO. We observed an increase in resistance with an increase in gas concentration. Generally, the ionosorption model was applied to explain the mechanism of the semiconductor gas sensing material.53 In this model, the surface-adsorbed oxygen ions are considered to be the determining factor in the chemiresistive behavior. For n-type semiconductors, oxygen ions (O2−ads, O−ads, and O2−ads) are formed via an uptake of electrons from the conduction band (CB). When reducing gases such as CO react with these oxygen ions, electrons are released back to the conduction band, thus increasing the electrical conductivity of the semiconductor. If oxidizing gases are present, more electrons are taken from the conduction band, which results in a decrease in conductivity. As the resistance decreased upon exposure to reducing gas, the as-prepared UO2 nanoparticle sensor exhibits an n-type semiconducting behavior.
The semiconducting properties of uranium oxides have been reported to be influenced by the valence state of uranium. In general, uranium dioxide is regarded to be a p-type semiconductor due to the extra oxygen doping with stoichiometric form UO2+x (0 < x < 0.22).54,55 In contrast, the oxygen deficient form (UO2−x) is an n-type semiconductor, obtained by Ar+ sputtering or in a strong reducing environment.1,56,57 However, the gel-derived UO2 nanoparticles are not consistent with any of the above situations.
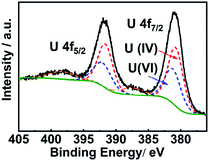
High resolution XPS spectroscopy was performed to investigate the surface oxidation state of UO2 nanoparticles (Fig. 6). The 4f5/2 peak at 391.62 eV and the 4f7/2 signal at 380.77 eV were ascribed to U(IV) and the 4f5/2 signal at 392.07 eV and 4f7/2 peak at 381.22 eV originated from U(VI). The ratio of U(IV)/(VI) was 3![[thin space (1/6-em)]](https://www.rsc.org/images/entities/char_2009.gif) :
:![[thin space (1/6-em)]](https://www.rsc.org/images/entities/char_2009.gif) 2. As the mixed-valence oxide U3O8 is the most stable phase and exhibits n-type semiconducting behavior, we proposed that a thin layer of U3O8 formed on the surface of the nanoparticles. The U 4f full-width at half maximum (FWHM) was 2.7 eV, obviously different from those of the pure UO2 (1.90 to 1.95 eV), also indicating that UO2 was converted to U3O8 (FWHM 2.75 eV).58 Since the size of uranium dioxide nanoparticles (∼4 nm) was in the range of the penetration depth of XPS for inorganic materials (∼5 nm), the composition of nanoparticles could be regarded as mixed oxides of UO2/U3O8 in a 2
2. As the mixed-valence oxide U3O8 is the most stable phase and exhibits n-type semiconducting behavior, we proposed that a thin layer of U3O8 formed on the surface of the nanoparticles. The U 4f full-width at half maximum (FWHM) was 2.7 eV, obviously different from those of the pure UO2 (1.90 to 1.95 eV), also indicating that UO2 was converted to U3O8 (FWHM 2.75 eV).58 Since the size of uranium dioxide nanoparticles (∼4 nm) was in the range of the penetration depth of XPS for inorganic materials (∼5 nm), the composition of nanoparticles could be regarded as mixed oxides of UO2/U3O8 in a 2![[thin space (1/6-em)]](https://www.rsc.org/images/entities/char_2009.gif) :
:![[thin space (1/6-em)]](https://www.rsc.org/images/entities/char_2009.gif) 1 ratio.
1 ratio.
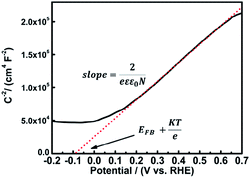
To verify the semi-conductor type of the as-prepared UO2/U3O8 nanoparticles, Mott–Schottky measurements were performed (Fig. 7). The sample was prepared via drop coating a dispersion of UO2/U3O8 nanoparticles in ethanol onto a FTO substrate. The electrode area was determined by optical microscopy (Fig. S7 and S8†).
According to the Mott–Schottky equation,59,60 the flat-band potential of UO2/U3O8 was −0.115 V versus RHE in 0.1 M Na2SO4. To determine the donor density, a dielectric constant of 22 was applied for this system,61 and N = 2.29 × 1022 cm−3 was determined from the slope of the Mott–Schottky plot. For n-type semiconductors the slope of the Mott–Schottky plot is positive, while for p-type semiconductors the slope is negative. Thus, the gel-derived UO2/U3O8 material is an n-type semiconductor, which coincides with the results from the gas sensing measurements.
The as-prepared crystalline UO2 nanoparticles are easily oxidized in air to form U3O8 at the surface. Because of the small size and high surface area of the nanoparticles, the conduction behavior of the n-type U3O8 layer dominated over the conduction behavior of the p-type UO2. This phenomenon has been reported before for CuO nanowires coated with SnO2 nanoparticles and Cr2O3 nanoparticle-coated ZnO nanowire systems.62,63 When the U3O8 surface is exposed to reducing gases, the conductivity increases as electrons are released to the conduction band from the oxygen ions (Fig. 8).
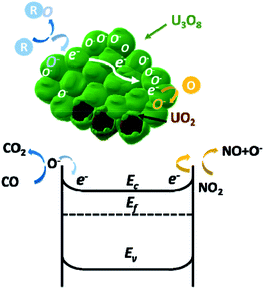 | ||
| Fig. 8 Gas sensing mechanism of UO2/U3O8 nanoparticles when exposed to oxidizing and reducing gases. | ||
Conclusions
We prepared a uranyl organic gel in ethylene glycol without the addition of gelators. The gel exhibited both ‘thixotropy’ properties and light response behaviour. The unique coordination properties of the uranyl ion played the main role in gel skeleton formation. As the uranyl ion exhibited a strong interaction with the solvent in the gel network, it was deemed to be a good precursor for nanoparticle synthesis. The gel-derived uranium oxide nanoparticles were synthesized via microwave-assisted decomposition. The clean surface of the resultant nanoparticles is beneficial for applications in gas sensing. These nanoparticles showed n-type semiconducting behavior because the UO2 nanoparticles were partially oxidized to U3O8. The unique property of mixed valences of uranium at the surface results in a dual sensitivity to both reductive and oxidative gases, which may have application potential.Conflicts of interest
There are no conflicts of interest to declare.Acknowledgements
This research is financially supported by the Ministry of Science and Technology of China (2016YFA0201904), National Natural Science Foundation of China (grants 21631002, U1632119, and 21621061), Peking University short-term overseas research project, and German Academic Exchange Service (DAAD) Short-Term Grants, 2017.Notes and references
- H. Idriss, Surf. Sci. Rep., 2010, 65, 67–109 CrossRef CAS.
- J. H. Graham, S. H. Catherine, D. H. Ian and H. T. Stuart, Nature, 1996, 384, 341–343 CrossRef.
- S. D. Pollington, A. F. Lee, T. L. Overton, P. J. Sears, P. B. Wells, S. E. Hawley, I. D. Hudson, D. F. Lee and V. Ruddock, Chem. Commun., 1999, 725–726 RSC.
- Q. Wang, G.-D. Li, S. Xu, J.-X. Li and J.-S. Chen, J. Mater. Chem., 2008, 18, 1146 RSC.
- Z. R. Ismagilov, S. V. Kuntsevich, N. V. Shikina, V. V. Kuznetsov, M. A. Kerzhentsev, V. A. Ushakov, V. A. Rogov, A. I. Boronin and V. I. Zaikovsky, Catal. Today, 2010, 157, 217–222 CrossRef CAS.
- A. P. Amrute, F. Krumeich, C. Mondelli and J. Pérez-Ramírez, Chem. Sci., 2013, 4, 2209 RSC.
- Z. R. Ismagilov and S. V. Lazareva, Catal. Rev., 2013, 55, 135–209 CrossRef CAS.
- M. Gliński, G. Zalewski, E. Burno and A. Jerzak, Appl. Catal., A, 2014, 470, 278–284 CrossRef.
- S. H. Taylor, C. S. Heneghana, G. J. Hutchingsa and I. D. Hudsonb, Catal. Today, 2000, 59, 249–259 CrossRef CAS.
- E. Comini, Anal. Chim. Acta, 2006, 568, 28–40 CrossRef CAS PubMed.
- G. Korotcenkov, Mater. Sci. Eng., B, 2007, 139, 1–23 CrossRef CAS.
- S. Hu, H. Li, H. Liu, P. He and X. Wang, Small, 2015, 11, 2624–2630 CrossRef CAS PubMed.
- J. X. Wang, X. W. Sun, Y. Yang, H. Huang, Y. C. Lee, O. K. Tan and L. Vayssieres, Nanotechnology, 2006, 17, 4995–4998 CrossRef CAS.
- C. S. Rout, M. Hegde, A. Govindaraj and C. N. R. Rao, Nanotechnology, 2007, 18, 205504 CrossRef.
- C. Wang, X. Li, Y. Yuan, B. Wang, J. Huang, F. Xia, H. Zhang and J. Xiao, Sens. Actuators, B, 2017, 241, 268–275 CrossRef CAS.
- T. Meek, M. Hu and M. J. Haire, Semiconductive Properties of Uranium Oxides, 2018 Search PubMed.
- P.-F. Sui, Z.-H. Dai, X.-L. Zhang and Y.-C. Zhao, Chin. Phys. Lett., 2015, 32, 077101 CrossRef.
- H. He, D. A. Andersson, D. D. Allred and K. D. Rector, J. Phys. Chem. C, 2013, 117, 16540–16551 CrossRef CAS.
- S. H. Taylor, Heterogeneous Catalysis by Uranium Oxides, Wiley-VCH Verlag GmbH & Co. KGaA, 2009 Search PubMed.
- D. Hudry, C. Apostolidis, O. Walter, T. Gouder, E. Courtois, C. Kubel and D. Meyer, Chem.–Eur. J., 2013, 19, 5297–5305 CrossRef CAS PubMed.
- H. Wu, O. Chen, J. Zhuang, J. Lynch, D. LaMontagne, Y. Nagaoka and Y. C. Cao, J. Am. Chem. Soc., 2011, 133, 14327–14337 CrossRef CAS PubMed.
- H. Wu, A. Yongan Yang and Y. C. Cao, J. Am. Chem. Soc., 2006, 128, 16522–16523 CrossRef CAS PubMed.
- D. Hudry, J.-C. Griveau, C. Apostolidis, O. Walter, E. Colineau, G. Rasmussen, D. Wang, V. S. K. Chakravadhaluna, E. Courtois, C. Kübel and D. Meyer, Nano Res., 2013, 7, 119–131 CrossRef.
- L. Wang, R. Zhao, C. Z. Wang, L. Y. Yuan, Z. J. Gu, C. L. Xiao, S. A. Wang, X. W. Wang, Y. L. Zhao, Z. F. Chai and W. Q. Shi, Chem.–Eur. J., 2014, 20, 12655–12662 CrossRef CAS PubMed.
- M. Pradhan, S. Sarkar, A. K. Sinha, M. Basu and T. Pal, CrystEngComm, 2011, 13, 2878 RSC.
- R. Zhao, L. Wang, Z.-J. Gu, L.-Y. Yuan, C.-L. Xiao, Y.-L. Zhao, Z.-F. Chai and W.-Q. Shi, CrystEngComm, 2014, 16, 2645 RSC.
- D. D. Sood, J. Sol-Gel Sci. Technol., 2010, 59, 404–416 CrossRef.
- M. Brykala, A. Deptula, M. Rogowski, W. Lada, T. Olczak, D. Wawszczak, T. Smolinski, P. Wojtowicz and G. Modolo, J. Radioanal. Nucl. Chem., 2013, 299, 651–655 CrossRef PubMed.
- M. Martinez-Calvo, O. Kotova, M. E. Mobius, A. P. Bell, T. McCabe, J. J. Boland and T. Gunnlaugsson, J. Am. Chem. Soc., 2015, 137, 1983–1992 CrossRef CAS PubMed.
- T. Klawonn, A. Gansäuer, I. Winkler, T. Lauterbach, D. Franke, R. J. M. Nolte, M. C. Feiters, H. Börner, J. Hentschel and K. H. Dötz, Chem. Commun., 2007, 1894–1895 RSC.
- J. Liu, P. He, J. Yan, X. Fang, J. Peng, K. Liu and Y. Fang, Adv. Mater., 2008, 20, 2508–2511 CrossRef CAS.
- A. M. Amacher, J. Puigmartí-Luis, Y. Geng, V. Lebedev, V. Laukhin, K. Krämer, J. Hauser, D. B. Amabilino, S. Decurtins and S.-X. Liu, Chem. Commun., 2015, 51, 15063–15066 RSC.
- G. Meinrath, J. Alloys Compd., 1998, 275, 777–781 CrossRef.
- G. Meinrath, J. Radioanal. Nucl. Chem., 1997, 224, 119–126 CrossRef CAS.
- S. Tsushima, A. Rossberg, A. Ikeda, K. Müller and A. C. Scheinost, Inorg. Chem., 2007, 46, 10819–10826 CrossRef CAS PubMed.
- P. Zanonato, P. Di Bernardo, A. Bismondo, G. Liu, X. Chen and L. Rao, J. Am. Chem. Soc., 2004, 126, 5515–5522 CrossRef CAS PubMed.
- T. Loiseau, I. Mihalcea, N. Henry and C. Volkringer, Coord. Chem. Rev., 2014, 266–267, 69–109 CrossRef CAS.
- R. Bes, M. Rivenet, P. L. Solari, K. O. Kvashnina, A. C. Scheinost and P. M. Martin, Inorg. Chem., 2016, 55, 4260–4270 CrossRef CAS PubMed.
- F. Farges, C. W. Ponader, G. Calas and G. E. Brown, Geochim. Cosmochim. Acta, 1992, 56, 4205–4220 CrossRef CAS.
- E. Hudson, J. Rehr and J. Bucher, Phys. Rev. B: Condens. Matter Mater. Phys., 1995, 52, 13815–13826 CrossRef CAS PubMed.
- T. A. Marshall, K. Morris, G. T. Law, F. R. Livens, J. F. W. Mosselmans, P. Bots and S. Shaw, Environ. Sci. Technol., 2014, 48, 3724–3731 CrossRef CAS PubMed.
- D. J. Jones, J. Roziere, G. C. Allen and P. A. Tempest, J. Chem. Phys., 1986, 84, 6075–6082 CrossRef CAS.
- H. A. Thompson, G. E. Brown and G. A. Parks, Am. Mineral., 1997, 82, 483–496 CAS.
- C. N. Watanabe and M. H. Gehlen, J. Photochem. Photobiol., A, 2003, 156, 65–68 CrossRef CAS.
- K. Vidya, V. Kamble, N. Gupta and P. Selvam, J. Catal., 2007, 247, 1–19 CrossRef CAS.
- H. D. Burrows, J. Chem. Educ., 1978, 55, 125 CrossRef CAS.
- A. L. Patterson, Phys. Rev., 1939, 56, 978–982 CrossRef CAS.
- J. Chastain, R. C. King and J. Moulder, Handbook of X-ray photoelectron spectroscopy: a reference book of standard spectra for identification and interpretation of XPS data, Physical Electronics Division, Perkin-Elmer Corporation, Eden Prairie, Minnesota, 1992 Search PubMed.
- B. Bott, J. G. Firth, A. Jones, et al., Semi-conducting gas sensitive devices, US Pat., 3,865,550[P], 1975-2-11.
- S.-W. Choi, J. Y. Park and S. S. Kim, Nanotechnology, 2009, 20, 465603 CrossRef PubMed.
- A. Vomiero, S. Bianchi, E. Comini, G. Faglia, M. Ferroni and G. Sberveglieri, Cryst. Growth Des., 2007, 7, 2500–2504 CrossRef CAS.
- Z. Liu, M. Miyauchi, T. Yamazaki and Y. Shen, Sens. Actuators, B, 2009, 140, 514–519 CrossRef CAS.
- A. Gurlo and R. Riedel, Angew. Chem., Int. Ed., 2007, 46, 3826–3848 CrossRef CAS PubMed.
- J. Bates, C. Hinman and T. Kawada, J. Am. Ceram. Soc., 1967, 50, 652–656 CrossRef CAS.
- C. Colmenares, Prog. Solid State Chem., 1975, 9, 139–239 CrossRef CAS.
- O. L. G. Alderman, C. J. Benmore, J. K. R. Weber, L. B. Skinner, A. J. Tamalonis, S. Sendelbach, A. Hebden and M. A. Williamson, Appl. Phys. Lett., 2017, 110, 081904 CrossRef.
- I. I. Kapshukov, N. V. Lyalyushkin, L. V. Sudakov, A. S. Bevz and O. V. Skiba, J. Radioanal. Nucl. Chem., 1990, 143, 213–220 CrossRef CAS.
- G. Allen and N. Holmes, Can. J. Appl. Spectrosc., 1993, 38, 124–130 CAS.
- A. W. Bott, Curr. Sep., 1998, 17, 87–92 CAS.
- K. Gelderman, L. Lee and S. Donne, J. Chem. Educ., 2007, 84, 685–688 CrossRef CAS.
- T. Meek, M. Hu and M. J. Haire, Presented in part at the Waste Management 2001 Symposium, 2001 Search PubMed.
- M. Mashock, K. Yu, S. Cui, S. Mao, G. Lu and J. Chen, ACS Appl. Mater. Interfaces, 2012, 4, 4192–4199 CrossRef CAS PubMed.
- H. S. Woo, C. W. Na, I. D. Kim and J. H. Lee, Nanotechnology, 2012, 23, 245501 CrossRef PubMed.
Footnote |
| † Electronic supplementary information (ESI) available. See DOI: 10.1039/d0na00224k |
| This journal is © The Royal Society of Chemistry 2020 |

