 Open Access Article
Development of BiFeO3/MnFe2O4 ferrite nanocomposites with enhanced magnetic and electrical properties†
K. P.
Remya
,
R.
Rajalakshmi
and
N.
Ponpandian
 *
*
Department of Nanoscience and Technology, Bharathiar University, Coimbatore 641046, India. E-mail: ponpandian@buc.edu.in; Tel: +91-422-2428421
First published on 14th May 2020
Abstract
Herein we report the development of novel multiferroic nanocomposites for their enhanced magnetic and electrical properties by employing a simple cost-effective chemical process at low temperatures. Novel perovskite-mixed spinel nanocomposites of (1 − x)BiFeO3/xMnFe2O4 where x = 0.1–0.5 have been prepared by a sol–gel auto-combustion technique. The calcination temperature was optimized and the phase formation of BiFeO3/MnFe2O4 nanocomposites was confirmed from the X-ray diffraction patterns for the samples calcined at 500 °C for 2 h. The grain sizes have been found to vary from 60 to 90 nm. The vibrational modes of the prepared nanocomposites were studied using Raman spectroscopy and FESEM and EDX were used to carry out the microstructural and composition analysis respectively. The magnetic properties seemed to have a strong dependence on the concentration of the spinel ferrite in the composite system. Saturation magnetization and coercivity exhibit an increase with increase in the MnFe2O4 content. The electrical properties from solid state impedance analysis confirm the non-Debye characteristics and the maximum activation energy is 0.931 eV for the 0.5BiFeO3/0.5MnFe2O4 nanocomposite. Dispersion in the dielectric constant and dielectric loss in the low frequency range has also been determined, which decreases with increase in temperature at lower ac frequencies.
Introduction
Multiferroic BiFeO3 (BFO) has received extensive attention in the last few decades as it manifests a rare combination of both anti-ferromagnetic and ferroelectric properties, coexisting at room temperature. Bismuth ferrite adopts a rhombohedrally distorted perovskite structure in its bulk form where the Bi3+ and Fe3+ cations are displaced from their centrosymmetric positions along the (111) axis.1,2 Its ferroelectric order exhibits a high Curie temperature (TC) of 1100 K which originates from the activity of the Bi3+ lone electron pair and the magnetic structure exhibits G-type antiferromagnetism having a Néel temperature below TN ∼ 640 K,3,4 with a modulated spin spiral structure of periodicity 62 nm. This is associated with a ferroelectric polarization of P ∼ 100 μC cm−2, the largest value among all known multiferroics.5,6 BFO being a lead free material opens new vistas for promising environment friendly applications such as in ferroelectric memory devices, spintronic applications, magnetic recording media, spin valve devices, sensors, actuators, ultrahigh speed telecommunication devices and so on.7–10Magnetoelectric interactions are also reported in BFO owing to the simultaneous presence of ferroelectricity and magnetism in the system.11,12 However, the absence of bulk magnetic moment is one of the major problems which are caused by the spatial modulation of magnetization leading to a net “zero” magnetoelectric response. Other major factors that hinder the practical applications of BiFeO3 in devices include leakage current and dielectric losses, lower magnetic coupling coefficients, difference in ferroic transition temperatures, and the difficulty to synthesize single-phase BFO perovskites.7,13–15 It has been reported earlier that BFO at the nanoscale possesses high surface area and a large number of surface-active sites for reactions resulting in enhanced physicochemical properties. Similarly, chemical substitution at the Bi and/or Fe site is also a strategy proven to effectively overcome BFO limitations. Another approach for enhancing the physical properties of the BFO system is to form composites with different materials.16–19
Synthesizing composite structures at the nanoscale has become an attractive approach for designing new multiferroic materials and is gaining much attention as they show multifunctionality arising from the properties and geometries of the constituting phases.20 Both powder and thin film nanocomposites of BiFeO3 have been studied to date including those with ferrites of Mg, Co, Cu, Ni, Zn, and with PZT/BaTiO3etc.21–27 A slow increment of coercivity has been reported in nickel ferrite–bismuth ferrite nanocomposites with the decrease of temperature.23 BFO/FeCo multiferroics demonstrated the electric control of exchange bias in BFO with magnetic FeCo.26 Composites of magnetostrictive CoFe2O4 with BiFeO3 have been extensively investigated owing to their well-defined nanostructures with strong multiferroic properties.24 These multiferroic composites that combine ferroelectric/ferrimagnetic phases typically result in enhanced multiferroic properties. Herein, a hetero phase system constituting BiFeO3/MnFe2O4 is taken as the model multifunctional composite where BiFeO3 contributes ferroelectricity, and ferrimagnetism is from MnFe2O4. The nanocomposites of BiFeO3/MnFe2O4 possessing the virtue of the individual components are explored focusing on magnetic and electrical properties correlated with their microstructures. These properties are critically dependent on the nanostructure, shape and interfaces, and hence the synthetic procedure, calcination temperature, etc., play an important role in the performance of the nanocomposite.
On the other hand, manganese ferrite (MnFe2O4) belongs to a group of soft ferrite materials having a spinel structure where Mn2+ ions occupy tetrahedral sites and Fe3+ ions occupy both octahedral and tetrahedral sites. The ferrite is characterized by high magnetic permeability, low coercivity and low losses combined with good chemical stability and mechanical hardness. Bulk MnFe2O4 has a saturation magnetization of 80 emu g−1 at room temperature.28 The present work explains the successful synthesis of (1 − x)BiFeO3/xMnFe2O4 composites by the sol–gel method where x = 0.10, 0.20, 0.30, 0.40 and 0.50 and a systematic investigation of their physicochemical properties. The as-prepared nanocomposites have been characterized by a variety of techniques to study their structural, morphological, and vibrational properties. The magnetic and electrical properties of the nanocomposites were also studied in depth, which has been attempted hitherto. Eventually, an attempt was also made to correlate the above mentioned structural, morphological, compositional, vibrational, magnetic, and electrical properties.
Experimental methods
BiFeO3/MnFe2O4 nanocomposites were prepared by the sol–gel mediated auto-combustion method.21 All the precursors used for the synthesis were of analytical grade. In the synthesis of the nanocomposites, the precursors required for BiFeO3 and MnFe2O4 were dissolved separately in two different beakers and formed into corresponding hydroxides. 13.09 g Bi(NO3)3·5H2O, and 11 g Fe(NO3)3·9H2O were added to 30 ml of distilled water + dil. HNO3 to obtain a 0.9 M solution of BiFeO3. Simultaneously, a 0.1 M solution of MnFe2O4 was obtained by dissolving 807 mg Mn(NO3)2·5H2O, and 1.2 g Fe(NO3)3·9H2O in 30 ml distilled water forming a clear solution. Both solutions were mixed by vigorous stirring. Furthermore, an aqueous solution of citric acid with metal nitrates taken in the ratio 1![[thin space (1/6-em)]](https://www.rsc.org/images/entities/char_2009.gif) :
:![[thin space (1/6-em)]](https://www.rsc.org/images/entities/char_2009.gif) 1 was added dropwise to the solution under continuous stirring, inducing chelation on the corresponding cations. After the formation of a gel, the system was maintained at 90 °C under stirring for the complete evaporation of the solvent. The water content was evaporated until a mass was obtained, which underwent self-ignition resulting in the final product. The final product was then crushed in a mortar and pestle and well ground to obtain a finely powdered sample. It was calcined further at 500 °C for 2 h to obtain the desired nanocomposite powder of 0.9BiFeO3/0.1MnFe2O4. A similar approach was employed for other compositions as well. The samples were coded as MnFe/BFO (0.1), MnFe/BFO (0.2), MnFe/BFO (0.3), MnFe/BFO (0.4), MnFe/BFO (0.5) for the samples (1 − x)BiFeO3/xMnFe2O4 for x = 0.10–0.50 for the ease of understanding.
1 was added dropwise to the solution under continuous stirring, inducing chelation on the corresponding cations. After the formation of a gel, the system was maintained at 90 °C under stirring for the complete evaporation of the solvent. The water content was evaporated until a mass was obtained, which underwent self-ignition resulting in the final product. The final product was then crushed in a mortar and pestle and well ground to obtain a finely powdered sample. It was calcined further at 500 °C for 2 h to obtain the desired nanocomposite powder of 0.9BiFeO3/0.1MnFe2O4. A similar approach was employed for other compositions as well. The samples were coded as MnFe/BFO (0.1), MnFe/BFO (0.2), MnFe/BFO (0.3), MnFe/BFO (0.4), MnFe/BFO (0.5) for the samples (1 − x)BiFeO3/xMnFe2O4 for x = 0.10–0.50 for the ease of understanding.
The diffraction patterns were recorded using a Rigaku D/MAX-2400 X-ray diffractometer employing high intensity CuKα radiation. Raman spectroscopic studies were carried out using a Horiba LabRam HR800, using an Ar+ laser of 514 nm and the surface morphology of the samples was determined using a field-emission scanning electron microscope (FESEM, FEI quanta-250 FEG) equipped with an energy dispersive X-ray spectrometer (EDS). A Lake Shore model 7400 vibrating sample magnetometer was used to measure the magnetic hysteresis loop. Polarization vs. electric field (P–E loop) measurement was performed with the help of a Precision Premier II multiferroic test system (Radiant Technology, USA). To measure the electrical properties, the synthesized nanoparticles were pelletized into circular discs by using a hydraulic press with the dimensions of 15 mm × 2 mm. The powder samples were made into pellets after mixing with a few drops of a PVA binder and pressed using a hydraulic press and a Solartron-SI 1260 impedance/gainphase analyzer was used for measurements. By applying a constant voltage across the sample and using the impedance analyzer the real and imaginary part of the complex impedance (Z′ and Z′′) was measured in the frequency range 1 kHz to 1 MHz and the temperature range of 40–340 °C. Before measurements, each sample was heated at 450 °C for 1 h in an oven to get rid of the binder and any moisture. Both the surfaces of the pellet were polished and coated with silver paste to make a good contact for measuring the properties.
Results and discussion
XRD analysis
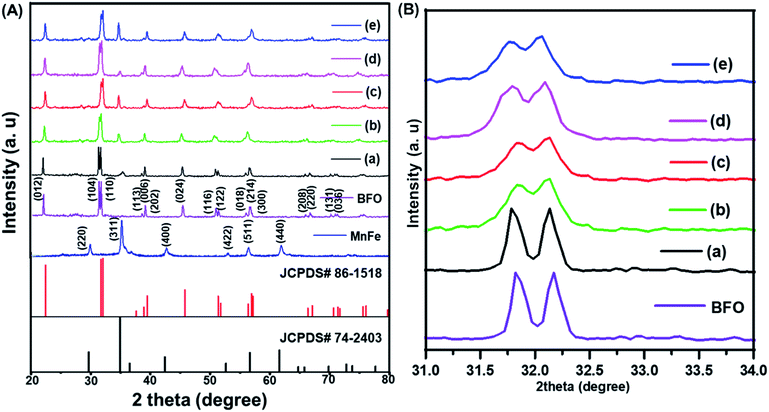
The XRD patterns of (1 − x)BiFeO3/xMnFe2O4 nanocomposites annealed at 500 °C are shown in Fig. 1A. The broadening of the peaks in the XRD pattern can be attributed to the nanoscale nature of the samples. The observed peaks could be indexed to the rhombohedral structure of BiFeO3 and matched with JCPDS #86-1518 and the cubic structure of MnFe2O4 with JCPDS #74-2403 along with a few impurity peaks corresponds to Bi36Fe2O57 with JCPDS #42-0181. There are no other impurity peaks observed. These impurities were obtained during the low temperature synthesis of BiFeO3 due to its chemical kinetics.29 The formation of a spinel–perovskite mixed structure is confirmed by means of the obtained XRD results. For MnFe2O4 the highly intense peak is (311) and for BFO the (110) peak is more intense. It has been observed that these two well-defined peaks are present for the prepared nanocomposite samples. The intensity of the peaks corresponding to Mn ferrite increases with increase in the MnFe2O4 concentration as expected and impurity peaks are reduced. The ferrite and perovskite phases constituting the nanocomposite result in the corresponding cubic and rhombohedral structures of the individual phases.22 The average crystallite size of the prepared nanocomposites is calculated using the Debye–Scherrer formula and it has been found to be 68, 74, 87, 91 and 102 nm for x = 0.1, 0.2, 0.3, 0.4, and 0.5 respectively.Fig. 1B shows the enlarged XRD pattern in the region of 31–34°. The most intense peaks in this region of the BiFeO3 phase are shifted to lower angles which means increase in the lattice parameters with the increase in the MnFe2O4 content. This confirms the continual structural distortion in the prepared composites annealed at 500 °C with different concentrations of the antiferromagnetic and soft magnetic phase.21
Raman analysis
Fig. 2 displays the Raman spectra of (1 − x)BiFeO3/xMnFe2O4 (BFO/MnFe) composites which are acquired at room temperature. The peaks corresponding to BiFeO3 and MnFe2O4 are observed for the composites, which further supports the results obtained by XRD. It has already been known from previous reports that the Raman spectrum of BFO ceramics, having a rhombohedral perovskite structure with random orientation of grains, has 13 phonon peaks – 4A1 and 9E modes.30 The Raman modes at low frequency correspond to the Bi–O bond and the high-frequency phonon modes correspond to that of Fe–O. MnFe2O4 has a spinel structure in which the Mn2+ ions occupy the tetrahedral (A-site) position and Fe3+ ions occupy the octahedral (B site) positions. According to group theory, the spinel structure has 5 Raman active modes namely, A1g, Eg, and 3T2g. MnFe2O4 shows major peaks at 214, 271, 380, 484, and 590 cm−1 where 214, 380 and 484 cm−1 peaks belong to symmetry type T2 and those at 271 and 590 cm−1 represent the E and A modes respectively.30–32 The mode at 590–670 cm−1 can be considered as A1 symmetry, representing manganese ion stretching. The other low frequency modes may represent the characteristic vibrations at the octahedral site.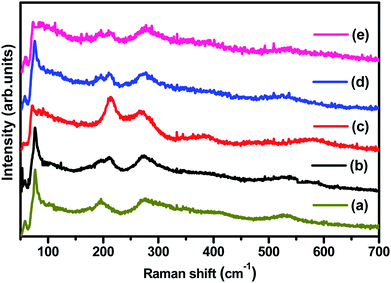 | ||
| Fig. 2 (a–e) Raman spectra of (1 − x)BiFeO3/xMnFe2O4 nanocomposites where x = 0.10, 0.20, 0.30, 0.40, and 0.50 respectively. | ||
The (1 − x)BiFeO3/xMnFe2O4 composites showed the phonon modes of both spinel and perovskite structures with some shift in the peak positions. Not all the Raman modes of the constituent ferrites are observed in the composites, but the spectra clearly reveal the presence of both MnFe2O4 and BiFeO3. The deconvoluted Raman spectrum of 0.9BiFeO3/0.1MnFe2O4 (MnFe/BFO (0.1)) is given in Fig. S1a† as an example. The higher phonon modes (Fig. S1b in ESI†) do not exhibit the characteristic peaks at 2A1-4 and 2E-8 and the 2E-9 mode is seen as a broad peak, which also shows a decreasing effect with the increase in the ferrite content. The modes namely 2E-8 and 2E-9 are associated with the magnetic characteristic of BFO and are due to Fe–O1 bonds and Fe–O2 bonds respectively, where O1 are axial ions and O2 are equilateral ions contributed by the Fe–O6 octahedra. The broadening and lowering intensity of these modes might be indicative of the structural transition from non-centrosymmetric to more centrosymmetric structural33 vibrations at the octahedral site.
FESEM analysis
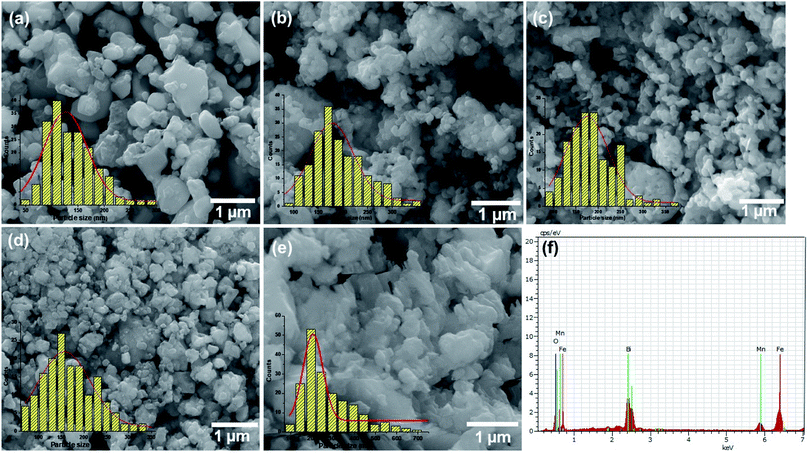
The FESEM micrographs of all the composites are shown in Fig. 3a–e and the EDX spectrum is given Fig. 3f and was similar for all the prepared samples (Fig. S2 in the ESI†). It can be seen that the particles have an irregular shape and the size increases with increase in the concentrations of MnFe2O4. Particle size distribution histograms obtained from the SEM images are shown at the bottom-left corners of the corresponding images. The size distributions are found to be relatively broad with average particle sizes of 80, 87, 93, 95 and 110 nm respectively for the samples with the increasing concentration of MnFe2O4. The EDX spectra of the prepared BiFeO3/MnFe2O4 nanocomposites revealed only the presence of Mn, Bi, Fe, and O, which ruled out the presence of any other element in the prepared perovskite/spinel ferrite nanocomposites.Magnetic studies
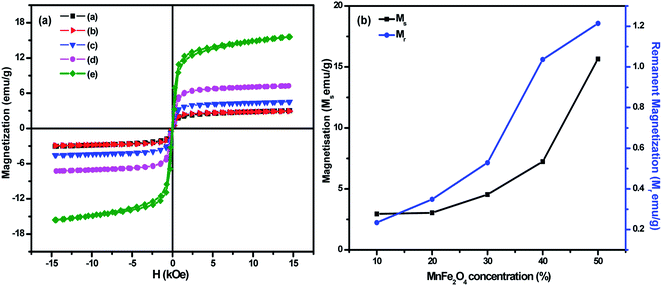
Variation of magnetization with an applied magnetic field of 15 kOe for (1 − x)BiFeO3/xMnFe2O4 nanocomposites with x = 0.10, 0.20, 0.30, 0.40 and 0.50 are shown in Fig. 4a. The saturation magnetization of pure BiFeO3 and MnFe2O4 was determined to be 0.67 and 49 emu g−1 respectively (Fig. S3 in the ESI†). The Ms value observed in BiFeO3 nanoparticles can be attributed to the suppression of the known spiral spin structure having a period length of ∼62 nm and the uncompensated spins at the surface of particles at the nanoscale.34 The magnetization of the composites increases with the increase in MnFe2O4 concentration. The maximum magnetization was found to be 15 emu g−1 for the MnFe/BFO(0.5) nanocomposite. The magnetization has increased considerably with the increase in the spinel ferrite concentration and this phenomenon is due to the fact that MnFe2O4 is a soft magnetic ferrite. The spontaneous magnetization of the nanocomposites results from the unbalanced antiparallel spins of ferrimagnetic MnFe2O4. With the increasing composition of the soft ferrite in the nanocomposite, the interaction of the magnetic dipoles on the magnetic powders improves and results in enhanced magnetic properties. The increment in coercivity can be attributed to its size dependency. A very small increase in the grain size could affect the coercivity of the nanoscale system.21,35 Here an increase in the grain size of the nanocomposite with an increase in the MnFe2O4 concentration contributes to a rise in coercivity. The obtained results are compared with those from literature studies and the inference is consolidated in Table 2. Fig. 4b shows the variation of Ms and Mr with the increase in the MnFe2O4 concentration. The saturation and remanent magnetization exhibit a similar increase which can be attributed to the increase in the ferrite phase in the material of interest. A similar type of observation was reported earlier.22,36 The observed magnetic properties such as saturation magnetization, remanent magnetization and coercivity of the prepared BiFeO3/MnFe2O4 nanocomposites are consolidated in Table 1.| Samples | M s (emu g−1) | M r (emu g−1) | H c (kOe) |
|---|---|---|---|
| BiFeO3 | 0.67 | 0.019 | 0.0190 |
| BiFeO3/MnFe2O4(0.1) | 2.95 | 0.234 | 0.0513 |
| BiFeO3/MnFe2O4(0.2) | 3.04 | 0.349 | 0.0602 |
| BiFeO3/MnFe2O4(0.3) | 4.538 | 0.529 | 0.0857 |
| BiFeO3/MnFe2O4(0.4) | 7.237 | 1.037 | 0.0910 |
| BiFeO3/MnFe2O4(0.5) | 15.65 | 1.214 | 0.1101 |
| MnFe2O4 | 49.00 | 6.640 | 0.044 |
| Composite | Method | Annealing/growth temperature | M s (emu g−1)/(emu cm−3) | M r (emu g−1)/(emu cm−3) | Reference |
|---|---|---|---|---|---|
| ZnFe2O4–BiFeO3 | Sol–gel method | 500 °C | 0.5 | 0.04 | 21 |
| BiFeO3–MgFe2O4 | Sol–gel method | 500 °C | 8.95 | 0.77 | 22 |
| CrFe2O4–BiFeO3 | Sol–gel method | 700 °C | 0.88 | — | 36 |
| BaTiO3–BiFeO3 | Pulsed-laser deposition | 680 °C | 2.3 | — | 27 |
| Li0.5Fe2.5O4–BiFeO3 | Mixing the two phases | 600 °C | 20 | 5.0 | 37 |
| CoFe2O4–BiFeO3 | Self-assembly | 680 °C | 85 | — | 38 |
| 0.7BiFeO3-0.3BaTiO3–Y3Fe5O12 | Modified solid-state route | 1000–1100 °C | 8 | — | 39 |
| MnFe2O4–BiFeO3 | Sol–gel method | 500 °C | 15.65 | 1.2 | Present work |
Electrical studies – impedance analysis
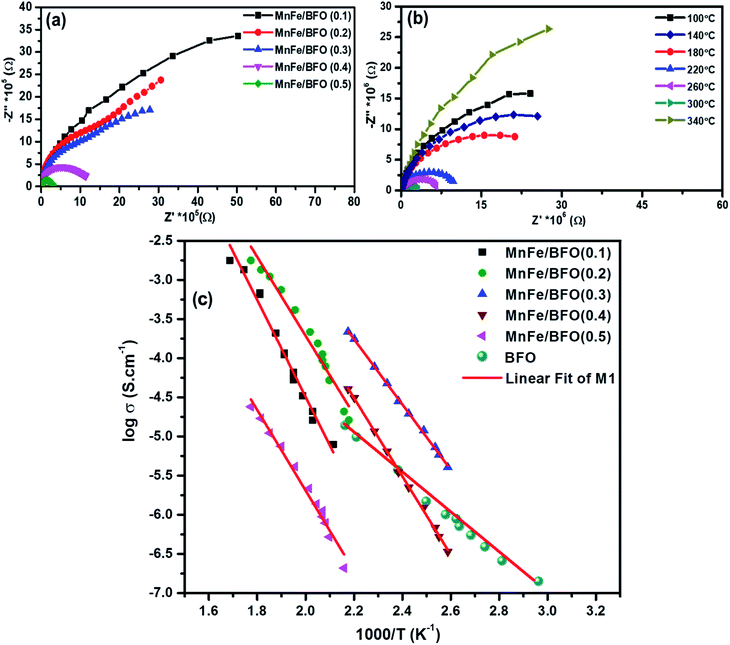
The complex impedance spectra of the nanocomposite samples are shown in Fig. 5a and b respectively. Fig. 5a shows the Nyquist plot of (1 − x)BiFeO3/xMnFe2O4 nanocomposites with x = 0.10, 0.20, 0.30, 0.40 and 0.50 for a frequency range from 1 kHz to 1 MHz. According to Debye's models, a material having a single relaxation time gives rise to an ideal semicircle centered on the real (Z′) axis. The presence of an asymmetric or a distorted semicircle suggests the existence of a non-Debye type of relaxation in the material where there is a distribution of relaxation time rather than a single relaxation time. Herein, the impedance plot typically comprised a single semicircular arc with the center below the real axis proposing the departure from ideal Debye characteristics.40 The possible factors accountable for the occurrence of the broad peak as a single semicircle in the Nyquist plot of the (1 − x)BiFeO3/xMnFe2O4 nanocomposites may be due to the equal contributions from the grains and the grain boundaries with the applied external field. This could perhaps be due to the resistances offered by the grains and the grain boundaries which may not be much different from each other as inferred from the corresponding fine-grained microstructure. As there is an increase in the ferrite concentration there is a decrease in the diameter of the semicircle indicating an increase in conductivity. In order to evaluate the impedance characteristics more, temperature dependent impedance measurements have also been carried out in the same frequency range. For temperature dependent analysis, the powder samples having better magnetic properties are chosen for effective comparison and the observations are depicted in Fig. 5b. Initially a decrease in the intercepts made by semicircles on the real x-axis is observed with the increase in temperature from 100–300 °C. This indicates a decrease in resistance with an increase in temperature, which is an effect analogous to the negative temperature coefficient of resistance a characteristic behavior of semiconductors. There is a deviation in the behavior at 340 °C which might be due to the sample denaturing at this temperature. The activation energy of the prepared nanocomposite samples was calculated from the Arrhenius plot as shown in Fig. 5c. The highest value of Ea was found to be 0.931 eV for 0.5BiFeO3/0.5MnFe2O4.Dielectric studies
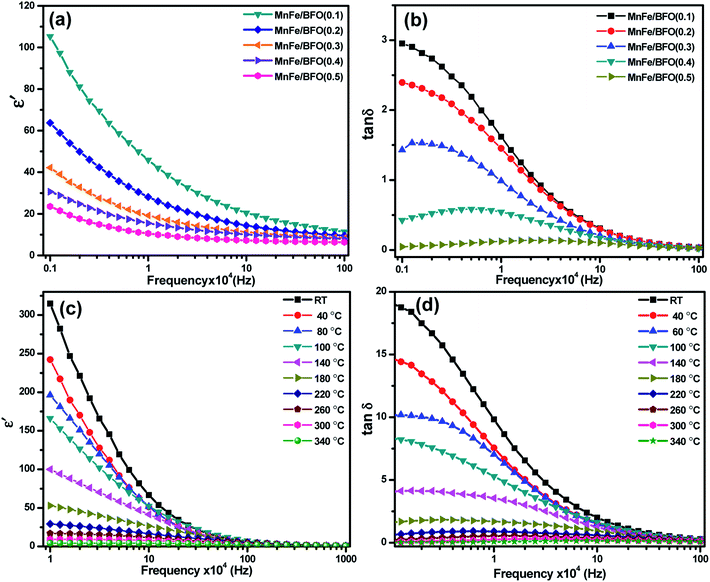
Room temperature dielectric measurements with the frequency range from 1 kHz to 1 MHz are shown in Fig. 6. The samples annealed at 500 °C were taken for dielectric studies. It was found that the value of ε′ is higher in the low frequency region, decreases with further increase in frequency and becomes almost constant in a higher frequency region indicating large dielectric dispersion. These characteristics where the value of the dielectric constant is high at low frequency and low at high frequency indicate large dielectric dispersion due to Maxwell–Wagner type interfacial polarization.41 This kind of relaxation mechanism is correlated with the uncompensated surface charges within the nanocomposite at the perovskite–spinel interfaces. With the addition of MnFe2O4, there is a decrease in the dielectric. The inhomogeneties present in the dielectric structure such as the porosity and grain structure for the prepared ferrite–ferroelectric system, could be one of the reasons for the high values of the dielectric constant. However, for the composites, a high value of the dielectric constant can also be due to the fact that ferroelectric regions in the system are surrounded by non-ferroelectric regions similar to the instance of relaxor ferroelectric materials.42 This gives rise to interfacial polarisation. Room temperature dielectric loss measurements with respect to frequency in the same region are shown in Fig. 6b, which shows a decrease with increase in the MnFe2O4 content. Temperature dependent dielectric studies were carried out in the temperature range 40–340 °C. However, the composites exhibit typical temperature dependent electrical constant behavior as most of the polar dielectrics. The dielectric constant is maximum at room temperature and decreases with increase in temperature at lower frequencies of the applied ac field. Dielectric loss also exhibits a similar phenomenon.Ferroelectric studies
The ferroelectric properties of the prepared nanocomposites were recorded at room temperature using the P–E hysteresis loop at a frequency of 100 Hz and different voltages from 1–5 kV. The observed saturation polarization (Ps), remnant polarization (Pr) and coercive field (Ec) values are 0.64 μC cm−2, 0.97 μC cm−2, 18.8 kV cm−1 respectively. A dilution effect in the ferroelectric nature was observed as shown in Fig. 7 due to the magnetic nature of MnFe2O4 and hence there is a decrease in ferroelectricity. The decrease in polarization can also be ascribed to the fact that the interface in the ferrite–ferroelectric composite increases with increase in the concentration of MnFe2O4 and these interfaces are low permittivity regions meaning the interfaces have poor ferroelectricity. Larger values of the coercive field for the 0.5BiFeO3/0.5MnFe2O4 nanocomposite are attributed to the fact that MnFe2O4 shows the pinning effect on depolarization and hence the larger value of the coercive field is observed in the system having an embedded spinel ferrite.43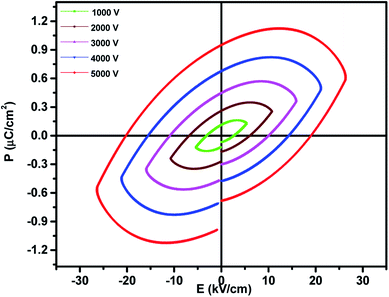 | ||
| Fig. 7 Room temperature P–E loops of 0.5BiFeO3/0.5MnFe2O4 nanostructures at 1–5 kV and a frequency of 100 Hz. | ||
Conclusion
The perovskite/mixed spinel structured (1 − x)BiFeO3/xMnFe2O4 nanocomposites with x = 0.10, 0.20, 0.30, 0.40, and 0.50 were successfully synthesized by the simple sol–gel process. The prepared powders were characterized using XRD, Raman spectroscopy and FESEM to understand the structural and morphological properties. Composite formation was confirmed from the XRD pattern and the grain size seems to increase with the MnFe2O4 content. The magnetic properties of the nanocomposite system differed with the ferrite concentration and the saturation magnetization and coercivity values varied with the composition of ferrite phase. The dielectric behavior was explained using Maxwell–Wagner theory. The composite having an equal composition of MnFe2O4 and BiFeO3 exhibits better properties in comparison with those with the other concentrations.Conflicts of interest
There are no conflicts to declare.Acknowledgements
The authors would like to acknowledge UGC-DAE CSR, Kalpakkam Node for financial support through the collaborative research project, DST-FIST and DST-PURSE, and the Government of India for the instrumental facilities.References
- N. A. Spaldin, S. W. Cheong and R. Ramesh, Phys. Today, 2010, 63, 38 CrossRef.
- L. W. Martin, Y.-H. Chu, Q. Zhan, R. Ramesh, S.-J. Han and S. X. Wang, Appl. Phys. Lett., 2007, 91, 172513 CrossRef.
- S. V. Kiselev, R. P. Ozerov and G. S. Zhdanov, Sov. Phys. Dokl., 1963, 7, 742 Search PubMed.
- J. Silva, A. Reyes, H. Esparza, H. Camacho and L. Fuentes, Integr. Ferroelectr., 2011, 126(1), 47 CrossRef CAS.
- C. Ederer and N. A. Spaldin, Phys. Rev. B: Condens. Matter Mater. Phys., 2005, 71, 060401 CrossRef.
- I. Sosnowska, T. Peterlin-Neumaier and E. Steichele, J. Phys. C: Solid State Phys., 1982, 15, 4835 CrossRef CAS.
- G. Catalan and J. F. Scott, Adv. Mater., 2009, 21, 2463 CrossRef CAS.
- S. Y. Yang, L. W. Martin and S. J. Byrnes, Appl. Phys. Lett., 2009, 95, 062909 CrossRef.
- T. Tong, J. Chen, D. Jin and J. Cheng, Mater. Lett., 2017, 197, 160 CrossRef CAS.
- B. Sun, M. Tang, J. Gao and C. M. Li, ChemElectroChem, 2016, 3, 896 CrossRef CAS.
- P. Ravindran, R. Vidya, A. Kjekshus and H. Fjellvåg, Phys. Rev. B: Condens. Matter Mater. Phys., 2006, 74, 224412 CrossRef.
- R. K. Kotnala, R. Gupta and S. Chaudhary, Appl. Phys. Lett., 2015, 107, 082908 CrossRef.
- R. Palai, H. Schmid, J. F. Scott and R. S. Katiyar, Phys. Rev. B: Condens. Matter Mater. Phys., 2010, 81, 064110 CrossRef.
- D. P. Dutta, O. D. Jayakumar, A. K. Tyagi, K. G. Girija, C. G. S. Pillai and G. Sharma, Nanoscale, 2010, 2, 1149 RSC.
- C. M. Raghavan, J. W. Kim and S. S. Kim, J. Am. Ceram. Soc., 2014, 97, 235 CrossRef CAS.
- H. Zhang and K. Kajiyoshi, J. Am. Ceram. Soc., 2010, 93, 3842 CrossRef CAS.
- R. Mazumder, P. S. Devi, D. Bhattacharya, P. Choudhury, A. Sen and M. Raja, Appl. Phys. Lett., 2007, 91, 062510 CrossRef.
- K. P. Remya, S. Amirthapandian, M. Manivel Raja, C. Viswanathan and N. Ponpandian, J. Appl. Phys., 2016, 120, 134304 CrossRef.
- J. Khajonrit, U. Wongpratat, P. Kidkhunthod, S. Pinitsoontorn and S. Maensiri, J. Magn. Magn. Mater., 2018, 449, 423 CrossRef CAS.
- J. G. Wan, X. W. Wang, Y. J. Wu, M. Zeng, Y. Wang, H. Jiang, W. Q. Zhou, G. H. Wang and J. M. Liu, Appl. Phys. Lett., 2005, 86, 122501 CrossRef.
- P. Uniyal and K. L. Yadav, J. Alloys Compd., 2010, 492, 406–410 CrossRef CAS.
- H. Singh and K. L. Yadav, J. Am. Ceram. Soc., 2015, 98, 574 CrossRef CAS.
- J. H. He, J. G. Guan and W. Wang, J. Magn. Magn. Mater., 2012, 324, 1095 CrossRef CAS.
- N. M. Aimon, D. H. Kim, H. K. Choi and C. A. Ross, Appl. Phys. Lett., 2012, 100, 092901 CrossRef.
- S. Priyadarshini, D. Patnaik, J. Nanda and D. K. Mishra, Adv. Sci. Lett., 2016, 22, 388 CrossRef.
- Y.-H. Chu, L. W. Martin, M. B. Holcomb, M. Gajek, S.-J. Han, Q. He, N. Blake, C.-H. Yang, D. Lee, W. Hu, Q. Zhan, P.-L. Yang, A. Fraile- Rodriguez, A. Scholl, S. X. Wang and R. Ramesh, Nat. Mater., 2008, 7, 478 CrossRef CAS PubMed.
- M. Lorenz, V. Lazenka, P. Schwinkendorf, F. Bern, M. Ziese, H. Modarresi, A. Volodin, M. J. Van Bael, K. Temst, A. Vantomme and M. Grundmann, J. Phys. D: Appl. Phys., 2014, 47, 135303 CrossRef.
- K. H. J. Buschow, Handbook of Magnetic Materials, Elesiver North-Holland, Amsterdam, 1995, vol. 8, p. 212 Search PubMed.
- M. I. Morozov, N. A. Lomanova and V. V. Gusarov, Russ. J. Gen. Chem., 2003, 73, 1676 CrossRef CAS.
- M. K. Singh, H. M. Jang, S. Ryu and M.-H. Jo, Appl. Phys. Lett., 2006, 88, 042907 CrossRef.
- P. Hermet, M. Goffinet, J. Kreisel and P. Ghosez, Phys. Rev. B: Condens. Matter Mater. Phys., 2007, 75, 220102(R) CrossRef.
- A. A. Porporati, K. Tsuji, M. Valant, A.-K. Axelsson and G. Pezzotti, J. Raman Spectrosc., 2010, 41, 84 CrossRef CAS.
- D. Kothari, V. R. Reddy, V. G. Sathe, A. Gupta, A. Banerjee and A. M. Awasthi, J. Magn. Magn. Mater., 2008, 320, 548 CrossRef CAS.
- F. Huang, X. Xu, X. Lu, M. Zhou, H. Sang and J. Zhou, Sci. Rep., 2018, 8, 2311 CrossRef PubMed.
- J. S. Bangruwa, S. Kumar, A. Chauhan, P. Kumar and V. Verma, J. Supercond. Novel Magn., 2019, 32, 2559 CrossRef CAS.
- A. Kumar, K. L. Yadav, H. Singh, R. Pandu and P. Ravinder Reddy, Phys. B, 2010, 405, 2362 CrossRef CAS.
- S. Layek, S. K. Bag and H. C. Verma, Adv. Mater. Lett., 2013, 4, 26 CrossRef.
- H. K. Choi, N. M. Aimon, D. H. Kim, X. Y. Sun, J. Gwyther, I. Manners and C. A. Ross, ACS Nano, 2014, 8, 9248 CrossRef CAS PubMed.
- H. Yang, Q. Ke, H. Si and J. Chen, J. Appl. Phys., 2012, 111, 024104 CrossRef.
- J. R. Macdonald, Impedance spectroscopy, emphasizing solid materials and systems, Wiley, New York, 1987 Search PubMed.
- J. C. Maxwell, Electricity and Magnetism, Oxford University Press, London, 1973 Search PubMed.
- K. K. Patankar, S. A. Patil, V. Sivakumar, R. P. Mahajan, Y. D. Kolekar and M. B. Kothale, Mater. Chem. Phys., 2000, 65, 97 CrossRef CAS.
- R. Rani, P. Kumar, S. Singh, J. K. Juneja, K. K. Raina and C. Prakash, Ferroelectr., Lett. Sect., 2011, 38, 108 CrossRef CAS.
Footnote |
| † Electronic supplementary information (ESI) available. See DOI: 10.1039/d0na00255k |
| This journal is © The Royal Society of Chemistry 2020 |

