 Open Access Article
Dynamics in polyelectrolyte/microemulsion complexes†
Miriam
Simon
 *a,
Michael
Gradzielski
 *a and
Ingo
Hoffmann
 *b
*b
aStranski-Laboratorium für Physikalische und Theoretische Chemie, Institut für Chemie, Technische Universität Berlin, Straße des 17. Juni 124, Sekr. TC 7, D-10623 Berlin, Germany. E-mail: miriam.simon@tu-berlin.de; michael.gradzielski@tu-berlin.de
bInstitut Max von Laue-Paul Langevin (ILL), 71 avenue des Martyrs, CS 20156, F-38042 Grenoble Cedex 9, France. E-mail: hoffmann@ill.fr
First published on 20th August 2020
Abstract
Oil-in-water (O/W) microemulsion droplets are convenient carriers for hydrophobic molecules in an aqueous phase and are used for a wide range of applications. We studied weakly charged O/W microemulsion droplets complexed with oppositely charged polyacrylates that form long linear arrangements of droplets. All samples showed rather low viscosities, which is in contrast to similar systems of hydrophobically interconnected droplets. Here, we applied small-angle neutron scattering, dynamic light scattering and neutron spin-echo spectroscopy to characterise the dynamic properties of polyacrylate/microemulsion complexes in order to understand the origin of the low-viscous behaviour. We found that the electrostatic interactions lead to very dynamic complexes with high exchange rates of droplets and only a fraction of the droplets is contained within the transient complexes at a given time. These results were only accessible by the combination of different methods as one method alone would have given an incomplete picture.
Introduction
Oppositely charged polyelectrolyte/surfactant complexes have been studied intensively in the past and are considered to be very interesting systems for solubilising active agents e.g. in the context of drug delivery.1–4 However, surfactant micelles are not intrinsically loaded with an active compound and solubilisation might be a problem. In contrast, oil-in-water microemulsion (O/W ME) droplets naturally contain a very high load of hydrophobic molecules. Surprisingly, complexes of microemulsion droplets and oppositely charged polyelectrolytes have received very little attention so far.Microemulsions have been known since the 1940s,5 they occur as finely dispersed droplets of water in oil (W/O) or oil in water (O/W) but also bicontinuous structures are possible.6 Microemulsions uniquely combine a number of properties, like thermodynamic stability, transparent appearance, low viscosity and spontaneous formation which makes them very interesting systems whenever it is necessary to disperse hydrophobic molecules in a hydrophilic solvent or vice versa as it is needed for example in drug delivery, nanoparticle synthesis, oil recovery or cosmetics and detergents.7–11 In order to tailor microemulsion properties to specific needs for applications (like enhanced viscosity), it might be necessary to add additives like polymers.
Complexes formed by microemulsion droplets and polymers,12,13 including neutral amphiphilic polymers,14,15 block copolymers16,17 or telechelic polymers18,19 have already been studied by several groups. In most cases a gelling of the sample due to network formation of the microemulsion droplets with the polymer was found. In contrast, little research has been done on complexes formed by ionic microemulsion droplets and oppositely charged polyelectrolytes, where the interaction is mainly of electrostatic nature.20 For cationic surfactant/anionic polymer complexes it was found that the solubilisation capacity of the micelles increases in presence of the polymer, due to the additional ionic strength.21 If charged microemulsion droplets bind to polymers through electrostatic and/or hydrogen bonds, a bridging of the droplets would be possible as well as a decoration of the polymers.
In a recent study we have therefore investigated complexes formed by cationic O/W microemulsion droplets with polyacrylates.22 The structurally most interesting complexes were found in polyelectrolyte excess close to the phase boundary, where small-angle neutron scattering (SANS) measurements showed long cylindrical arrangements of droplets on the polyacrylate chains with 3 to 23 droplets per aggregate, depending on the Mw of polyelectrolyte. When increasing the polyelectrolyte content, thus moving further away from the phase boundary, the complexes become smaller and less extended. Surprisingly, all of these samples showed rather low viscosities (see Fig. S1†). This is in contrast to previously studied systems of very similar (but uncharged) microemulsion droplets that formed highly viscous networks when interacting with telechelic polymers.18,19 The telechelic polymers bind to the droplets via hydrophobic forces with 12–18 kBT per endcap, depending on the length of the alkyl chain, while the electrostatic interactions due to opposite charges become comparatively weak already at moderate salt concentrations.23 However, previous static measurements were not able to explain the low-viscous nature of the electrostatically formed polyelectrolyte/microemulsion aggregates. For this reason we were now employing a high-resolution dynamic method, namely neutron spin-echo (NSE), to address this question in thorough detail. In that context, it might be noted that NSE was already successfully employed by Yearley et al.24 to study the relation of cluster formation and solution viscosity.
Materials and methods
Materials
Positively charged oil-in-water microemulsion droplets were prepared with a surfactant mixture consisting of 95 mol% of the neutral tetradecyldimethylamine oxide (TDMAO, received as a gift from Stepan Company, USA, as a 25 wt% TDMAO solution in water named Ammonyx M. The solution was freeze dried before use) and 5 mol% of the cationic tetradecyltrimethylammonium bromide (TTAB, 99%, Sigma Aldrich, used without further purification). 1-Hexanol (>98%, MERCK-Schuchardt OHG) was added as a cosurfactant to control the droplet size and the mixture was then saturated with decane (>98%, Fluka Chemika) as oil. The resulting concentrations are: 100 mM surfactants, 50 mM hexanol and 80 mM decane. The droplets are about 45 Å in radius (obtained from SANS22 and NSE measurements) and their surface charge is controlled by the TDMAO/TTAB ratio.Sodium polyacrylate (NaPA) was employed as polyelectrolyte. It was either purchased directly or prepared by adding a stoichiometric amount of NaOH to the poly(acrylic acid) (PAA). Four different molecular weights (Mw) were used in this work: 5.1 kg mol−1 (sodium salt, used as received from Sigma Aldrich), 15 kg mol−1 (sodium salt solution from Sigma Aldrich, freeze dried before use), 60 kg mol−1 (sodium salt, used as received from Fluka Chemika) and 240 kg mol−1 (PAA; solution from Acros Organics, prepared by adding a stoichiometric amount of NaOH (≥98%, p.a., ISO, Carl ROTH) to the solution and freeze dried before use, which results in an average molecular weight of 315 kg mol−1). These molecular weights correspond to contour lengths (lengths of the stretched polyelectrolyte) of 140, 400, 1600, and 8500 Å respectively, the corresponding overlap concentrations for these polymers (assuming fully stretched chains) are 32, 3.9, 0.25, and 0.007 mM (in monomeric units).
Samples were prepared at a microemulsion concentration of 100 mM surfactant (with 95 mol% TDMAO and 5 mol% TTAB) with 12 mM of added NaPA (monomeric units) to obtain a charge ratio of z = [−]/([+] + [−]) = 0.7, where [+] and [−] are the nominal number of charges of employed TTAB molecules and NaPA monomer units respectively. A charge ratio of z = 0.7 corresponds to samples at polyelectrolyte charge excess but close to the phase boundary where long-time stable samples containing elongated aggregates were found in previous studies.22 The respective concentrations of surfactant and NaPA can be used to calculate the number of droplets and total length of PE chain. The ratio of both numbers results in an average length of 140 Å PE per ME droplet of R = 45 Å, so the space between droplets would be a bit smaller than one droplet diameter. Samples for NSE and SANS measurements were prepared in D2O (>99.5% D, Eurisotop), while samples for DLS were prepared in H2O from a Millipore system.
Methods
Dynamic light scattering (DLS) measurements were performed on an ALV/CGS-3 instrument, with a HeNe laser with a wavelength of λ = 632.8 nm. Correlation functions were recorded for detector angles between 40° and 130° and were fitted for each angle with a stretched exponential function to obtain the decay time τ. The collective diffusion coefficient D was calculated from τ with the modulus of the scattering vector q, defined as: q = (4πn0 × sin(θ/2))/λ where n0 is the refractive index of the solution and θ the scattering angle.Neutron spin-echo (NSE) measurements were performed on the instrument IN1525,26 at Institut Laue Langevin (ILL, Grenoble, France) using wavelengths of 6, 10 and 14 Å reaching Fourier times of 42, 194 and 531 ns and covering a q range from 0.019 to 0.14 Å−1. Standard methods were applied for data reduction.
Small-angle neutron scattering (SANS) experiments were carried out on PAXY at Laboratoire Léon Brillouin (LLB, Saclay, France) and on V4 at Helmholtz-Zentrum Berlin (HZB, Germany). Data reduction was done using the software package BerSANS.27
All measurements were carried out at 25 °C. See ESI for more details.†
Results and discussion
In this work we employed TDMAO/TTAB/hexanol/decane O/W microemulsion droplets at a constant surfactant concentration of 100 mM (95% neutral TDMAO, 5% cationic TTAB). The microemulsion droplets were mixed with sodium polyacrylates of different Mw in a charge ratio z = 0.7, which is close to the phase boundary at the polyelectrolyte charge excess side of the phase diagram. As shown before22 the static structure of the formed complexes was obtained by small-angle neutron scattering (SANS). The intensity increase in SANS shows that the microemulsion droplets are aggregating to large clusters of separate droplets upon the addition of an oppositely charged polyelectrolyte. Long-time stable samples were obtained in polyelectrolyte excess and especially close to the phase boundary large cylindrically shaped aggregates were observed. This elongation becomes more pronounced the higher the Mw (=the longer the chain) of the employed polyelectrolytes is (see Fig. 1). Previously, the SANS data of these complexes was described reasonably well by a linear arrangement of droplets.28 Such large linear aggregates as they were observed here, would normally be expected to strongly influence the viscosity of the sample. But in this case of polyelectrolyte/microemulsion complexes, no increase in viscosity could be observed (see Fig. S1†).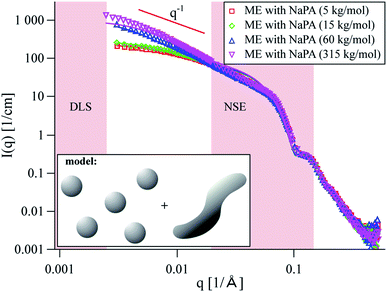 | ||
| Fig. 1 SANS curves for microemulsion droplets with polyacrylates of different Mw at z = 0.7. Solid lines are best fits of a model of coexisting spheres and wormlike chains, see the ESI for details.† The model was chosen after analysis of the NSE data. Pink areas indicate q regions of DLS and NSE measurements. | ||
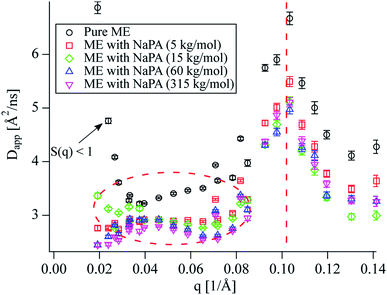
NSE measurements were performed to gain information about the dynamics of the system at nanometre length scales and nanosecond timescales. At first, the measured intermediate scattering functions were fitted with a simple exponential S(q,t)/S(q,0) = exp(−Dappq2t), (magnitude of the scattering vector q, Fourier time t, see Fig. S9 to S12†) to obtain the apparent diffusion coefficients Dapp shown in Fig. 2. The peak at 0.1 Å−1 is due to undulation motions of the microemulsion membranes, which are mostly visible at the form factor minimum, located at qminR = tan(qmin × R), R ≈ 4.5/qmin for spheres. This means that the microemulsion droplets are about 45 Å in radius. This peak is in good agreement with the measured SANS data which shows a form factor minimum at the same q (see Fig. 1). The diffusion coefficient corresponding to a sphere with a radius of 45 Å in a non-interacting sample at our experimental conditions would be  , which is significantly more than we observe at q < 0.1 Å−1 for the pure microemulsion meaning that there are relevant effects from interparticle interactions resulting in a static structure factor S(q) with a peak at about 0.04 Å−1 (see Fig. S13†). The q dependence of Dapp is given by Dapp = D0 × H(q)/S(q), where the hydrodynamic function H(q) ≈ 1 in our concentration range,29 and the strong increase of Dapp at the lowest q values is due to S(q) < 1.
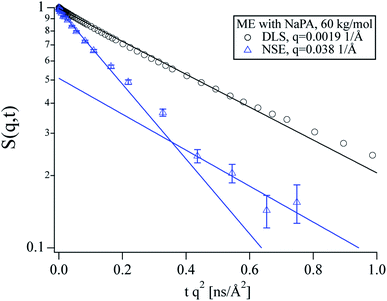
The characteristic behaviour of microemulsion droplets with a peak in Dapp at the form factor minimum is also observed for the polyelectrolyte/microemulsion complexes but their Dapp at lower q is significantly lower than for the pure microemulsion, showing that the dynamics are slower for the complexes (see encircled region in Fig. 2). The Dapp of the different complexes is rather similar regardless of the molecular weight of the NaPA, despite the different structures that are observed using SANS. A closer inspection of the intermediate scattering functions at q values where only diffusion should be visible reveals that S(q,t) is not single exponential for the complexes as opposed to the pure microemulsion (see Fig. S2†). This is in contrast to our findings from DLS where the data of the complexes can be described well as a monomodal decay (see Fig. 3 and S3 to S5†).
Such a bimodal diffusion process as a function of length and timescale can be observed if particles are entrapped within a transient network (and one sees fast movement within the mesh size and slower one across the network) or if some of the droplets are bound within the complex while others are freely moving. Assuming the later scenario to be more likely in our case, this leaves two possible explanations for the monomodality of the DLS data. Either the complexes show much stronger scattering than the free microemulsion droplets at the low q values of the DLS due to their larger size, rendering the latter virtually invisible. In this case, the diffusion coefficient measured in DLS would be at least as low as the slow diffusion coefficient measured in NSE unless there were strong repulsive interactions between the complexes to which the SANS data do not give any evidence. Alternatively, the complexes could be highly dynamic with a lifetime longer than the nanosecond scale of NSE but shorter than the micro- to millisecond timescale of DLS. For a system where particles change between two different diffusion coefficients D1,2 (D1 < D2), on a timescale τ in the limit of fast exchange (τ ≪ 1/(Dq2)), a single averaged relaxation rate is observed:
| S(q,t) = exp(−(xD1 + (1 − x)D2)q2t) | (1) |
S(q,t) = x![[thin space (1/6-em)]](https://www.rsc.org/images/entities/char_2009.gif) exp(−D1q2t) + (1 − x)exp(−D2q2t), exp(−D1q2t) + (1 − x)exp(−D2q2t), | (2) |
To address this question in more detail, we proceeded to fit the NSE data from the complexes with a combination of the Milner–Safran model31,32 to account for the membrane undulations at high q and the translational diffusion of the free microemulsion droplets and a second slow diffusive mode with q independent diffusion coefficient Dslow and q dependent amplitude xslow, see eqn (S14).† The contribution from the free microemulsion droplets (membrane undulations and translational diffusion) was fixed for all samples according to fits to the data from the pure microemulsion (see Fig. S6†), where we obtained a value for the bending rigidity κ of 4.5 kBT, which is in good agreement with previous results on similar systems.33 Different approaches to describe the interactions in this system were tried by employing different approximations for the structure factor but it turned out, that different treatments had a rather small effect on the outcome (see Fig. S7 and S8† for a comparison). Thus we decided to fit our data treating the NaPA as simple electrolyte and leaving the volume fraction at its nominal value. The fitting procedure is described in detail in the ESI and fits are shown in Fig. S9 to S12.†
Fit results for xslow are shown in Fig. 4 in a q range where the influence from the membrane undulations is weak. Even though xslow is an intensity weight and does not directly correspond to the fraction of microemulsion droplets bound to the complexes, the intensity ratio between a single microemulsion droplet and a single complex using the same droplets as building blocks should be roughly proportional to the volume ratio of the structures in the NSE q range, as the respective form factors show similar intensity. Therefore, xslow should be a reasonably good approximation for the fraction of the droplets bound in complexes, which is about 20 to 30% of the microemulsion droplets for all complexes. The results are quite similar for all samples and do not show a pronounced trend with q. The small increase of xslow at low q can be explained by the intensity of the complexes increasing relative to the intensity of the pure microemulsion droplets towards lower q.
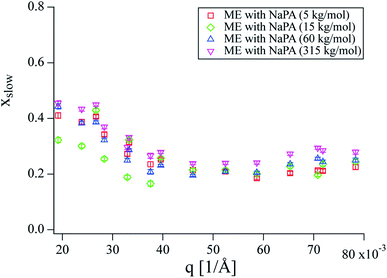 | ||
| Fig. 4 x slow obtained from fitting NSE curves with eqn (S14) and (S15).† No significant differences between samples can be seen, while a slight increase with decreasing q can be observed. | ||
The diffusion coefficients obtained from DLS are systematically higher than Dslow obtained from NSE (see Fig. 5). At low q, the relative intensity of the complexes compared to the free microemulsion droplets, increases drastically which affects the comparison between DLS and NSE (compare Fig. 1). The fact that the single diffusion coefficient seen in DLS is faster than the slow diffusion coefficient seen in NSE indicates that the result obtained from DLS is an average of complexes and free microemulsion droplets as described by eqn (1). This means that the monomodality of the DLS curves is due to the averaged signal, which arises from the short lifetime of the complexes. With increasing Mw, the complexes become larger, resulting in a higher intensity at low q (Fig. 5, right axis). The relative intensity of the complexes in the DLS q range increases as well, causing them to preponderate in the measured average, which explains the decrease of the DLS diffusion coefficient with increasing Mw. However, the local binding and the binding probability are independent of the length of the NaPA (Fig. 4), confirming that the droplet dynamics in these complexes is exclusively governed by the local interaction between droplet and chain fragment.
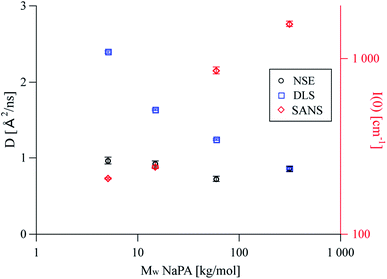 | ||
| Fig. 5 D slow obtained from fitting NSE curves with eqn (S14),† diffusion coefficients obtained from DLS and I(0) values obtained from SANS as a function of the molecular weight of the PE. While the observed diffusion coefficient is constant for NSE, it decreases with increasing Mw for DLS where at high Mw the scattering signal is dominated by the complexes and the relative contribution of free ME droplets becomes negligible. | ||
With this knowledge it was possible to refit the SANS data using a two-component fit, including homogeneous wormlike chains and free spheres with the respective intensity fractions obtained from NSE. The new SANS model is fully consistent with the dynamic NSE results as opposed to the previous descriptions, where it was assumed that all material was contained in the complexes (see Fig. S14† for a comparison of the models). The new SANS model is shown as solid lines in Fig. 1 and describes the experimental data very accurately. See the ESI for details on the fit and Table SI† for the obtained fit parameters.
The values obtained for Dslow do not show a strong dependence on Mw (see Fig. 5). One likely explanation for this situation would be, that due to the soft and flexible nature of the complexes, the diffusion times Dslow measured in NSE belong to segment motions of the complex, rather than diffusion of large complexes. With a diffusion coefficient of 1 Å2 ns−1, this would correspond to segment lengths of about 200 Å, which is in good agreement with the values of the Kuhn length obtained from the new SANS model (see Table SI†). The effective segment lengths are similar for polyelectrolytes of the same nature but different Mw, consequently Dslow is also similar for all different Mw measured even though the static picture shows Mw dependent differences. This explanation could be verified by employing other polyelectrolytes with significantly different persistence lengths which should have a pronounced effect on Dslow and will be done in a consecutive study.
Conclusion
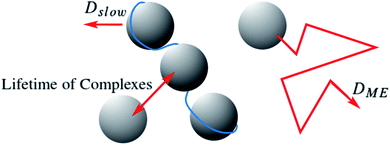
Combining the static and dynamic measurements we can conclude, that polyelectrolyte/microemulsion complexes are highly dynamic systems, with average lifetimes between the nanosecond timescale of NSE and the millisecond timescale of DLS and only about 30% of the microemulsion droplets are bound in complexes at a given time. Our measurements do not allow for a precise determination of the lifetime of the complexes but we can give a reliable estimate to this important property hitherto unknown. The timescale of each experiment is given by 1/(Dq2). Using q values of 0.02 and 0.002 Å−1 as lower and upper limit for NSE and DLS respectively, and D = 4.4 Å2 ns−1 as was obtained for free microemulsion droplets, we obtain timescales of about 600 ns and 60 μs as lower and upper limit for the lifetime of the complexes. Calculating the mean square displacement (〈R2〉 = 6Dt) of a microemulsion droplet, it is seen that it would diffuse a distance of about in the time window of a NSE measurement, less than twice its diameter. Therefore, it is not surprising that the lifetime of the complexes is long compared to the NSE timescale. For comparison, a microemulsion droplet would diffuse a minimum of 1260 Å during the time window of the DLS measurement. Even though the structures seen in SANS are significantly different for complexes with polyelectrolytes of different Mw, their dynamic behaviour is remarkably similar, due to the transient nature of these complexes. Fig. 6 depicts the situation.
Reverting to the initial question concerning the viscosity of polyelectrolyte/microemulsion complexes, we can now explain the low viscosities observed with the very dynamic situation of these complexes. Even a very high shear modulus G0, arising from an interconnection of the droplets cannot compensate such small relaxation times τ, so no viscosity (η) increase can be observed in this system, as η = τ × G0. This conclusion could only be drawn from the comparison of different measurement techniques, especially the combination of static and dynamic methods. One method alone would have given an incomplete picture. This example shows the importance of always studying the static as well as the dynamic behaviour of a system for a thorough characterisation. The observed highly transient nature of the studied polyelectrolyte/microemulsion complexes (PEMECs) should not only be relevant for this particular system, but also be of importance for the understanding of related systems of oppositely charged colloids and polyelectrolytes, systems as they are abundantly occurring in biology, but also in applied formulations in pharmacy, cosmetics, etc.
Conflicts of interest
There are no conflicts to declare.Acknowledgements
Financial support from the BMBF project 05K13KT1 is gratefully acknowledged as well as allocation of beamtime by HZB, ILL and LLB. Raw data of the NSE measurements is available under http://dx.doi.org/10.5291/ILL-DATA.TEST-2591. M. Simon thanks the TU Berlin for funding her PhD project.References
- E. Goddard, Colloids Surf., 1986, 19, 301 CrossRef CAS.
- L. Chiappisi, I. Hoffmann and M. Gradzielski, Soft Matter, 2013, 9, 3896 RSC.
- D. Langevin, Adv. Colloid Interface Sci., 2009, 147–148, 170 CrossRef CAS PubMed.
- M. Gradzielski and I. Hoffmann, Curr. Opin. Colloid Interface Sci., 2018, 35, 124 CrossRef CAS.
- T. P. Hoar and J. H. Schulman, Nature, 1943, 152, 102 CrossRef CAS.
- P. Winsor, Trans. Faraday Soc., 1948, 44, 376 RSC.
- M. J. Lawrence and G. D. Rees, Adv. Drug Delivery Rev., 2012, 64, 175 CrossRef.
- M. J. Schwuger, K. Stickdorn and R. Schomäcker, Chem. Rev., 1995, 95, 849 CrossRef CAS.
- V. C. Santanna, F. D. Curbelo, T. N. Castro Dantas, A. A. Dantas Neto, H. S. Albuquerque and A. I. Garnica, J. Pet. Sci. Eng., 2009, 66, 117 CrossRef CAS.
- P. Boonme, J. Cosmet. Dermatol., 2007, 6, 223 CrossRef PubMed.
- C. Solans, J. García Dominguez and S. E. Friberg, J. Dispersion Sci. Technol., 1985, 6, 523 CrossRef CAS.
- B. Kuttich, P. Falus, I. Grillo and B. Stühn, J. Chem. Phys., 2014, 141, 084903 CrossRef CAS PubMed.
- B. Kuttich, O. Ivanova, I. Grillo and B. Stühn, J. Chem. Phys., 2016, 145, 164904 CrossRef CAS PubMed.
- A. Holmberg, P. Hansson, L. Piculell and P. Linse, J. Phys. Chem. B, 1999, 103, 10807 CrossRef CAS.
- A. Kabalnov, B. Lindman, U. Olsson, L. Piculell, K. Thuresson and H. Wennerström, Colloid Polym. Sci., 1996, 274, 297 CrossRef CAS.
- C. Quellet, H. F. Eicke, G. Xu and Y. Hauger, Macromolecules, 1990, 23, 3347 CrossRef CAS.
- B. Jakobs, T. Sottmann, R. Strey, J. Allgaier, L. Willner and D. Richter, Langmuir, 1999, 15, 6707 CrossRef CAS.
- P. Malo De Molina, M. Appavou and M. Gradzielski, Soft Matter, 2014, 10, 5072 RSC.
- P. Malo De Molina, F. S. Ihlefeldt, S. Prévost, C. Herfurth, M. Appavou, A. Laschewsky and M. Gradzielski, Langmuir, 2015, 31, 5198 CrossRef CAS PubMed.
- E. Buhler, J. Appell and G. Porte, J. Phys. Chem. B, 2006, 110, 6415 CrossRef CAS PubMed.
- H. Zhang, L. Deng, P. Sun, F. Que and J. Weiss, J. Colloid Interface Sci., 2016, 461, 88 CrossRef CAS PubMed.
- M. Simon, P. Krause, L. Chiappisi, L. Noirez and M. Gradzielski, Chem. Sci., 2019, 10, 385 RSC.
- S. Yu, X. Xu, C. Yigit, M. Van Der Giet, W. Zidek, J. Jankowski, J. Dzubiella and M. Ballauff, Soft Matter, 2015, 11, 4630 RSC.
- E. J. Yearley, P. D. Godfrin, T. Perevozchikova, H. Zhang, P. Falus, L. Porcar, M. Nagao, J. E. Curtis, P. Gawande, R. Taing, I. E. Zarraga, N. J. Wagner and Y. Liu, Biophys. J., 2014, 106, 1763 CrossRef CAS PubMed.
- P. Schleger, B. Alefeld, J. Barthelemy, G. Ehlers, B. Farago, P. Giraud, C. Hayes, A. Kollmar, C. Lartigue, F. Mezei and D. Richter, Phys. B, 1997, 241–243, 164 CrossRef CAS.
- B. Farago, P. Falus, I. Hoffmann, M. Gradzielski, F. Thomas and C. Gomez, Neutron News, 2015, 26, 15 CrossRef.
- U. Keiderling, Appl. Phys. A: Mater. Sci. Process., 2002, 1457, 1455 CrossRef.
- L. Chiappisi, S. Prévost and M. Gradzielski, J. Appl. Crystallogr., 2014, 47, 827 CrossRef CAS.
- L. Porcar, P. Falus, W. Chen, A. Faraone, E. Fratini, K. Hong, P. Baglioni and Y. Liu, J. Phys. Chem. Lett., 2010, 1, 126 CrossRef CAS.
- F. Roosen-Runge, D. J. Bicout and J. Barrat, J. Chem. Phys., 2016, 144, 204109 CrossRef PubMed.
- S. A. Safran, J. Chem. Phys., 1983, 78, 2073 CrossRef CAS.
- S. T. Milner and S. A. Safran, Phys. Rev. A: At., Mol., Opt. Phys., 1987, 36, 4371 CrossRef CAS.
- B. Farago and M. Gradzielski, J. Chem. Phys., 2001, 114, 10105 CrossRef CAS.
Footnote |
| † Electronic supplementary information (ESI) available: Viscosity measurements, DLS measurements, examples of NSE and DLS curves, modelling of NSE data and SANS (measurements, fitting models, discussion). See DOI: 10.1039/d0na00336k |
| This journal is © The Royal Society of Chemistry 2020 |

