 Open Access Article
Fabrication of bismuth oxide-modified pencil graphite sensors for monitoring the hazardous herbicide diuron†
Annu
 *a,
Antony Nitin
Raja
a,
Kshiti
Singh
b,
Anand K.
Halve
b and
Rajeev
Jain
b
aSchool of Studies in Environmental Chemistry, Jiwaji University, Gwalior-474011, India. E-mail: apandey083@gmail.com; Tel: +91-999386158
bSchool of Studies in Chemistry, Jiwaji University, Gwalior-474011, India
First published on 15th June 2020
Abstract
In this work, a bismuth oxide/pencil graphite electrode (Bi2O3/PGE)-based ultrasensitive voltammetric sensor is reported for the quantification of the herbicide diuron (DU) in vegetable samples. A HB pencil lead of diameter 2.0 mm was applied to prepare the electrode. Bismuth oxide nanopowder of the size range 1–10 μm was used. The prepared Bi2O3/PGE was characterized by different techniques such as energy-dispersive X-ray (EDX) spectroscopy, scanning electron microscopy (SEM), electrochemical impedance spectroscopy (EIS) and cyclic voltammetry (CV). A linear calibration curve was plotted in the range of 5.0–160.0 ng mL−1 in a BR buffer (pH 2.5) solution. The sensitivity of the fabricated sensor was calculated to be 2.80 ng mL−1. The suggested sensor indicated higher sensitivity towards the detection of DU in a small-sized whole-tomato sample with 99.9% recovery.
1. Introduction
Diuron (3-(3,4-dichlorophenyl)-1,1-dimethylurea) (DU) is a substituted phenyl urea herbicide applied for the pre-emergence control of a wide range of wild plants in the cultivation of a vast variety of crops such as citrus fruits, rice, cotton, soybeans, sugarcane, potato, wheat, tea and coffee as well as along airport runways, railways and pipelines.1–3 Undegraded deposits of the herbicide stay in surface and ground water beyond their permissible limit. In humans, methemoglobin in the blood, liver dysfunction, spleen deformity and hormonal imbalance are the most common health diseases that were identified to be caused by the presence of diuron in food and water. Due to its harmful effects on human health and ecology, it is a key concern to develop an easy, selective, rapid and reliable method for the quantification of DU.4–7 A variety of electrochemical techniques have been applied for the quantification of DU, but due to passivation of the electrode, surface deposition of polymeric products has been detected.8–13Glassy carbon, carbon paste, carbon nanofibers, carbon strips, etc. are the generally used carbon-based electrodes for the voltammetric determination of pesticides and other environmental pollutants.14–17 Other than carbon electrodes, a number of metal electrodes such as platinum and gold have also been fabricated with a variety of polymer nanocomposites for the electrochemical sensing of environmental pollutants, but the fouling of their surface due to adherence of intermediate products during electrochemical measurement is the major drawback as it requires cleaning of the electrode surface prior to each measurement.18–24 To overcome the above-mentioned major limitation, a novel disposable pencil graphite electrode was prepared indigenously and applied for the quantification of the herbicide DU. Nowadays, for on-site measurement, demands for cost-effective, field functional voltammetric sensors and easy-to-fabricate-type sensors have been ever increasing. A wide range of nanomaterials with unique chemical, physical and electronic properties with the significance of the small size are gaining significant interest as electrochemical sensors.25–32 Along with these electrochemical sensors, metal oxide-based sensors show superior electrocatalytic activity, stability and reproducibility for the determination of various pesticides.33–37 The advantages of Bi2O3 nanoparticles over other metals are revealed in their significant performances such as adequate surface area, electrochemical stability, efficient catalytic activity, ease of functionalization, cost-effectiveness, chemical inertness, and less-toxicity. Due to less toxicity and non-reactive heavy metals, this is appropriate for in vivo applications compared to other metals. The simplicity in controlling their particle size and shape throughout the preparation is an additional benefit of bismuth oxide nanoparticles.38,39 On surveying the literature, we found that few polymer-based sensors such as reduced grapheme oxide, MWCNT, and gold nanoparticles have been developed for detecting diuron, but all previously reported sensors were based on the commercial expensive glassy carbon electrode and the modifier applied was of high cost and more toxicity than bismuth oxide. In the current work, a Bi2O3/PGE was applied to monitor the concentration of DU in a variety of real samples. The developed sensor has the advantage of lower cost, ease of availability and disposability.
2. Experimental
2.1. Instruments and chemicals
All voltammetric measurements were carried out using an AUTOLAB 112 Potentiostat galvanostat 302 N (the Netherlands) with software NOVA 1.1. A three-electrode system was applied for all measurements, and in this work, a PGE was used as the working electrode, a calomel electrode as the reference electrode and a platinum wire as the counter electrode. All pH measurements were recorded using a decible DB-1011 digital pH meter. Diuron (DU) (≥98%) standard was acquired from TCI Chemicals. Bismuth oxide along with other used chemicals was bought from Sigma Aldrich, of AR grade of 1 μm with 99.9% purity and employed without further purification. An appropriate amount of methanol was taken as the solvent to prepare the stock solution of 0.004 mM DU.2.2. Development of Bi2O3/PGE working sensors
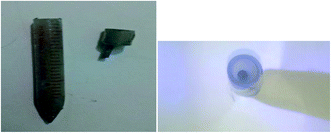
The method of construction of a pencil graphite electrode is the same as reported briefly in earlier papers. A HB pencil lead of diameter 2.0 mm was hooked in an insulin syringe used as the holder and fixed with bontite used as the fixing material (Fig. 1). A working electrode was prepared by the drop-casting method via applying a uniform thin coating of a Bi2O3 slurry on the PGE followed by drying at room temperature. The concentration of Bi2O3 was optimized; for this purpose, various concentrations of Bi2O3, namely, 0.500 mg mL−1, 1.0 mg mL−1, 2.0 mg mL−1, 3.0 mg mL−1, 4.0 mg mL−1, and 5.0 mg mL−1 were dissolved in DMF and the peak intensity was evaluated. The result indicated that the peak intensity (during oxidation of DU) increased up to 3.0 mg mL−1 and decreased thereafter. The maximum peak current was observed at 3.0 mg mL−1, and hence, it was selected for further experiments. The amount of the sensing material Bi2O3 was also optimized (Fig. 1, ESI†). By varying the casting volume from 1.0 to 5.0 μL, the peak intensity amplifies up to 4.0 μL and diminishes thereafter.2.3. Electrochemical measurements
All electrochemical measurements were recorded in 16.0 mL of buffer solution (BR, pH 2.5), with 4.0 mL of aqueous KCL solution as the supporting electrolyte poured into the electrochemical cell. Then, the DU solution of different concentrations diluted from 0.004 mM stock solution of was added subsequently. Voltammograms were recorded by cyclic and differential pulse voltammetry via sweeping likely towards the positive direction in the range of 0.2 V to 1.2 V. Electrochemical impedance spectroscopy was used for the electrochemical characterization PGE/Bi2O3 sensors in 1.0 mM K3[Fe(CN)6] solution (phosphate buffer of pH 7.0).2.4. Real sample preparation
For the quantification of DU, a small-sized whole tomato was purchased from a local vegetable market and completely ground in a mixer grinder followed by filtration using a filter paper. An appropriate amount of the filtrate was spiked with different concentrations of DU and quantified by cyclic voltammetry.3. Results and discussion
3.1. Bi2O3 sensor characterization
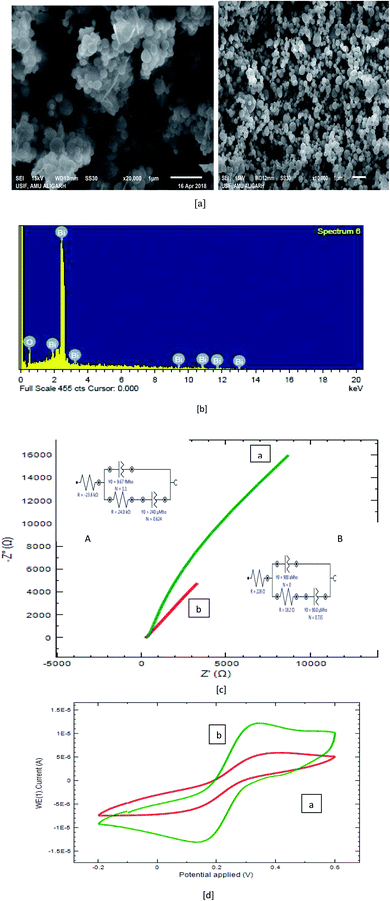
The morphology of the prepared composites was studied by scanning electron microscopy (SEM). The SEM image of Bi2O3 is demonstrated in Fig. 2a, and a pea-like structure of size 1.0 μm can be observed in the image at two different magnifications. The elemental composition of Bi2O3 was verified by EDX, and the spectrum is shown in Fig. 2b. The peaks observed for Bi and O confirmed the presence of all elements in the composite.The surface area of the developed sensor was estimated by cyclic voltammetry via a reversible redox reaction of a potassium ferricyanide probe, (K3[Fe(CN)6]) (Fig. 2c) (prepared in 1 M KCL) and computed using Randles–Ševcik equations (under non-standard conditions), as given in eqn (i)28–31,41,42
| Irevp,f = +0.446nFArealC√nFDν/RT | (i) |
The potential of electron transfer at various electrodes was further examined by electrochemical impedance spectroscopy (EIS), and the obtained results are presented in Fig. 2c.
The thickness of the uniform layer was also calculated using the formula: d = εoεrA/C, where εo is the electrical permittivity of vacuum (εo = 8.85 × 10⁻¹⁴ F cm−1), εr the relative permittivity of the bismuth oxide film and A its geometric surface area, and C the capacitance that was found to be 22.0 nm.
In general, the enhancement in the diameter of the semicircle reveals the increase in the interfacial charge-transfer resistance (Rct). The charge-transfer resistance (Rct) for the two fabricated sensors were estimated to be 24.8 kΩ for the bare PGE and 18.3 Ω for the Bi2O3/PGE. The equivalent circuit to EIS for the bare PGE is given in the inset of Fig. 2c. The rule obtained for the bare component was [R(Q[RQ])] for the bare PGE and [R(Q[RW])] for the Bi2O3/PGE. The obtained data were in conformity with the good conductivity and electrochemical properties of the Bi2O3/PGE.
3.2. Electro-oxidation of DU at a developed sensor
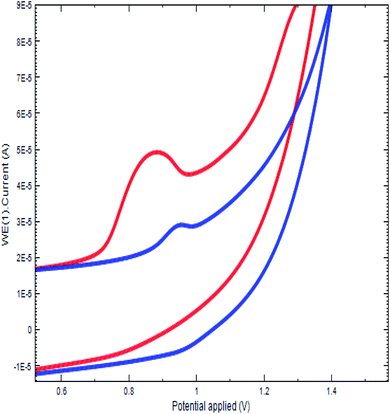
The oxidation of DU at the fabricated sensor was studied by cyclic voltammetry. The study was conducted in a BR buffer (pH 2.5) at PGE. Upon adding 400.0 ng of DU into the electrochemical cell containing the buffer, an irreversible oxidation peak at 900 mV appeared for the bare PGE due to the oxidation of the amine group. At the same time, this experiment was replicated at Bi2O3/PGE and the observed oxidation potential shifted towards the less positive direction (Fig. 3). The raised peak intensity and shifting of the peak potential at the Bi2O3/PGE confirms the fast electrode kinetics of Bi2O3 at the PGE surface.3.3. Scan rate study
Reversibility of the electrode process was established on the basis of cyclic voltammetry experiments conducted at the fabricated Bi2O3/PG sensor. In reverse scan, the absence of reduction peaks proved the irreversible behavior of the electrode phenomena (Fig. 2, ESI†). The effect of varying scan rates in the range of 10–100 mV s−1 on the peak intensity at different concentrations (800.0 ng) of DU in a BR buffer of pH 2.5 was investigated. In every case, a minute shift in the peak potential with increase in the scan rate and followed by an increase in the peak intensity was examined. The calibration curve plotted between peak currents (Ip) and the square root of scan rate (ν1/2) (Fig. 2b, ESI†) was found to be linear passing through the origin (eqn (ii)). The slope of the plot of log![[thin space (1/6-em)]](https://www.rsc.org/images/entities/char_2009.gif) ν vs. log
ν vs. log![[thin space (1/6-em)]](https://www.rsc.org/images/entities/char_2009.gif) Ip was 0.478, which validated the diffusion-controlled behaviour of the electrode phenomena (Fig. 2c, ESI;†eqn (iii)):
Ip was 0.478, which validated the diffusion-controlled behaviour of the electrode phenomena (Fig. 2c, ESI;†eqn (iii)):| DU, Ip = 0.575x + 0.213ν1/2, (R2 = 0.998) | (ii) |
| DU, Ip = 0.478x − 0.167ν, (R2 = 0.996) | (iii) |
The calibration curve plotted between the peak potential and logarithm of scan rate was observed to be linear, as shown in Fig. 2d (eqn (iv)):
| Ep = E0 + (RT/αnaF)[0.78 + ln(D01/2/K0) + ln(αnaFν/RT)1/2] | (iv) |
![[thin space (1/6-em)]](https://www.rsc.org/images/entities/char_2009.gif) ν, which can be calculated using eqn (v):
ν, which can be calculated using eqn (v):| Ep = 0.034x + 0.743, (R2 = 0.998) | (v) |
On equating the above two equations, we calculated:
| (RT/αnF) = 0.034 | (vi) |
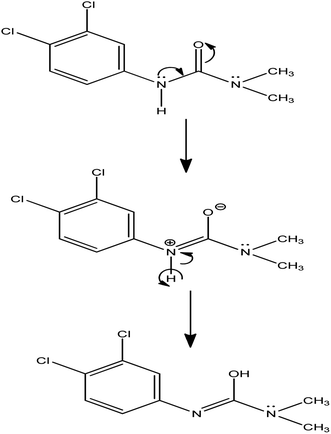
The number of electrons transferred during the electrode fabrication is calculated to be 1. The reaction mechanism is given in Scheme 1.
3.4. Effect of experimental parameters
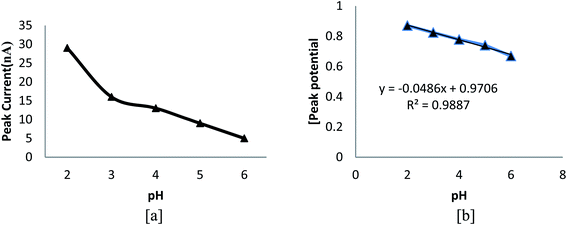
The variation in peak intensity amid various buffer systems such as, BR, phosphate and acetate was observed, and the highest peak intensity was acquired for BR buffer of pH 2.5. Fig. 4a signifies the effect of different pH values on peak current. From the figure, it can be concluded that on going towards less acidic medium, peak intensity decreases and peak potential also slightly shifts to a less positive value (Fig. 4b), implying the involvement of protons in the rate influential step. The finest result was observed at pH 2.5, and hence, it was opted for the further study. The effects of various solvent systems such as methanol, ethanol, acetone, SLS and CTAB were investigated, and the result indicated that the highest peak current was obtained in methanol. The effects of various electrolytes other than the buffer, namely, 0.01 mM hyphochloric acid, 0.01 mM sulphuric acid and 0.01 M potassium chloride were also examined, and the maximum peak current was obtained in 2.0 mL of 0.01 mM sulphuric acid.3.5. Calibration curve
Cyclic voltammograms of DU at the Bi2O3/PG sensor under optimized conditions are given in Fig. 5a. It can be concluded that the peak current enhanced upon increasing the concentration of DU. A good linear calibration curve (Fig. 5b) was obtained in the range of 5.0 ng to 160.0 ng with a regression equation, Ip = 0.052x + 0.113, (R2 = 0.991). The developed sensor was found to be exceedingly sensitive above further reported electrochemical methods, which is evident by the obtained LOD (limit of detection) of 2.83 ng mL−1 as calculated from the formula S/N = 3, and the LOQ (limit of quantification) of 8.5 ng mL−1.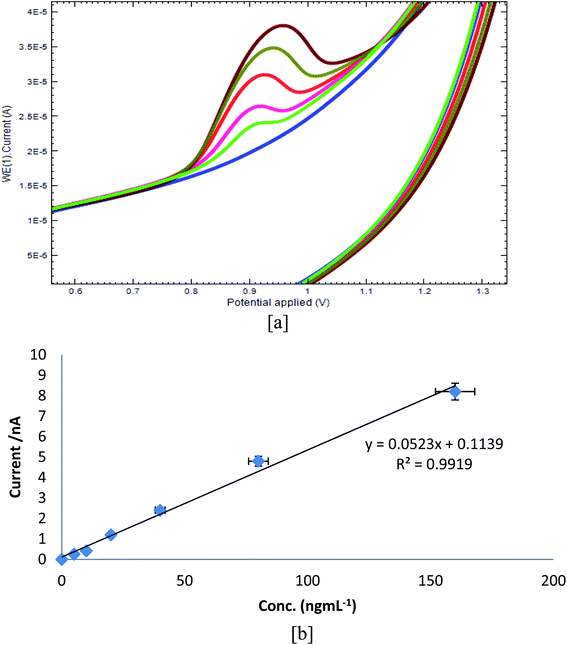 | ||
| Fig. 5 (a) Voltammograms of different concentrations of DU at Bi2O3/PGE (5.0–160.0 ng mL−1). (b) Calibration plot concentration vs. Ip, μA. | ||
3.6. Reproducibility, repeatability, stability and selectivity
The repeatability of the sensor was investigated by calculating the RSD of peak current attained during oxidation of DU from five replicate measurements. The calculated RSD for the modified sensor was found to be 0.15 (Table 1), which indicates the good repeatability. Furthermore, the reproducibility of the developed sensor was studied from the RSD of the current acquired at three comparable developed sensors in the known concentration of 800.0 ng. The obtained RSD of three similar modified sensors was found to be 0.16% (Table 1), which recommends the best reproducibility. Additionally, the fabricated sensor was tested for its stability by examining the reduction in the peak current subsequent to keeping the sensor for 15 days at room temperature. The results indicated that the sensor demonstrates minor decrements in the peak intensity in the earlier first week and maintains approximately 92.0% of its sensitivity, thus signifying the comprehensively consistent stability of the developed sensor. However, selectivity of the modified Bi2O3/PGE was investigated in the presence of few ions such Na+, K+, Mg2+, Ca2+, Al3+, NO3−, SO42− and Cl−, and the results indicated that the presence of inorganic ions did not affect the quantification.3.7. Recovery analysis
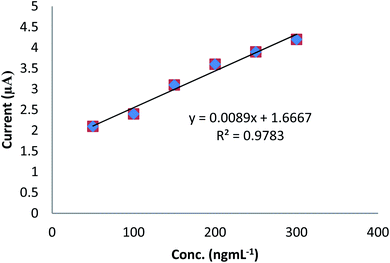
To examine the potential application of the developed electrode in the recovery of real sample analysis, voltammetric determination of DU in spiked tomato was carried out using a standard internal addition method. The recovery analysis of DU was explored using CV technique (Fig. 6). Five different concentrations of DU were studied. A percent recovery of 99.0 real samples was obtained, which demonstrated the appropriateness of the modified sensor and proposed technique (Table 2). For this purpose, previously prepared real samples (Section 2.4) were equally distributed in aliquots in five different volumetric flasks of 5.0 mL, and 2.0 mL of the prepared sample was taken in each flask. Then, the initial flask was subsequently diluted with the solvent up to the mark. The standard solution of DU (200.0 ng mL−1) was added in increasing volume (100.0–300.0 μL) in succeeding flasks followed by dilution with the solvent up to the mark. The peak intensity was examined for each sample and calibration graph plotted between the analyte concentration and the peak current. To estimate the target analyte quantity in the real sample, linear regression investigated was taken and the slope (m) and intercept (b) were estimated. The unidentified concentration of the analyte was quantified using the following eqn (vii):| Cx = b × Cs/mVx | (vii) |
| S. No | Amount added (ng mL−1) | Amount found (ng mL−1) | %R | %RSD |
|---|---|---|---|---|
| 1 | 100.0 | 99.4 | 99.9 | 0.2 |
| 2 | 150.0 | 148.2 | 98.8 | 0.4 |
| 3 | 200.0 | 199.6 | 99.8 | 0.1 |
| 4 | 250.0 | 249.8 | 99.9 | 0.5 |
| 5 | 300.0 | 298.9 | 99.6 | 0.3 |
From the above equation by substituting the value of “b” and “m” from the regression equation (y = 0.008 + 1.713), Cs = 200.0 ng mL−1, and Vx = 2.0 mL, the concentration of DU in the real sample was found to be 215.0 ng mL−1.
3.8. Comparison of the proposed method with previous reported methods
The analytical performance of the fabricated sensor for the DU quantification at the sensor was compared with different previously reported techniques and given in table (Table 3). The sensitivity of the fabricated sensor was found to be excellent as compared to other reported methods, which suggests that the fabricated Bi2O3/PGE sensor is highly sensitive for the determination of DU.| Sensor | Detection limit | Real Sample | Reference |
|---|---|---|---|
| a Abbreviation: rGO/AuNPs/GCE, reduced graphene oxide/gold nanoparticles/glassy carbon electrode; MIP(p-Phe)-PGE, molecularly imprinted polymer-pencil graphite electrode; MWCNT-COOH MIP/CPE, molecularly imprinted polymer and carboxyl-functionalized multi-walled carbon nanotubes/carbon paste electrode. | |||
| MWCNT-COOH MIP/CPE | 9.0 nM | River water samples | 12 |
| rGO–AuNPs/Nafion/GCE | 0.3 nM | Tea sample | 13 |
| MIP(p-Phe)-PGE | 43.43 μM | Water samples | 40 |
| Bi 2 O 3 /PGE | 0.6 nM | Tomatoes | Present work |
4. Conclusion
An efficient and novel electrochemical sensor for voltammetric quantification of diuron has been fabricated based on a Bi2O3-modified pencil graphite electrode. The proposed sensor revealed admirable selectivity, wide linear range (5.0 ng to 160.0 ng), a higher sensitivity of 2.83 ng, fine selectivity, reproducibility and stability. Additionally, the fabricated sensor has advantages of easy preparation procedure, cost-effectiveness and better electrocatalytic performance for the pesticide.Conflicts of interest
Authors declare no conflict of interest.Acknowledgements
Present work was supported by the Department of Science and Technology, New Delhi, India by way of providing INSPIRE fellowship to one of the authors [Annu – IF150764, 2016].References
- A. Wong, M. V. R. Lanza and M. D. P. T. Sotomayor, J. Electroanal. Chem., 2013, 690, 83–88, DOI:10.1016/j.jelechem.2012.11.007.
- Environmental Monitoring Branch, Pesticide Chemistry Database, Department of Pesticide Regulation (DPR) California, 2003 Search PubMed.
- L. Guzzella, E. Capri, A. D. Corcia, A. B. Carracciolo and G. Giuliano, J. Environ. Qual., 2006, 35, 312–323, DOI:10.2134/jeq2004.0025.
- K. Abass, P. Reponen, M. Turpeinen, J. Jalonen and O. Pelkonen, Drug Metab. Dispos., 2007, 35, 1634–1641, DOI:10.1124/dmd.107.016295.
- A. M. Polcaro, M. Mascis, S. Palmas and A. Vacca, Electrochim. Acta, 2004, 49, 649–656, DOI:10.1016/j.electacta.2003.09.021.
- C. Tixier, M. Sancelme, F. Bonnemoy, A. Cuer and H. Veschambre, Environ. Toxicol. Chem., 2001, 20, 1381–1389, DOI:10.1002/etc.5620200701.
- C. Lourencetti, M. M. R. Marchi and M. L. Ribeiro, Talanta, 2008, 77, 701–709, DOI:10.1016/j.talanta.2008.07.013.
- V. Mani, R. Devasenathipathy, S. M. Chen, T. Y. Wu and K. Kohilarani, Ionics, 2015, 21, 2675–2683, DOI:10.1007/s11581-015-1459-2.
- T. Mugadza and T. Nyokong, Electrochim. Acta, 2016, 55, 2606–2613, DOI:10.1016/j.electacta.2009.12.051.
- T. Mugadza and T. Nyokong, Talanta, 2010, 81, 1373–1379, DOI:10.1016/j.talanta.2010.02.037.
- P. Sharma, K. Sablok, V. Bhalla and C. R. Suri, Biosens. Bioelectron., 2011, 26, 4209–4212, DOI:10.1016/j.bios.2011.03.019.
- A. Wonga, M. V. Foguela, S. Khana, F. M. de Oliveirab, C. R. T. Tarley and M. D. P. T. Sotomayora, Electrochim. Acta, 2015, 182, 122–130, DOI:10.1016/j.electacta.2015.09.054.
- K. Zarei and A. Khodadadi, Ecotoxicol. Environ. Saf., 2017, 144, 171–177, DOI:10.1016/j.ecoenv.2017.06.030.
- H. Karimi-Maleh, F. Karimi, M. Alizadeh and A. L. Sanati, Chem. Rec., 2020, 20, 1–12, DOI:10.1002/tcr.201900092.
- F. Tahernejad-Javazmi, M. Shabani-Nooshabadi and H. Karimi-Maleh, Composites, Part B, 2019, 172, 666–670, DOI:10.1016/j.compositesb.2019.05.065.
- H. Karimi-Maleh, M. S. Mohammad, A. Taherd, F. Opokuc, E. Muriithi, K. Poomani, P. Govender, S. Ranjbari, M. Rezapoure and Y. Orooji, J. Mol. Liq., 2020, 298, 112040, DOI:10.1016/j.molliq.2019.112040.
- H. Karimi-Maleh, C. T. Fakude, N. Mabuba and G. M. Peleyeju, J. Colloid Interface Sci., 2019, 554, 603–610, DOI:10.1016/j.jcis.2019.07.047.
- H. Karimi-Maleh and O. A. Arotiba, J. Colloid Interface Sci., 2020, 560, 208–212, DOI:10.1016/j.jcis.2019.10.007.
- Z. Shamsadin-Azad, M. A. Tahe, S. Cheraghi and H. Karimi-Maleh, J. Food Meas. Charact., 2019, 13, 1781–1787, DOI:10.1007/s11694-019-00096-6.
- F. E. Gorla, H. Duarte, E. R. Sartori and C. R. T. Tarley, Microchem. J., 2015, 124, 65–75, DOI:10.1016/j.microc.2015.07.021.
- H. Rodrigues, S. Lima, S. J. Silva, E. A. O. Farias, P. R. S. Teixeira, C. Eiras and L. C. C. Nunes, Biosens. Bioelectron., 2018, 108, 27–37, DOI:10.1016/j.bios.2018.02.034.
- M. Ghanei-Motlagh and M. Baghayeri, J. Electrochem. Soc., 2020, 167, 066508, DOI:10.1149/1945-7111/ab823c.
- M. Nodehi, M. Baghayeri, R. Ansari and H. Veisi, Mater. Chem. Phys., 2020, 244, 122687, DOI:10.1016/j.matchemphys.2020.122687.
- M. Baghayeri, M. Ghanei-Motlagh, R. Tayebee, M. Fayazi and F. Narenji, Anal. Chim. Acta, 2020, 1099, 60–67, DOI:10.1016/j.aca.2019.11.045.
- M. Rouhi, M. M. Lakouraj and M. Baghayeri, Polymer Composites, 2019 DOI:10.1002/pc.24790.
- M. Ghanei-Motlagh, M. A. Taher, M. Fayazi, M. Baghayeri and A. R. Hosseinifar, J. Electrochem. Soc., 2019, 166, B367–B372, DOI:10.1149/2.0521906jes.
- M. Baghayeri, R. Ansari, M. Nodehi, I. Razavipanah and H. Veisi, Electroanalysis, 2018, 30, 1–8, DOI:10.1002/elan.201800158.
- M. Baghayeri, R. Ansari, M. Nodehi and H. Veisi, Int. J. Environ. Anal. Chem., 2018, 98, 874–888, DOI:10.1080/03067319.2018.1512595.
- M. Baghayeri, R. Ansari, M. Nodehi, I. Razavipanah and H. Veisi, Microchim. Acta, 185, 320, DOI:10.1007/s00604-018-2838-y.
- Y. Jing, B. Yu, P. Li, B. Xiong, Y. Cheng, Y. Li, C. Li, X. Xiao, M. Chen, L. Chen, Y. Zhang, M. Zhao and C. Cheng, Sci. Rep., 2017, 7, 14332, DOI:10.1038/s41598-017-13716-2.
- A. H. Oghli, E. Alipour and M. Asadzadeh, RSC Adv., 2015, 13 10.1039/c4ra11399c.
- A. Rana and A. N. Kawde, J. Chin. Chem. Soc., 2016, 63, 668–676, DOI:10.1002/jccs.201600119.
- M. Taheri, F. Ahour and S. Keshipour, J. Phys. Chem. Solids, 2018, 117, 180–187, DOI:10.1016/j.jpcs.2018.02.035.
- S. Pourbeyram and K. Mehdizadeh, J. Food Drug Anal., 2017, 24, 894–902, DOI:10.1016/j.jfda.2016.02.010.
- I. G. David, D. E. Popa and M. Buleandra, J. Anal. Methods Chem., 2017, 2017, 1–22, DOI:10.1155/2017/19059.
- S. B. Hocoeevar, B. Ogorevc, J. Wang and B. Pihlarc, Electroanalysis, 2017, 14, 1707–1712, DOI:10.1002/elan.200290014.
- E. S. Sá, P. S. Silva, C. L. Jost and Spinelli, Sens. Actuators, B, 2015, 209, 423–430, DOI:10.1016/j.snb.2014.11.136.
- H. W. Wang, Z. A. Hu, Y. Q. Chang, Y. L. Chen, Z. Q. Lei, Z. Y. Zhang and Y. Y. Yang, Electrochim. Acta, 2010, 55, 8974–8980, DOI:10.1016/j.electacta.2010.08.048.
- M. Shahbazi, L. Faghfouri, M. P. A. Ferreira, P. Figueiredo, H. Maleki, F. S. de, J. Hirvonena and H. A. Santos, Chem. Soc. Rev., 2020, 4 10.1039/c9cs00283a.
- B. Önde and M. Soysal, J. Electrochem. Soc., 2019, 166, B395–B401, DOI:10.1149/2.0631906jes.
- A. García-Miranda Ferrari, C. W. Foster, P. J. Kelly, D. A. C. Brownson and C. E. Banks, Biosensors, 2018, 8, 1–10, DOI:10.3390/bios8020053.
- T. N. Huana, T. Ganesha, K. S. Kimb, S. Kima, S. Hana and H. Chunga, Biosens. Bioelectron., 2011, 8, 53, DOI:10.1016/j.bios.2011.06.011 2018.
Footnote |
| † Electronic supplementary information (ESI) available. See DOI: 10.1039/d0na00394h |
| This journal is © The Royal Society of Chemistry 2020 |

