 Open Access Article
A porous graphene–NiFe2O4 nanocomposite with high electrochemical performance and high cycling stability for energy storage applications†
Meenaketan
Sethi
 a,
U. Sandhya
Shenoy
 b and
D. Krishna
Bhat
 *a
*a
aDepartment of Chemistry, National Institute of Technology Karnataka, Surathkal, Mangalore 575025, India. E-mail: denthajekb@gmail.com
bDepartment of Chemistry, College of Engineering and Technology, Srinivas University, Mukka, Mangalore 574146, India
First published on 24th July 2020
Abstract
It is well agreed that supercapacitors form an important class of energy storage devices catering to a variety of needs. However, designing the same using eco-friendly and earth abundant materials with high performance is still the dire need of the day. Here, we report a facile solvothermal synthesis of a porous graphene–NiFe2O4 (PGNF) nanocomposite. Thorough elemental, diffraction, microscopic and spectroscopic studies confirmed the formation of the PGNF composite, in which the NF nanoparticles are covered over the PG surface. The obtained 10 PGNF composite showed a surface area of 107 m2 g−1, with large pore volume which is favorable for charge storage properties. When utilizing the material as an electrode for a supercapacitor in a 2 M KOH aqueous electrolyte, the electrode displayed an impressive specific capacitance value of 1465.0 F g−1 at a scan rate of 5 mV s−1 along with a high capacitance retention of 94% after 10![[thin space (1/6-em)]](https://www.rsc.org/images/entities/char_2009.gif) 000 discharge cycles. The fabricated symmetrical supercapacitor device exhibited an energy density of 4.0 W h kg−1 and a power density of 3600.0 W kg−1 at a high applied current density of 14 A g−1. The superior electrochemical performance is attributed to the synergetic effect of the composite components which not only provided enough electroactive channels for the smooth passage of electrolyte ions but also maintained the hybrid structure intact in the ongoing electrochemical process. The obtained results underpin the promising utility of this material for future electrochemical energy storage devices.
000 discharge cycles. The fabricated symmetrical supercapacitor device exhibited an energy density of 4.0 W h kg−1 and a power density of 3600.0 W kg−1 at a high applied current density of 14 A g−1. The superior electrochemical performance is attributed to the synergetic effect of the composite components which not only provided enough electroactive channels for the smooth passage of electrolyte ions but also maintained the hybrid structure intact in the ongoing electrochemical process. The obtained results underpin the promising utility of this material for future electrochemical energy storage devices.
1. Introduction
The search for novel multifunctional materials has attracted great interest among the scientific community owing to their peculiar traits. Graphene, a wonder material, is one among such kinds, which exhibits excellent physical, chemical and electrical properties. Many researchers have tried to alter the structural and morphological features of parent graphene in order to improve the physico-chemical and electronic properties of graphene. The structural alteration in the parent graphene model by withdrawing a sp2 bonded C atom leads to the creation of a new type of graphene known as porous graphene (PG). PG is superior to the parent graphene, as it can provide higher surface area and facilitate high electrical conductivity due to the presence of pores/voids on the sheet, where electrolyte ions can move freely without any added restriction.1 Recent publications have reported the synthesis of the PG material through hydrothermal routes and its application in supercapacitors.1,2 Although the presence of pores increases the surface area, it suffers from the disadvantage of restacking of the sheets due to π–π interaction. In order to solve this issue, researchers have tried to incorporate oxides of metals/spinels inside the sheets so as to keep the sheets apart by adding foreign molecules as spacers.3–6 In this scenario, spinels are of much interest, as they provide high electrical conductivity owing to their abundance, presence of two metal domains and their environmentally benign nature.7–9 Thus, composites of PG and spinels are expected to provide superior electrochemical properties compared to single oxides due to their high mechanical strength, stability, high electrical conductivity and enhanced physico-chemical properties.6 Many spinels of Ni, such as NiCo2O4, NiMoO4, and NiMn2O4, with their graphene composites have been utilized as attractive electrode materials for supercapacitors.6,10 However, not much is explored with regard to the spinel NiFe2O4 and its graphene composites.11–13 It is known that the cubic spinel structure of NiFe2O4 (NF) possesses stronger bonds between oxygen and metal ions, which makes them more attractive for use in electrochemical energy storage devices.14,15 In NF, both Ni and Fe atoms with more than 2 oxidation states facilitate higher electrical conductivity and superior energy storage properties.NF nanostructures and their composites with materials such as graphene, polyaniline, carbon nanofibers, PEDOT, CNT, MoS2etc. have been prepared and studied for their electrochemical performance.11–13,16–21 The reports reveal the versatile utility of the NF composites, but when checked for the supercapacitive performance it is found that their performance is not appreciable either in terms of capacitance value or cycling stability or rate capability values. Recently, we have reported PG to be a potential supercapacitor material, and to the best of our knowledge, there is no report on nanocomposites of PG with NF.1 Hence, with an objective of amelioration of the electrochemical performance, we have synthesized PG with high surface area and NF with nano dimensions, and the combination of them led to porous graphene–NiFe2O4 (PGNF) composites. The prepared nanocomposites via a facile low temperature solvothermal route depicted high electrochemical performance and cycling stability. The fabricated supercapacitor device also delivered impressive energy density and power density. This is primarily attributed to the synergic effect of the composite components and connotes their robust application in the field of supercapacitors.
2. Experimental section
2.1. Materials and methods
All the chemicals used were of analytical grade and used without further purification. Deionized water was used for the synthesis of the materials.2.2. Synthesis of porous graphene–NiFe2O4 composites
Graphene oxide (GO) was synthesized by following an improved Hummers method.22 PG was synthesized by using GO as the precursor, adopting the protocol reported in the previous literature.1 For the synthesis of x PGNF (x = 5, 10, 15, 20, 25, and 30 wt% GO loading) composites, a calculated quantity of GO was dissolved in a 1![[thin space (1/6-em)]](https://www.rsc.org/images/entities/char_2009.gif) :
:![[thin space (1/6-em)]](https://www.rsc.org/images/entities/char_2009.gif) 1 mixture of water and ethylene glycol and sonicated in a bath sonicator for 2 hours in order to achieve complete dispersion. Then, 1 mmol of Ni(NO3)2·4H2O and 2 mmol of Fe(NO3)3·9H2O were mixed separately in a 10 mL mixture of water and ethylene glycol (1
1 mixture of water and ethylene glycol and sonicated in a bath sonicator for 2 hours in order to achieve complete dispersion. Then, 1 mmol of Ni(NO3)2·4H2O and 2 mmol of Fe(NO3)3·9H2O were mixed separately in a 10 mL mixture of water and ethylene glycol (1![[thin space (1/6-em)]](https://www.rsc.org/images/entities/char_2009.gif) :
:![[thin space (1/6-em)]](https://www.rsc.org/images/entities/char_2009.gif) 1) and were added to the dispersion and stirred continuously for 1 hour. Then, 6 mmol of urea was added slowly and again stirred for 30 minutes. The whole reaction mixture was then transferred into a stainless-steel autoclave of 100 mL capacity and was heated at 160 °C for 18 hours. Afterward, the oven was cooled to room temperature and the products were collected and washed with deionized water several times followed by washing with a 1
1) and were added to the dispersion and stirred continuously for 1 hour. Then, 6 mmol of urea was added slowly and again stirred for 30 minutes. The whole reaction mixture was then transferred into a stainless-steel autoclave of 100 mL capacity and was heated at 160 °C for 18 hours. Afterward, the oven was cooled to room temperature and the products were collected and washed with deionized water several times followed by washing with a 1![[thin space (1/6-em)]](https://www.rsc.org/images/entities/char_2009.gif) :
:![[thin space (1/6-em)]](https://www.rsc.org/images/entities/char_2009.gif) 1 water
1 water![[thin space (1/6-em)]](https://www.rsc.org/images/entities/char_2009.gif) :
:![[thin space (1/6-em)]](https://www.rsc.org/images/entities/char_2009.gif) ethanol mixture till the pH became neutral and dried at 70 °C overnight. The products were calcined at 400 °C for 2 hours in a muffle furnace to obtain PGNF composites and were named 5 PGNF, 10 PGNF, 15 PGNF, 20 PGNF, 25 PGNF and 30 PGNF, respectively, for 5% (30 mg), 10% (60 mg), 15% (102 mg), 20% (145 mg), 25% (193 mg), 30% (248 mg) of high-quality GO loading. The NF nanoparticles were also synthesized by the same protocol without the addition of GO. The preparation of the PGNF composites is schematically represented in Fig. 1.
ethanol mixture till the pH became neutral and dried at 70 °C overnight. The products were calcined at 400 °C for 2 hours in a muffle furnace to obtain PGNF composites and were named 5 PGNF, 10 PGNF, 15 PGNF, 20 PGNF, 25 PGNF and 30 PGNF, respectively, for 5% (30 mg), 10% (60 mg), 15% (102 mg), 20% (145 mg), 25% (193 mg), 30% (248 mg) of high-quality GO loading. The NF nanoparticles were also synthesized by the same protocol without the addition of GO. The preparation of the PGNF composites is schematically represented in Fig. 1.
2.3. Materials characterization
X-ray diffraction (XRD) measurements were carried out using a Rigaku MiniFlex 600 X-ray diffractometer (Japan) with Cu-Kα radiation of wavelength λ = 1.5418 Å in order to know the crystal structure and phase of the material. The surface morphology and elemental composition of the prepared composites were studied using a field emission scanning electron microscope (FESEM, Carl Zeiss, Ultra 55) equipped with energy dispersive X-ray spectroscopy (EDX). High-resolution transmission electron microscopy (HRTEM) measurements were performed by using an Fei Tecnai G2 instrument operated at an acceleration voltage of 200 kV. Raman spectra were recorded on an STR500 confocal micro Raman spectrometer (Airix Corporation, Japan) with the use of a 532 nm laser source. X-ray photoelectron spectroscopy (XPS) analysis was performed by using a Kratos (XSAM800) X-ray photoelectron spectrometer with monochromatic Al-Kα radiation (1486.7 eV) in the range of 1–1200 eV. All the XPS spectra were corrected with the C 1s line at 284.5 eV. Brunauer–Emmett–Teller (BET) surface area analysis was carried out by recording nitrogen adsorption/desorption isotherms at 77 K on a BEL SORP II, Japan, apparatus. Prior to BET surface area measurement, the samples were degassed at 200 °C in a vacuum for 2 hours. The pore size distribution of the materials was determined by using the Barrett–Joyner–Halenda (BJH) method.2.4. Fabrication of supercapacitor electrodes
The supercapacitor electrodes were made by mixing the PGNF, acetylene black and PVDF binder in a weight ratio of 8![[thin space (1/6-em)]](https://www.rsc.org/images/entities/char_2009.gif) :
:![[thin space (1/6-em)]](https://www.rsc.org/images/entities/char_2009.gif) 1
1![[thin space (1/6-em)]](https://www.rsc.org/images/entities/char_2009.gif) :
:![[thin space (1/6-em)]](https://www.rsc.org/images/entities/char_2009.gif) 1. Initially, the PGNF and acetylene black were mechanically mixed together using a mortar and pestle. Then, a few drops of the PVDF binder were added and again stirred to get a slurry-like ink. The ink was coated on one side of a polished Ni sheet of 1 cm × 1 cm area. The sheets were then dried in an oven at 60 °C for 8 hours in order to evaporate the solvent completely. The mass deposited on the sheets was approximately 1.0 mg as measured using an analytical balance with 0.0001 mg readability. Cyclic voltammetry (CV), galvanostatic charge–discharge (GCD), and electrochemical impedance spectroscopy (EIS) in the frequency range of 105 Hz to 0.01 Hz (by applying an AC perturbation of 10 mV) were carried out using a three-electrode cell with Ni sheets coated with composites as the working electrode, saturated calomel as the reference electrode and Pt wire as the counter electrode with 2 M KOH as the electrolyte at room temperature. Electrochemical analysis was performed using an IVIUM stat potentiostat/galvanostat electrochemical workstation. The details of the estimation of specific capacitance, specific capacity, and energy and power densities are given in the ESI.†
1. Initially, the PGNF and acetylene black were mechanically mixed together using a mortar and pestle. Then, a few drops of the PVDF binder were added and again stirred to get a slurry-like ink. The ink was coated on one side of a polished Ni sheet of 1 cm × 1 cm area. The sheets were then dried in an oven at 60 °C for 8 hours in order to evaporate the solvent completely. The mass deposited on the sheets was approximately 1.0 mg as measured using an analytical balance with 0.0001 mg readability. Cyclic voltammetry (CV), galvanostatic charge–discharge (GCD), and electrochemical impedance spectroscopy (EIS) in the frequency range of 105 Hz to 0.01 Hz (by applying an AC perturbation of 10 mV) were carried out using a three-electrode cell with Ni sheets coated with composites as the working electrode, saturated calomel as the reference electrode and Pt wire as the counter electrode with 2 M KOH as the electrolyte at room temperature. Electrochemical analysis was performed using an IVIUM stat potentiostat/galvanostat electrochemical workstation. The details of the estimation of specific capacitance, specific capacity, and energy and power densities are given in the ESI.†
2.5. Fabrication of a symmetrical supercapacitor cell
A symmetrical supercapacitor cell was fabricated by using the best performing sample in a 3-electrode method. The cell was fabricated following the procedure adopted in the previous reports.1,6 First, Toray carbon paper was cut into equal dimensions of 2 × 2 cm2 area. The prepared ink was equally deposited onto the carbon paper (2 pieces in which one acts as the anode and the other as cathode) in order to obtain equal mass deposition. Then, the carbon sheets were dried and the calculated mass was found to be 3 mg as measured using an analytical balance of readability 0.0001 mg. The cell assembly was performed by keeping the carbon sheets face to face separated by Whatman filter paper of same size as that of the carbon sheets (0.8 micrometer thickness), which was soaked in 2 M KOH electrolyte. This assembly was further sandwiched using stainless-steel current collectors to form the cell. The details of the estimation of specific capacitance, specific capacity, coulombic efficiency, and energy and power densities are given in the ESI.†3. Results and discussion
3.1. XRD analysis
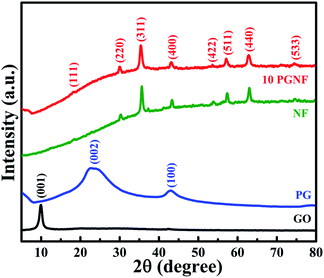
The phase and crystallinity of the as-prepared materials were studied by using XRD. Fig. 2 shows the powder XRD patterns of GO, PG, NF and 10 PGNF while the patterns of the rest of the composites are shown in Fig. S1.† In GO, the diffraction plane of (001) is centered around ∼10° suggesting the oxidation of the graphite sample.23 After solvothermal treatment, the formed PG showed diffraction peaks at 22.9° and 42.9°, which correspond to the (002) and (100) planes of PG, respectively.1,3 The powder XRD patterns of NF and 10 PGNF at angles of 18.4°, 30.29°, 35.67°, 37.6°, 43.38°, 53.95°, 57.38°, 63.02°, and 74.6° correspond to the (111), (220), (311), (222), (400), (422), (511), (440) and (533) crystal planes of the NF which match well with the standard JCPDS card number #074-2081.14,24 The XRD peaks are sharp at the top and slightly broadened at the base, which suggests the crystalline nature and nano dimensions of the synthesized NF and 10 PGNF material. The crystallite size of the nanoparticles was calculated using the Scherrer formula and was found to be 17 nm for NF and 16 nm for 10 PGNF, respectively.25 In the 10 PGNF composite sample, widening of the XRD peaks is observed compared to the NF sample, which can be attributed to the introduction of graphene in the NF phase.26 Also, no other diffraction planes are present in the XRD pattern, indicating the purity of the prepared material.3.2. FESEM and EDX analysis
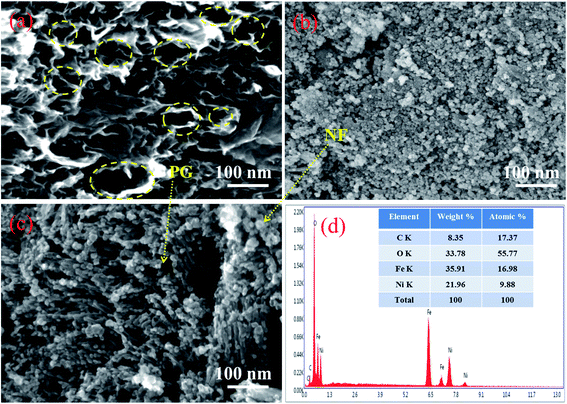
Fig. 3a displays the FESEM image of PG showing crumpled and transparent sheets which are a few layers (4–6) in thickness as measured using the formula N = (L/d) + 1.1,27 Numerous voids/pores are clearly distinguishable on the sheets and ascertain the formation of PG. Fig. 3b shows the FESEM image of the NF nanoparticles with the diameter of the nanoparticles ranging from 15 nm to 25 nm. The 10 PGNF composite shown in Fig. 3c displays a slightly aggregated distribution of NF nanoparticles over the PG surface ensuring the anchoring of NF nanoparticles over the PG surface. The FESEM images of all the synthesized composites are shown in Fig. S2.† The EDX image in Fig. 3d reveals the presence of C, O, Ni, and Fe only and confirms the purity of the material formed.3.3. TEM analysis
The TEM images of the composites are displayed in Fig. 4. The low and high magnification images in Fig. 4a and b show the presence of NF nanostructures anchored on the PG surface. The particle sizes from TEM match well with those determined from XRD measurements. The HRTEM image is shown in Fig. 4c, where the measured lattice fringe corresponds to the (311) crystal plane of NF. The SAED pattern of NF in Fig. 4d confirms the polycrystalline nature of the material, and the concentric patterns match well with the crystal plane details of NF nanoparticles. The elemental profiles determined from the highlighted portion of the 10 PGNF composite (Fig. 5a) for C, Ni, Fe and O are presented in Fig. 5b, c, d and e, respectively. The elemental composition of the highlighted portion is presented in Fig. S3,† which depicts the presence of the elements like C, Ni, Fe, and O in the composite sample, verifying the formation of the PGNF composite.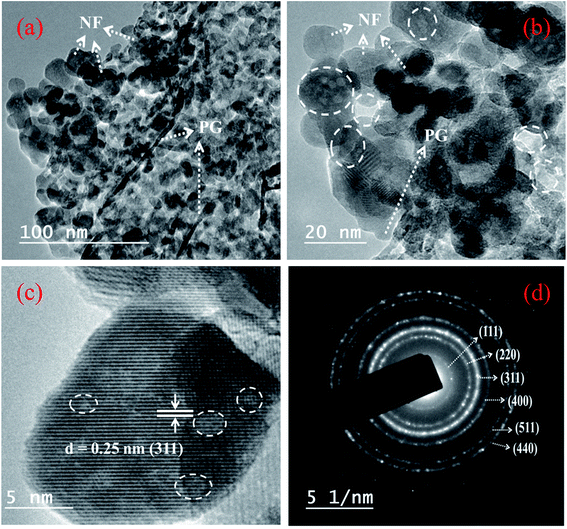 | ||
| Fig. 4 TEM (a) low magnification image, (b) high magnification image (pores are marked with white circles), (c) HRTEM image and (d) SAED pattern of 10 PGNF. | ||
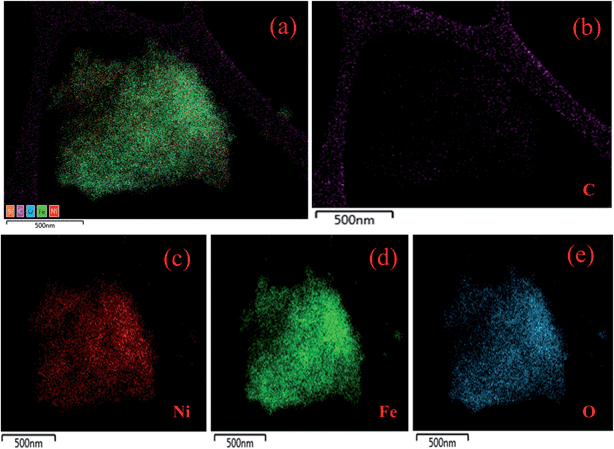 | ||
| Fig. 5 (a) Highlighted image from where the EDS mapping is performed, elemental mapping of (b) C, (c) Ni, (d) Fe and (e) O. | ||
3.4. BET surface area analysis
The BET plot of PG is shown in Fig. 6a depicting a type-IV isotherm with an H3 hysteresis loop.28 The obtained BET surface area for the PG sample is about 267 m2 g−1 along with a total pore volume of 0.2 cm3 g−1 and a mean pore diameter of 2.9 nm. The pore size distribution plot shown as an inset of Fig. 6a depicts the microporous nature of the PG material. Whereas the BET surface area for the 10 PGNF composite is found to be 107 m2 g−1 as shown in Fig. 6b, which is quite less compared to the PG sample, due to the reduction in the surface area as a result of the anchoring of bush like NF nanoparticles onto the PG surface (as shown in the FESEM and TEM images). However, the obtained surface area for our composite material is impressive and surpasses some of the previously reported literature data such as those of the NF/GC composite (43.6 m2 g−1), NF/RGO composite (57.3 m2 g−1), NF/rGO composite (78.4 m2 g−1), NF/GNS composite (92.18 m2 g−1), and NF/MoS2 composite (45.8 m2 g−1).20,29–32 The obtained pore volume and pore diameter for the 10 PGNF composite is 0.2 cm3 g−1 and 3.5 nm, respectively.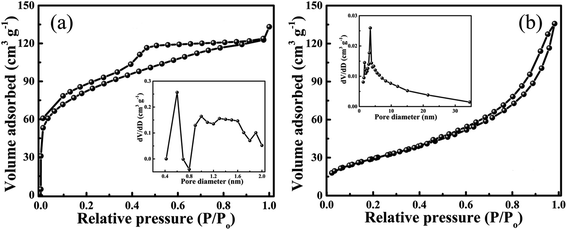 | ||
| Fig. 6 (a) BET surface area of PG (inset shows the pore size distribution plot) and (b) BET surface area of 10 PGNF (inset shows the pore size distribution plot). | ||
3.5. Raman analysis
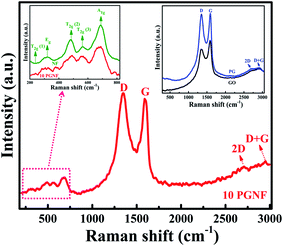
Raman spectra are signatures for carbon-based materials. The Raman spectra of GO, PG, NF, and 10 PGNF are shown in Fig. 7. The Raman spectra of GO and PG depict the appearance of D, G, 2D and D + G bands, which suggest the formation of the oxide of graphite and PG (inset of Fig. 7).1,33 The Raman spectra of the 10 PGNF composite show the Raman signatures of the D band at 1347.3 cm−1, G band at 1597.8 cm−1, 2D band at 2703.3 cm−1 and D + G band at 2949.8 cm−1. The intensity of the D band for the 10 PGNF composite is somewhat higher than that of the G band suggesting that a good amount of defect sites is introduced in the composite sample. Also, the appearance of the D + G band in the composite strongly supports the presence of defects in the sample.6 The peaks in the range of 200–750 cm−1 correspond to the vibrational modes of NF.14 The magnified spectrum of NF is shown as an inset, where the assigned Raman peaks correspond to the spinel NF phase.14,34 The above result confirms the formation of the PGNF composite under a solvothermal method. The ratio of ID/IG is a measure of the formation of the defects in carbon materials.35,36 The calculated ID/IG values for GO, PG and 10 PGNF are 0.76, 1.01 and 1.06, respectively. The increase in the ID/IG value for the 10 PGNF composite compared to PG strongly supports the presence of defects in the sample which may offer many active sites for the storage of charge and can contribute to the enhancement of the specific capacitance values of the material.213.6. XPS analysis
The XPS survey spectrum of the 10 PGNF composite is shown in Fig. S4,† displaying the presence of elements such as C, O, Fe and Ni in the sample without any other elements, depicting the purity of the sample. From the XPS spectrum, the oxidation states of the metal with their corresponding binding energies and metal–oxygen binding energies can be determined. The high resolution deconvoluted XPS spectrum of C 1s is shown in Fig. 8a, and the binding energies at 284.2, 285.6, 286.2 and 288.1 eV correspond to the C![[double bond, length as m-dash]](https://www.rsc.org/images/entities/char_e001.gif) C, C–O, C
C, C–O, C![[double bond, length as m-dash]](https://www.rsc.org/images/entities/char_e001.gif) O, and O–C
O, and O–C![[double bond, length as m-dash]](https://www.rsc.org/images/entities/char_e001.gif) O bonds, respectively.25,37 The high resolution O 1s spectrum is deconvoluted into 3 peaks in Fig. 8b with binding energies of 529.4, 531.0, and 532.0 eV ascribed to the M–O–M, O–C
O bonds, respectively.25,37 The high resolution O 1s spectrum is deconvoluted into 3 peaks in Fig. 8b with binding energies of 529.4, 531.0, and 532.0 eV ascribed to the M–O–M, O–C![[double bond, length as m-dash]](https://www.rsc.org/images/entities/char_e001.gif) O, and C
O, and C![[double bond, length as m-dash]](https://www.rsc.org/images/entities/char_e001.gif) O bonds, respectively.37 The high resolution Ni 2p spectrum in Fig. 8c and the Fe 2p spectrum in Fig. 8d show the presence of +2 and +3 oxidation states of Ni and Fe, respectively, and are well consistent with the reported literature.26,38–40
O bonds, respectively.37 The high resolution Ni 2p spectrum in Fig. 8c and the Fe 2p spectrum in Fig. 8d show the presence of +2 and +3 oxidation states of Ni and Fe, respectively, and are well consistent with the reported literature.26,38–40
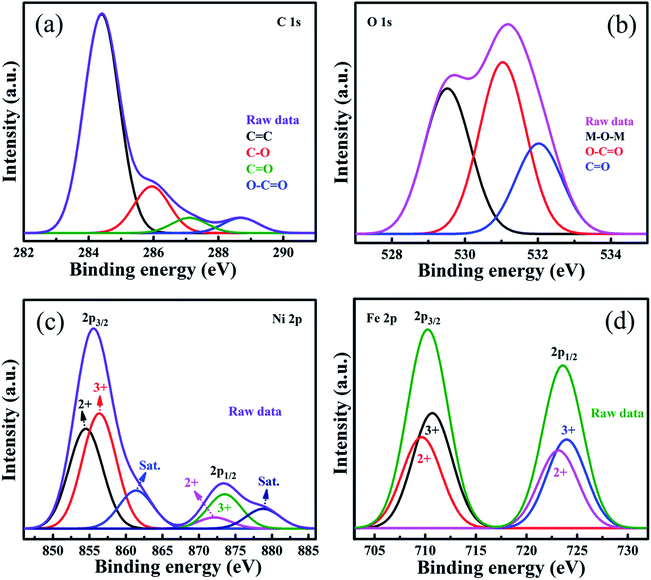 | ||
| Fig. 8 XPS deconvoluted spectra of (a) C 1s, (b) O 1s, (c) Ni 2p, and (d) Fe 2p of the 10 PGNF composite. | ||
3.7. Electrochemical analysis of PGNF composite electrodes
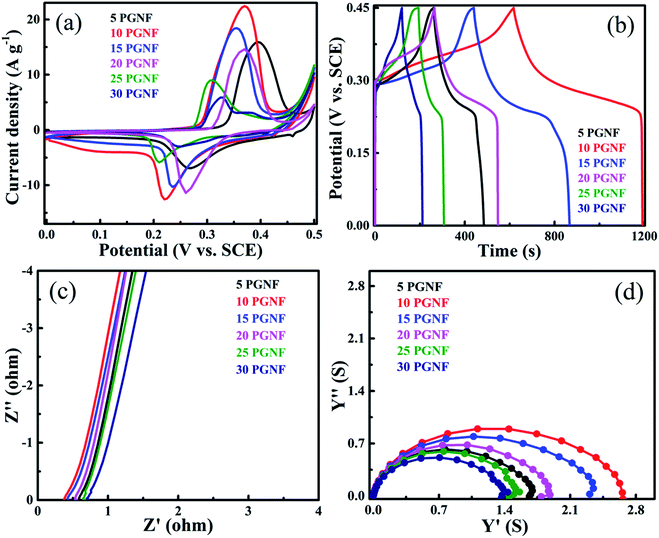
The electrochemical performance of all the PGNF composites was analyzed by following a 3-electrode method in 2 M KOH electrolyte. Fig. 9a shows the CV curves of the PGNF composite electrodes in the potential range of 0–0.5 V at a constant scan rate of 5 mV s−1; the pair of redox peaks appearing in the CV curves is an indication of the faradaic nature of the material. Among the composites, the 10 PGNF composite occupies more area than the other PGNF composites. As capacitance is directly proportional to the area occupied, 10 PGNF can store more charge due to which it can deliver a high capacitance value (1465.0 F g−1). The calculated specific capacitance values for PGNF composite electrodes are given in Table S1.†The GCD curves of the electrodes measured at a constant current density of 1 A g−1 at a fixed potential window of 0–0.45 V are shown in Fig. 9b. As can be seen from the figures, the GCD curves reveal the battery type nature of the composites. Also, the nearly symmetrical GCD curves are a signature of good coulombic efficiency. The calculated coulombic efficiencies are 91.0%, 95.8%, 96.4%, 91.2%, 89.3%, and 88.0% for 5, 10, 15, 20, 25 and 30 PGNF composites, respectively. The measured specific capacitance and specific capacity values for the PGNF composites are given in Table S2.† The 10 PGNF electrode material displayed more discharging time and showed a high capacitance value (1320 F g−1) among all the composites. The Nyquist plots of all the PGNF composite electrodes are shown in Fig. 9c. The plots reveal the absence of semicircles, suggesting the low resistance value offered by the material which is also supported by the electronic structure calculations (Fig. S5, see the ESI† for details). The straight line in the low frequency region, nearly parallel to the Y-axis, is suggestive of a good capacitive nature of the electrode material.19,41 The resistance values of all PGNF electrodes are listed in Table 1. The 10 PGNF composite electrode displayed a very low resistance value of 0.38 ohm, which may be due to the high surface area and porous nature of the electrode material, through which the diffusion of electrolyte ions is easily facilitated leading to faster kinetics.42 As the PG content is increased beyond 10%, there is an increase in the resistance value, which may be due to the blockage of pores/agglomeration of composite electrode materials.
| Electrode material | Resistance value (ohm) | Conductance value (siemens) | Knee frequency value (kHz) | Time constant value (μs) |
|---|---|---|---|---|
| 5 PGNF | 0.60 | 1.66 | 10.00 | 100.0 |
| 10 PGNF | 0.38 | 2.63 | 39.80 | 25.1 |
| 15 PGNF | 0.44 | 2.27 | 25.10 | 39.8 |
| 20 PGNF | 0.58 | 1.72 | 15.90 | 62.9 |
| 25 PGNF | 0.68 | 1.47 | 6.31 | 158.4 |
| 30 PGNF | 0.75 | 1.33 | 3.98 | 251.2 |
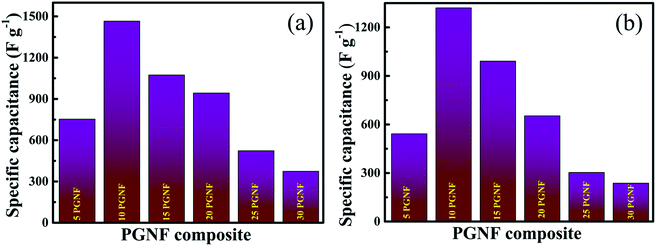
The admittance plots are displayed in Fig. 9d. From the admittance plots the time constant values can be obtained by knowing the knee frequency values. The time constant (τ0) can be defined as the time required for the electrode material to change from the resistive feature to capacitive feature. The τ0 can be estimated using the equation τ0 = 1/f0, where f0 is the knee frequency value obtained from the admittance plot.1,6 The knee frequency values for the PGNF composites and the corresponding time constant values are given in Table 1.
From Table 1, it is obvious that the 10 PGNF composite shows a lower resistance value and a higher admittance value, and therefore, the time constant value is low for the 10 PGNF composite electrode, which is in accordance with the high capacitance value offered by the 10 PGNF composite electrode. The knee frequency value of the 10 PGNF electrode also indicates that it would have ideal capacitor characteristics up to a frequency of around 40 kHz and later its nature may turn resistive and thus it may be best suited for applications below this frequency. The obtained higher electrochemical performance for the 10 PGNF composite electrode is primarily due to the optimal loading of PG in the composite as there is a gradual decrease in the electrochemical performance when the PG loading is increased (Fig. 10).
3.8. Study of the electrochemical performance of the 10 PGNF electrode
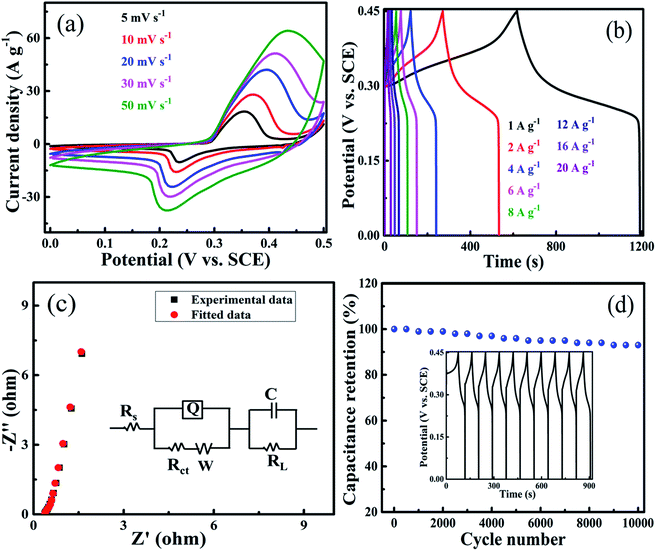
The electrochemical performance of all the composites at various scan rates ranging from 5–50 mV s−1 is shown in Fig. S6.† The higher performance shown by the 10 PGNF composite electrode material led us to study its electrochemical properties in detail. The CV plot of 10 PGNF reveals faradaic redox peaks at the anodic and cathodic sweeps demonstrating the pseudocapacitive trait of the material (Fig. 11a). As the scan rate increases from 5 mV s−1 to 50 mV s−1, the CV curves show nearly the same trend without any significant deviation, which suggests the good electrochemical stability of the 10 PGNF electrode material. The computed capacitance values from the CV curves are 1465.0, 1266.0, 1121.4, 876.0, and 563.0 F g−1 for the scan rates of 5, 10, 20, 30, and 50 mV s−1, respectively. A high capacitance value of 563.0 F g−1 is still obtained with a 10-fold increase in the scan rate, suggesting the good rate capability of the electrode material. The variation of specific capacitance values from the CV curves with scan rate for PGNF composites is presented in Table S1.†The GCD study of the 10 PGNF electrode material at different current densities ranging from 1 to 20 A g−1 in a fixed potential window of 0–0.45 V is shown in Fig. 11b. The nearly symmetrical GCD plot shown by the electrode material is an indication of good capacitive properties. The estimated specific capacitance values are 1320.0 F g−1, 1227.0 F g−1, 1129.0 F g−1, 1107.0 F g−1, 1084.0 F g−1, 987.0 F g−1, 889.0 F g−1 and 800.0 F g−1 for the current densities of 1, 2, 4, 6, 8, 12, 16, and 20 A g−1, respectively. For a 20-fold increase in the current density, the specific capacitance value still remains at 800.0 F g−1, which is 60.6% of the initial value. This result demonstrates impressive rate capability and the high practical utility of 10 PGNF as a supercapacitor electrode material and further supports the results from CV studies. The computed specific capacitance and specific capacity values from the GCD curves of PGNF composites are presented in Table S2.†
The Nyquist plot of the 10 PGNF composite electrode shown in Fig. 11c reveals the absence of a semicircle and shows a straight line without any deviation in the low frequency region. This type of impedance behavior is highly suitable for supercapacitor applications as it provides a low resistance value with high capacitance. The obtained high specific capacitance values are in strong agreement with the impedance results. The fitted equivalent circuit for the plot is given in the inset of Fig. 11c, which includes all the features of the plot. The constant phase element Q is connected in parallel to the charge-transfer resistance (Rct) and is in series connection with the solution resistance (Rs). The Warburg element (W) is connected in series with the Rct. The divergence of the plot at the low frequency region from the imaginary axis is indicative of deviation from ideal capacitive nature and is shown by parallel connection of leakage current (RL) with the capacitive element (C).6 The cycling life of the 10 PGNF electrode material is studied for up to 10![[thin space (1/6-em)]](https://www.rsc.org/images/entities/char_2009.gif) 000 cycles at a high current density of 8 A g−1. It is observed that even after 10
000 cycles at a high current density of 8 A g−1. It is observed that even after 10![[thin space (1/6-em)]](https://www.rsc.org/images/entities/char_2009.gif) 000 cycles, around 94% of the initial capacitance value is retained for the electrode material indicating good stability and usefulness of the material (Fig. 11d).
000 cycles, around 94% of the initial capacitance value is retained for the electrode material indicating good stability and usefulness of the material (Fig. 11d).
The energy density (W h kg−1) and power density (W kg−1) of the electrode material at current densities ranging from 1–20 A g−1 are displayed in Table 2. A high energy density value of 37.2 W h kg−1 is obtained while maintaining a power density of 225.5 W kg−1 at a current density of 1 A g−1, and the electrode material still maintains a good energy density value of 22.5 W h kg−1 with a power density value of 4500.0 W kg−1 at a higher current density of 20 A g−1. This result in fact reflects the superb stability of the electrode material.
| Current density (A g−1) | Energy density (W h kg−1) | Power density (W kg−1) |
|---|---|---|
| a The values of energy densities and power densities given in the parentheses correspond to those determined by the integral method. | ||
| 1 | 37.2 (20.9) | 225.5 (130.9) |
| 2 | 34.5 (19.2) | 450.3 (263.5) |
| 4 | 31.8 (18.0) | 901.4 (541.8) |
| 6 | 31.1 (16.3) | 1350.4 (790.1) |
| 8 | 30.4 (15.4) | 1802.2 (1050.4) |
| 12 | 27.8 (14.3) | 2704.8 (1575.7) |
| 16 | 25.0 (13.5) | 3600.4 (2083.2) |
| 20 | 22.5 (10.0) | 4500.0 (2535.5) |
To study the effect of addition of PG to NF, we compare the CV curves of the NF, PG and 10 PGNF electrodes at a constant scan rate of 5 mV s−1 in the potential range of 0–0.5 V (Fig. S7a†). The NF and PG electrodes occupy less area than the 10 PGNF electrode, which is due to the relatively low conducting ability of the NF and PG electrodes. However, after incorporating PG in NF the electronic conductivity increases appreciably due to the synergic effect of the composite components. The specific capacitance values for the NF, PG and 10 PGNF electrodes are found to be 478.0 F g−1, 537.0 F g−1 and 1465.0 F g−1, respectively. The GCD studies of the NF, PG and 10 PGNF electrodes at a constant current density of 1 A g−1 in the potential range of 0–0.45 V are compared in Fig. S7b.† Compositing of PG with NF increased the discharging time in comparison to NF and PG. The calculated specific capacitance values for the NF, PG and 10 PGNF electrodes from the GCD studies are 368.0 F g−1, 473.0 F g−1 and 1320.0 F g−1, respectively. The Nyquist plot reveals that 10 PGNF has higher conductivity than NF and PG electrodes as predicted by DFT studies due to the higher density of states near the Fermi level (Fig. S8†). The electrochemical parameters derived from the admittance plot are given in Table S3.†
Furthermore, the percentage of capacitive and diffusive contributions to the total stored charge can be estimated by using the below equation.6
| CTotal = CEDL + CP | (1) |
3.9. Electrochemical analysis of the fabricated symmetrical supercapacitor using 10 PGNF composite electrodes
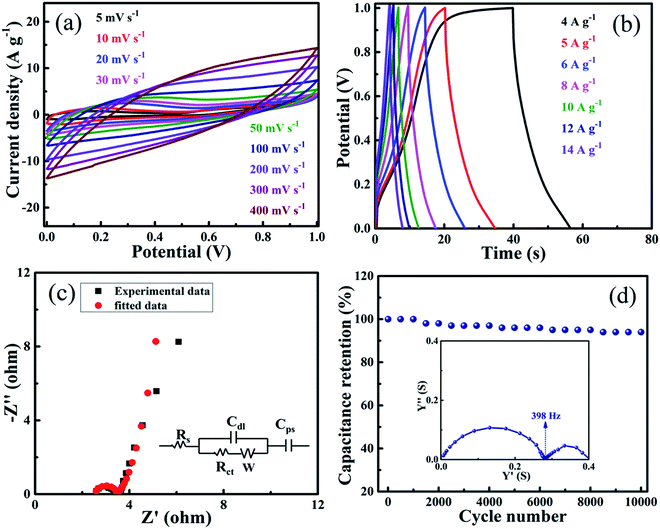
The 10 PGNF composite electrode material displayed satisfactory results when it was tested as an electrode. This motivated us to study the electrode properties in a symmetrical supercapacitor set up in aqueous 2 M KOH electrolyte. The CV curves of the fabricated supercapacitor with the 10 PGNF composite electrode at various scan rates ranging from 5 to 400 mV s−1 show a nearly rectangular shape, which further predicts the good electrochemical features of the material (Fig. 12a). The calculated specific capacitance values from the CV curves are 303, 267, 235, 219, 180, 134, 92, 70 and 54 F g−1 for the scan rates ranging from 5–400 mV s−1. The symmetrical GCD curves at varying current densities ranging from 4 to 14 A g−1 reveal the good capacitive behavior of the material (Fig. 12b).3,44 The calculated specific capacitance (specific capacity) values from the GCD curves are 160 F g−1 (160 C g−1), 153 F g−1 (153 C g−1), 149 F g−1 (149 C g−1), 138 F g−1 (138 C g−1), 128 F g−1 (128 C g−1), 122 F g−1 (122 C g−1) and 115 F g−1 (115 C g−1) for the current densities varying from 4 to 14 A g−1. The Nyquist plot reveals a small semicircle in the high frequency region and a flat tail in the low frequency region, suggesting good electrochemical characteristics of the supercapacitor (Fig. 12c). The best fitted equivalent circuit for the device is shown in the inset of Fig. 12c.21 The intercept on the real (Z′) axis corresponds to the solution resistance (Rs), which consists of the resistance offered by the electroactive material, electrolyte solution and contact between the electroactive material/current collector interface. The charge transfer resistance (Rct) and double layer capacitance (Cdl) of the supercapacitor are shown by the arc in the high frequency region. The line making a 45° angle in the low frequency region is known as the Warburg impedance (W), generated due to the diffusion/transport of OH− ions into the electroactive material.45The cycle life of the symmetrical supercapacitor was tested for 10![[thin space (1/6-em)]](https://www.rsc.org/images/entities/char_2009.gif) 000 cycles at an applied current density of 8 A g−1. After the completion of the cycles, around 96% of the initial capacitance value is retained for the supercapacitor demonstrating its good cycling stability (Fig. 12d). The incorporation of spinel NF nanoparticles in between the PG sheets prevents their restacking due to π–π interaction and results in the formation of a robust hybrid structure. The material maintains its electroactive channels intact without collapsing during repeated cycling leading to enhanced stability of the electrode and fabricated supercapacitor device. This is also in conformity with the results of voltage holding tests elaborated in the later section. The admittance plot of the supercapacitor is displayed in the inset of Fig. 12d. The obtained knee frequency for the plot is 398 Hz, suggesting its best utility as a supercapacitor below this frequency. The time constant value estimated from this knee frequency value is 0.00251 seconds. The lower time constant value suggests that the device can change from a resistive trait to a supercapacitor trait within a very less time, which is an added quality for a good supercapacitor. The computed energy density (W h kg−1) and power density (W kg−1) values from the GCD curves are displayed in Table 3. The obtained energy density and power density values at a current density of 4 A g−1 is 5.6 W h kg−1 and 1008.0 W kg−1, respectively, and at a current density of 14 A g−1, they remain at 4.0 W h kg−1 and 3600.0 W kg−1, respectively, showing its stability and utility. The double layer and pseudocapacitance contributions for the symmetrical supercapacitor device are presented in Fig. S10.† The calculated double layer contribution is 55.8% and the pseudocapacitance contribution is 44.2%. Also, the obtained specific capacitance values for the electrode material and the fabricated supercapacitor are compared with recent literature reports, which shows an impressive performance of the current material (Table S4†).
000 cycles at an applied current density of 8 A g−1. After the completion of the cycles, around 96% of the initial capacitance value is retained for the supercapacitor demonstrating its good cycling stability (Fig. 12d). The incorporation of spinel NF nanoparticles in between the PG sheets prevents their restacking due to π–π interaction and results in the formation of a robust hybrid structure. The material maintains its electroactive channels intact without collapsing during repeated cycling leading to enhanced stability of the electrode and fabricated supercapacitor device. This is also in conformity with the results of voltage holding tests elaborated in the later section. The admittance plot of the supercapacitor is displayed in the inset of Fig. 12d. The obtained knee frequency for the plot is 398 Hz, suggesting its best utility as a supercapacitor below this frequency. The time constant value estimated from this knee frequency value is 0.00251 seconds. The lower time constant value suggests that the device can change from a resistive trait to a supercapacitor trait within a very less time, which is an added quality for a good supercapacitor. The computed energy density (W h kg−1) and power density (W kg−1) values from the GCD curves are displayed in Table 3. The obtained energy density and power density values at a current density of 4 A g−1 is 5.6 W h kg−1 and 1008.0 W kg−1, respectively, and at a current density of 14 A g−1, they remain at 4.0 W h kg−1 and 3600.0 W kg−1, respectively, showing its stability and utility. The double layer and pseudocapacitance contributions for the symmetrical supercapacitor device are presented in Fig. S10.† The calculated double layer contribution is 55.8% and the pseudocapacitance contribution is 44.2%. Also, the obtained specific capacitance values for the electrode material and the fabricated supercapacitor are compared with recent literature reports, which shows an impressive performance of the current material (Table S4†).
| Current density (A g−1) | Energy densitya (W h kg−1) | Power densitya (W kg−1) |
|---|---|---|
| a The values of energy densities and power densities given in parentheses correspond to those determined by the integral method. | ||
| 4 | 5.6 (1.6) | 1008.0 (350.8) |
| 5 | 5.3 (1.5) | 1250.0 (375.3) |
| 6 | 5.2 (1.4) | 1502.0 (449.7) |
| 8 | 4.8 (1.3) | 2005.8 (603.9) |
| 10 | 4.4 (1.1) | 2500.0 (692.9) |
| 12 | 4.2 (0.9) | 3001.9 (751.5) |
| 14 | 4 (0.7) | 3600.0 (791.3) |
In order to further study the performance and stability of the device, CV and EIS measurements were performed after voltage holding for 50 h (Fig. 13). The specific capacitance as a function of time at a constant scan rate of 100 mV s−1 reveals that 70% of the capacitance value is retained after 50 h (Fig. 13a). The CV curves of the 10 PGNF device before and after the voltage holding test show a nearly rectangular shape with no appreciable changes in the shape and just a slight decrease in the area occupied after the test, indicating that the stability of the material is quite good (Fig. 13a inset). The EIS analysis depicts that the Rs and Rct values increase slightly from 2.4 ohm and 1.12 ohm to 3.3 ohm and 2.0 ohm, respectively, after 50 h as indicated by a larger semicircle in the latter case (Fig. 13b). The slight decrease in the CV area and increase in the resistance values with an increase in the holding time may be ascribed to the blockage of channels hindering the smooth electrochemical process.
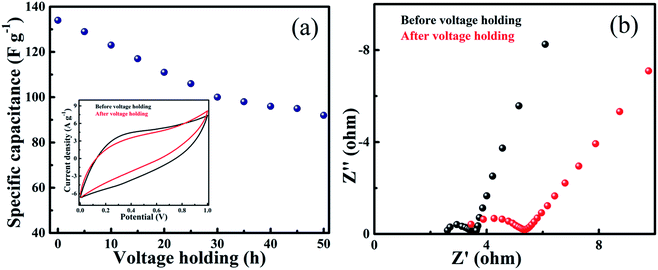 | ||
| Fig. 13 (a) Specific capacitance as a function of voltage holding time (inset: CV curves of 10 PGNF before and after 50 h voltage holding time) and (b) EIS plots before and after voltage holding. | ||
4. Conclusions
We report for the first time a facile synthesis of the PGNF nanocomposite via a solvothermal method by incorporating NF nanoparticles into PG. The thoroughly characterized composite material when tested as a single electrode material and as a supercapacitor exhibited superior electrochemical performance. The electrode and the fabricated symmetrical supercapacitor device showed a high capacitance value of 1465.0 F g−1 and 303.0 F g−1, respectively, at a scan rate of 5 mV s−1. The energy density and power density values of the fabricated supercapacitor were 5.5 W h kg−1 and 1008.0 W kg−1, respectively, at a current density of 4 A g−1, and 4.0 W h kg−1 and 3600.0 W kg−1, respectively, at a current density of 14 A g−1. This is a consequence of the high electrical conductivity and smooth passage for electrolyte ions provided by the electroactive channels in PGNF. The high cycling stability and rate capability of the material manifest as retention of 94% and 96% of the initial capacitance after 10![[thin space (1/6-em)]](https://www.rsc.org/images/entities/char_2009.gif) 000 cycles at a high current density of 8 A g−1 for the electrode and the fabricated symmetrical supercapacitor device, respectively, suggesting that the PGNF composite has a robust hybrid structure and high electrochemical stability. The synergistic contribution of the PG and NF in the PGNF nanocomposite makes it a promising electrode material for supercapacitors.
000 cycles at a high current density of 8 A g−1 for the electrode and the fabricated symmetrical supercapacitor device, respectively, suggesting that the PGNF composite has a robust hybrid structure and high electrochemical stability. The synergistic contribution of the PG and NF in the PGNF nanocomposite makes it a promising electrode material for supercapacitors.
Conflicts of interest
The authors declare no competing financial interest.References
- M. Sethi, H. Bantawal, S. U. Shenoy and D. K. Bhat, J. Alloys Compd., 2019, 799, 256 CrossRef CAS.
- X. Liu, S. Zou, K. Liu, C. Lv, Z. Wu, Y. Yin, T. Liang and Z. Xie, J. Power Sources, 2018, 384, 214–222 CrossRef CAS.
- H. Bantawal, M. Sethi, U. S. Shenoy and D. K. Bhat, ACS Appl. Nano Mater., 2019, 2, 6629–6636 CrossRef CAS.
- K. Ghosh, C. Y. Yue, M. M. Sk, R. K. Jena and S. Bi, Sustainable Energy Fuels, 2018, 2, 280–293 RSC.
- X. Meng, L. Lu and C. Sun, ACS Appl. Mater. Interfaces, 2018, 10, 16474–16481 CrossRef CAS PubMed.
- M. Sethi, S. U. Shenoy and D. K. Bhat, New J. Chem., 2020, 44, 4033–4041 RSC.
- C. An, Y. Zhang, H. Guo and Y. Wang, Nanoscale Adv., 2019, 1, 4644–4658 RSC.
- A. E. Elkholy, F. E. T. Heakal and N. K. Allam, RSC Adv., 2017, 7, 51888–51895 RSC.
- F. M. Ismail, M. Ramadan, A. M. Abdellah, I. Ismail and N. K. Allam, J. Electroanal. Chem., 2018, 817, 111–117 CrossRef CAS.
- M. Sethi and D. K. Bhat, J. Alloys Compd., 2019, 781, 1013–1020 CrossRef CAS.
- M. Fu, W. Chen, X. Zhu and Q. Liu, J. Power Sources, 2018, 396, 41–48 CrossRef CAS.
- Z. Wang, X. Zhang, Y. Li, Z. Liu and Z. Hao, J. Mater. Chem. A, 2013, 1, 6393–6399 RSC.
- B. Bashir, A. Rahman, H. Sabeeh, M. A. Khan, M. F. A. Aboud, M. F. Warsi, I. Shakir, P. O. Agboola and M. Shahid, Ceram. Int., 2019, 45, 6759–6766 CrossRef CAS.
- M. Sethi, S. U. Shenoy, M. Selvakumar and D. K. Bhat, Front. Mater. Sci., 2020, 14, 120–132 CrossRef.
- M. S. Javed, C. Zhang, L. Chen, Y. Xi and C. Hu, J. Mater. Chem. A, 2016, 4, 8851–8859 RSC.
- J. Ge, G. Fan, Y. Si, J. He, H. Y. Kim, B. Ding, S. S. Al-Deyab, M. El-Newehy and J. Yu, Nanoscale, 2016, 8, 2195–2204 RSC.
- K. Ghosh and C. Y. Yue, Electrochim. Acta, 2018, 276, 47–63 CrossRef CAS.
- K. Hareesh, B. Shateesh, R. P. Joshi, S. S. Dahiwale, V. N. Bhoraskar, S. K. Haram and S. D. Dhole, Electrochim. Acta, 2016, 201, 106–116 CrossRef CAS.
- N. Kumar, A. Kumar, G. M. Huang, W. W. Wu and T. Y. Tseng, Appl. Surf. Sci., 2018, 433, 1100–1112 CrossRef CAS.
- Y. Zhao, L. Xu, J. Yan, W. Yan, C. Wu, J. Lian, Y. Huang, J. Bao, J. Qiu, L. Xu and Y. Xu, J. Alloys Compd., 2017, 726, 608–617 CrossRef CAS.
- X. Zhang, M. Zhu, T. Ouyang, Y. Chen, J. Yan, K. Zhu, K. Ye, G. Wang, K. Cheng and D. Cao, Chem. Eng. J., 2019, 360, 171–179 CrossRef CAS.
- M. M. J. Sadiq, S. U. Shenoy and D. K. Bhat, RSC Adv., 2016, 6, 61821–61829 RSC.
- M. M. J. Sadiq, S. U. Shenoy and D. K. Bhat, Mater. Chem. Phys., 2018, 208, 112–122 CrossRef.
- S. V. Bhosale, S. R. Suryawanshi, S. V. Bhoraskar, M. A. More, D. S. Joag and V. L. Mathe, Mater. Res. Express, 2015, 2, 095001 CrossRef.
- M. M. J. Sadiq, S. U. Shenoy and D. K. Bhat, Adv. Sci., Eng. Med., 2017, 9, 115–121 CrossRef.
- B. Subramanya, Y. Ullal, S. U. Shenoy, D. K. Bhat and A. C. Hegde, RSC Adv., 2015, 5, 47398–47407 RSC.
- B. Subramanya and D. K. Bhat, New J. Chem., 2015, 39, 420–430 RSC.
- H. Bantawal, S. U. Shenoy and D. K. Bhat, Appl. Surf. Sci., 2020, 513, 145858 CrossRef CAS.
- A. R. Shaymaa, R. Rajagopalan, C. Subramaniyam, Z. Tai, J. Xian, X. Wang, S. X. Dou and Z. Cheng, Dalton Trans., 2018, 47, 14052–14059 RSC.
- F. Wu, X. Wang, M. Li and H. Xu, Ceram. Int., 2016, 42, 16666–16670 CrossRef CAS.
- C. Li, X. Wang, S. Li, Q. Li, J. Xu, X. Liu, C. Liu, Y. Xu, J. Liu, H. Li and P. Guo, Appl. Surf. Sci., 2017, 416, 308–317 CrossRef CAS.
- X. Chen, Y. Huang, K. Zhang, X. Feng and S. Li, J. Alloys Compd., 2016, 686, 905–913 CrossRef CAS.
- M. M. J. Sadiq, S. U. Shenoy and D. K. Bhat, Mater. Today Chem., 2017, 4, 133–141 CrossRef.
- Y. Zhao, M. Yuan, Y. Chen, J. Yan, L. Xu, Y. Huang, J. Lian, J. Bao, J. Qiu, L. Xu and Y. Xu, Electrochim. Acta, 2018, 260, 439–448 CrossRef CAS.
- M. M. J. Sadiq, S. U. Shenoy and D. K. Bhat, Front. Mater. Sci., 2018, 12, 247–263 CrossRef.
- D. M. E. Gendy, N. A. A. Ghany, E. E. F. E. Sherbini and N. K. Allam, Sci. Rep., 2017, 7, 43104 CrossRef PubMed.
- M. M. J. Sadiq, S. U. Shenoy and D. K. Bhat, J. Phys. Chem. Solids, 2017, 109, 124–133 CrossRef CAS.
- L. Zheng, L. Guan, G. Yang, S. Chen and H. Zheng, RSC Adv., 2018, 8, 8607–8614 RSC.
- G. Zhang, Y. Li, Y. Zhou and F. Yang, ChemElectroChem, 2016, 3, 1927–1936 CrossRef CAS.
- S. Badrayyana, D. K. Bhat, S. Shenoy, Y. Ullal and A. C. Hegde, Int. J. Hydrogen Energy, 2015, 40, 10453–10462 CrossRef CAS.
- S. Balamurugan, M. D. Devi, I. Prakash and S. Devaraj, Appl. Surf. Sci., 2018, 449, 542–550 CrossRef CAS.
- A. E. Elkholy, F. E. T. Heakal and N. K. Allam, Electrochim. Acta, 2019, 296, 59–68 CrossRef CAS.
- S. Ruan, C. Ma, J. Wang, W. Qiao and L. Ling, Chem. Eng. J., 2019, 367, 64–75 CrossRef CAS.
- S. Badrayyana and D. K. Bhat, J. Power Sources, 2015, 275, 90–98 CrossRef.
- A. M. Elseman, M. G. Fayed, S. G. Mohamed, D. A. Rayan, N. K. Allam, M. M. Rashad and Q. L. Song, ChemElectroChem, 2020, 7, 526–534 CrossRef CAS.
Footnote |
| † Electronic supplementary information (ESI) available. See DOI: 10.1039/d0na00440e |
| This journal is © The Royal Society of Chemistry 2020 |


