 Open Access Article
Optimisation of the thermoelectric efficiency of zirconium trisulphide monolayers through unixial and biaxial strain†
Fernan
Saiz
 *a,
Jesús
Carrete
 b and
Riccardo
Rurali
 c
c
aInstitut de Ciència de Materials de Barcelona (ICMAB-CSIC), Campus de la UAB, Bellaterra, 08193, Spain. E-mail: fsaiz@icmab.es
bInstitute of Materials Chemistry, TU Wien, Getreidemarkt 9, 1060 Vienna, Austria. E-mail: jesus.carrete.montana@tuwien.ac.at
cInstitut de Ciència de Materials de Barcelona (ICMAB-CSIC), Campus de la UAB, Bellaterra, 08193, Spain. E-mail: rrurali@icmab.es
First published on 14th October 2020
Abstract
The goal of this work is to investigate the influence of mechanical deformation on the electronic and thermoelectric properties of ZrS3 monolayers. We employ density functional theory (DFT) calculations at the hybrid HSE06 level to evaluate the response of the electronic band gap and mobilities, as well as the thermopower, the electrical conductivity, the phononic and electronic contributions to the thermal conductivity, and the heat capacity. Direct examination of the electronic band structures reveals that the band gap can be increased by up to 17% under uniaxial strain, reaching a maximum value of 2.32 eV. We also detect large variations in the electrical conductivity, which is multiplied by 3.40 under a 4% compression, but much smaller changes in the Seebeck coefficient. The effects of mechanical deformation on thermal transport are even more significant, with a nearly five-fold reduction of the lattice thermal conductivity under a biaxial strain of −4%. By harnessing a combination of these effects, the thermoelectric figure of merit of strained ZrS3 could be doubled with respect to the unstrained material.
1 Introduction
Strain engineering is an emerging field that tries to optimize the performance of materials,1,2 and in particular, of 2D compounds such as graphene,3,4 arsenene and phosphorene,5 molybdenum disulphide6 or titanium disulphide7,8 for particular applications through the use of mechanical deformations. Strain engineering can be also applied to transition metal trichalcogenides9,10 (MX3 with M = Ti, Zr, or Hf and X = S, Se, or Te), which have recently attracted significant attention due to their narrow band gaps between 1.0 and 2.0 eV (ref. 11) that render their nanosheets suitable not only for optical and electronic applications,12 but also as building blocks in thermoelectric devices.1,13 For thermoelectric applications, the ongoing efforts to increase their efficiency must target their dimensionless figure of merit, zT, defined as | (1) |
Another feature to be considered with a view to maximising the thermoelectric efficiency of layered trichalcogenides is the anisotropy of their thermal and electronic properties. For instance, in a recent work17 we have shown that the thermal conductivity of TiS3 monolayers and bilayers is highly dependent on the in-plane direction, with values at 300 K of 8.85 W m−1 K−1 in the x-direction and 13.56 W m−1 K−1 along the y-axis (the reference system is the same used here for ZrS3 and illustrated in Fig. 1). Moreover, under a 7% compression the electrical conductivity of TiS3 monolayers, and therefore their power factor, can nearly double in value with respect to the undeformed case.18 Apart from TiS3, little is known about the thermoelectric potential of other trichalcogenides. A recent study has compared the thermoelectric performances of the bulk phase and a monolayer of zirconium trisulphide (ZrS3),19 showing that the thermoelectric properties of the latter are anisotropic, a feature also exhibited by TiS3 in a number of experimental and theoretical studies.17,20,21 However, it is not clear if and how the interplay of anisotropy and strain can be harnessed to optimise the conversion of heat into electricity in ZrS3 monolayers.
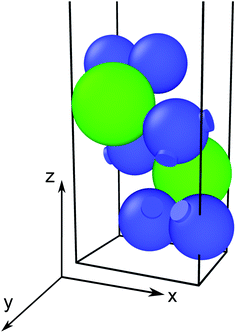 | ||
| Fig. 1 Ball-and-stick representation of the ZrS3 monolayer, with sulphur atoms depicted in blue and zirconium atoms in green. | ||
The goal of this work is thus to evaluate how the thermoelectric properties of zirconium trisulphide monolayers behave under strain. We use total energy first-principles calculations to obtain electronic and thermal properties such as electronic mobilities and band gaps, Seebeck coefficients, and electrical and thermal conductivities for a number of strains applied either uniaxially or biaxially to ZrS3 nanosheets. Those nanosheets are represented as a vacuum gap in contact with a unit cell whose atomic structure is optimised within density functional theory (DFT). We employ plane waves to represent the electronic wave functions, and the generalised gradient approximation (GGA) to the exchange and correlation energies as a starting point. We then recalculate the electronic structure using the hybrid exchange-correlation functional HSE06,22 which corrects the underestimated electronic band gap of the GGA calculation and substantially improves the agreement with the experimental values reported for ZrS3 nanostructures. Moreover, we compute the thermal properties of ZrS3 monolayers with a similarly fully ab initio approach starting from the relaxed atomic structure, paying attention to dynamical stability. ZrS3 is an n-type23 semiconductor with a direct optical band gap of (2.02 ± 0.02) eV, as measured in multilayered samples with an average thickness of (37 ± 2) nm.24 Previous measurements,23 performed on single-crystal nanostructures 10 mm in length, 1 mm in width, and a few microns in thickness, showed that this material has an outstanding thermopower of −850 μV K−1 measured at 300 K, with an electrical conductivity of 15 (Ω cm)−1 and an electron mobility of 25.98 cm2 V−1 s−1 for a charge carrier concentration of 4.5 × 10¹⁸ electrons per cm3. Those measurements correspond to transport along the atomic chains, i.e., the direction represented as the y axis in Fig. 1. A few years later, the electrical properties of ZrS3 crystals on a WSe2 substrate at 289 K were reported as σ = 0.038 (Ω cm)−1 and μ = 10.3 cm2 V−1 s−1 at a concentration of 2.33 × 10¹⁶ e− per cm3,25 along with a maximum Hall mobility of 29.1 cm2 V−1 s−1 at 144 K. More recently, suspended plates of ZrS3 yielded an electron mobility of 1132.9 cm2 V−1 s−1 and an electrical conductivity of 0.12 (Ω cm)−1 at a concentration of 0.66 × 10¹⁵ electrons per cm3.26 In this case, the suspended samples were fixed with silver paste on four contacts, which highlights to the key role of the substrate employed in the mobility measurements. We use those values as a reference to validate our calculations.
After this introduction, this manuscript is organised as follows. In Sec. 2, we detail the methodology employed to compute the charge mobilities, effective masses, Seebeck coefficients and other relevant thermoelectric quantities of ZrS3 monolayers under uniaxial and biaxial deformation. Next, in Sec. 3 we study the influence of stretching and compression on the electronic and thermal transport properties of the monolayer and evaluate the resulting figure of merit in order to detect the best strategies to increase the thermoelectric efficiency of those nanostructures. Finally, Sec. 4 presents our main findings and their implications for future work.
2 Theoretical methods
We use the Vienna Ab initio Simulation Package27–30 (VASP) to relax the positions and cell parameters of the ZrS3 monolayer models. Those are initially represented as a unit cell belonging to the P21/m space group, as shown in Fig. 1. Reciprocal space integrations are performed using a mesh of 10 × 14 × 1 k points centred at the Γ point. The geometry relaxation is carried out with thresholds of 1 × 10⁻⁸ eV nm−1 for the forces and 1 × 10⁻⁸ eV for the self-consistent solution of the electronic problem. These rather stringent thresholds are chosen so as to clearly identify those deformations that lead to imaginary phonon frequencies, i.e., to mechanical instability. We use the generalised gradient approximation to the exchange and correlation potential in the form proposed by Perdew, Burke, and Ernzerhof31 (PBE) and the projector-augmented wave method (PAW) to account for the core electrons.32,33 The valence orbitals are expanded on a plane-wave basis with an energy cutoff of 350 eV. This value is chosen after a convergence test of the total energy with respect to this parameter. Long-range van der Waals forces are included using Grimme's zero-damping DFT-D3 scheme.34 We include a vacuum layer of 1.4 nm to minimize the artifacts introduced by the periodic boundary conditions.Once the geometry of the ZrS3 monolayer is relaxed, we obtain the following values for the moduli of the lattice vectors: a = 0.512 nm and b = 0.363 nm. We then apply uniaxial and biaxial strains from −4.0% to 7.0% along the x and/or y directions in increases of 1%, keeping the lattice vector along the z axis, i.e. the vacuum layer thickness, constant. In this range of strains we always find exclusively real phonon frequencies, which points to the dynamical stability of the strained systems investigated. For uniaxial strains exerted along the x (or y) direction, the cell is allowed to adjust along the y (or x) axis, thus enabling a straightforward calculation of the in-plane components of the Poisson's ratio. We then employ the HSE06 functional22 to obtain the electronic structure of the optimised structures, from which we can obtain more reliable thermoelectric transport properties using the BoltzTraP code.35 This code uses semiclassical Boltzmann theory under the uniform single-mode relaxation time approximation, and therefore the results for the electrical conductivity and the electronic contribution to the thermal conductivity are proportional to that parameter. The carriers' relaxation time is defined as
 | (2) |
 | (3) |
 | (4) |
 | (5) |
 is the effective mass for holes if we fit for the valence band maximum and electrons for the conduction band minimum, and ki,0 is the wave vector at the position of those extrema. We carefully checked that the band gap is direct for all strains between −4.0% and 7.0%; thus, the fit is performed around the Γ point along the x and y directions in reciprocal space.
We now describe the workflow employed to calculate the thermal transport properties of ZrS3 monolayers. We use the almaBTE37 package, which needs matrices of second- and third-order interatomic force constants (IFCs) from supercells. These force constants are obtained with VASP using the same computational parameters described above with the exception of the reciprocal-space integration grid, which now consists only of the Γ point for each one of the displaced supercell configurations. Those configurations are generated by replicating the unit cell 4 × 5 times with Phonopy38 and thirdorder.py.39 A cutoff of 0.44 nm (i.e., up to the seventh nearest neighbors) is chosen for the third-order calculation. Due to the periodic boundary conditions and the corresponding breakdown of continuous rotation symmetry, the phonon frequencies of 2D systems calculated using this method are known to include numerical errors that can lead to the appearance of artifactual imaginary acoustic frequencies near Γ.18,40,41 Therefore, we need to apply a correction42 to enforce the rotational symmetry in our calculations. After this correction is applied, analysis of the phonon dispersion curves for all strains applied reveals that the structure becomes unstable for uniaxial and biaxial compressive strains higher than 4%, with non-negligible negative acoustic frequencies near Γ.
We also computed the Born effective charges in order to include the non-analytic corrections that, in 3D systems, result in a splitting of the transverse and longitudinal optical phonon branches at the Γ point. However, recent theoretical and experimental studies have shown that such a splitting is suppressed in 2D materials because of the fundamentally different physics of polar 2D vs. 3D systems regarding the effect of the dipole–dipole interactions.43,44
Once all force constants are computed, we use them as inputs to solve the Boltzmann Transport Equation (BTE) self-consistently45 and obtain the lattice thermal conductivity as
 | (6) |
3 Results and discussion
3.1 Electron mobilities
Tables 1 and 2 summarize the values of the elastic constants C of the monolayers, the deformation potential constants E1, the effective masses m*, the mobilities μ, and the relaxation times τ of holes and electrons in the x and y directions, calculated for undeformed monolayers using HSE06. Our electron mobilities overestimate the experimental values,23,25,26 a phenomenon also reported in other trichalcogenides such in TiS3.17,20,21 This discrepancy can, a priori, be attributed to different sets of factors, like an inaccurate determination of the mobility or the different conditions at which measurements and simulations are made. ), mobilities μ (cm2 V−1 s−1), and relaxation times τ (fs) of holes and electrons obtained after applying strains in the x (εx) and y (εy) directions, calculated using the HSE06 functional, for undeformed monolayers
| Strain | Carrier | C | E 1 | m * | μ | τ |
|---|---|---|---|---|---|---|
| ε x | Hole | 5.48 | −1.03 | −0.54 | 4038.27 | 1235.28 |
| ε y | Hole | 8.09 | −7.16 | −0.97 | 37.90 | 20.97 |
| ε x | Electron | 5.48 | 0.39 | 1.65 | 3004.82 | 2826.12 |
| ε y | Electron | 8.09 | 3.43 | 0.29 | 1810.53 | 302.45 |
 ), mobilities μ (cm2 V−1 s−1), and relaxation times τ (fs) of holes and electrons obtained after applying biaxial (εb) deformations, calculated using the HSE06 functional, for undeformed monolayers
| Strain | Carrier | C | E 1 | m * | μ | τ |
|---|---|---|---|---|---|---|
| ε b | Hole | 15.81 | −8.04 | −0.54 | 192.31 | 58.83 |
| ε b | Hole | 15.81 | 4.36 | −0.97 | 199.18 | 110.24 |
| ε b | Electron | 15.81 | −8.04 | 1.65 | 20.34 | 19.13 |
| ε b | Electron | 15.81 | 4.36 | 0.29 | 2186.61 | 365.27 |
Regarding the calculation of mobility from DFT using eqn (3), the disagreement may be caused by an incorrect calculation of the effective mass m* or of the constant E1 from deformation potential theory (or both) or by limitations of the formalism itself versus a more detailed treatment of electron-phonon scattering. However, it seems reasonable to assume that the HSE06 functional likely reproduces the shape of the conduction band in reciprocal space fairly well for two reasons. First, we find a very good agreement of the experimental optical and electronic band gaps; second, our hole effective masses are in excellent agreement with the values of −0.87 (±0.09) me along the x axis and −0.49 (±0.20) me along the y axis recently measured on ZrS3 nano-whiskers using nanospot angle resolved photoemission spectroscopy (nanoARPES).49
If we analyse the conditions at which simulations and experiments are carried out, we find the following factors that can be responsible for the disagreement: first, the ZrS3 samples in the experiments are multilayers rather than the monolayer we model with DFT; second, these samples can contain crystallographic defects or surface impurities as well as slightly different compositions that deviate from their ideal stoichiometry; and third, the samples were measured with different substrates. The first cause can be expected to have only a minor impact because the band gap of the experimental multilayer24 is very similar to that reported in the bulk19 and computed for the monolayer in this work. The second factor is likely to play a more significant role since the presence of crystallographic defects cannot be completely ruled out. Moreover, the stoichiometry of exfoliated ZrS3 layers has been reported to differ from the ideal ratio S/Zr = 3/1, which might a priori produce relevant changes in the electronic structure. Additionally, a strong influence is also exerted by the substrate employed to encapsulate the sample in the laboratory setup. For instance, the data provided in ref. 23 and 25 differs from that published in ref. 26. The first study used samples suspended on four gold contacts, while the second work employed WSe2 as a substrate, and the third fixed the samples with four silver contacts. Since silver is the best conductor among the three materials, it is to be expected that the highest mobility be recorded with this material.
3.2 Band gaps
For the purposes of work, we determine the electronic band gap as the difference between the conduction band minimum and valence band maximum for the PBE and HSE06 functionals. This formulation yields band gaps of 1.09 eV for PBE and 1.99 eV for HSE06. Since HSE06 is able to provide an excellent agreement with the experimental optical band gap, we stick to HSE06 when calculating the properties necessary to obtain the figure of merit for ZrS3 under strain. Fig. 2 shows that the HSE06 band gap responds anisotropically to mechanical stress: on the one hand, it only decreases slightly when compression and stretching are applied in the x direction (i.e., perpendicular to the chains), with changes smaller than 4% for εx = −4%; on the other hand, it gets narrowed by −24.9%, down to 1.49 eV, under a strain εy = −4%, and grows with increasingly positive εy up to 2.33 eV, which represents a widening by 17.30%. The behavior under biaxial deformation is similar to the response to εy alone, suggesting that the latter drives the former.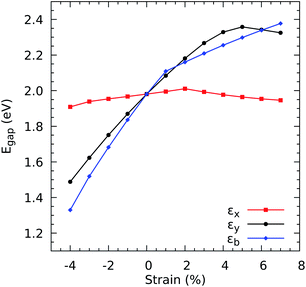 | ||
| Fig. 2 Electronic band gaps Egap, calculated using the HSE06 functional, as a function of the uniaxial strains, (εx) and (εy), and the biaxial strain, (εb). | ||
Another crucial electronic property in n-type semiconductors, such as ZrS3, is the electron mobility, which dictates how fast an electron can move through the lattice, in effective terms, under the effect of an electric field. In this study, we are interested in quantifying the values of the electron mobility and its anisotropy, but also how much it varies with mechanical deformation. Fig. 3 shows a strong growth of μy with increasing εx and a slower increase of μx with increasing εy. In contrast, μx decreases with increasing εx and μy decreases with increasing εy. Therefore, the mobility increases under perpendicular strains but is reduced under parallel uniaxial deformations. The enhancements upon compressions of 4% are 51.73% along the x axis and 45.00% along the y axis, while the correspondent percentual reductions upon 7% stretching are 49.70% and 51.49%. For the biaxial cases, both components of the mobility decrease with increasing strain, which corresponds to the widening the band gap as shown in Fig. 2.
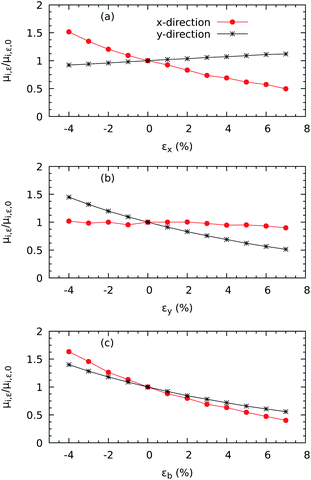 | ||
| Fig. 3 Electronic mobilities vs. uniaxial strains using the HSE06 functional along the x (a) and y (b) directions and biaxial strains (c). | ||
3.3 Electronic transport properties
We now discuss the variations of the Seebeck coefficient and the electrical conductivity with strain. Fig. 4 shows the values of the thermopower Sy in the range of concentrations between 1014 and 1020 electrons per cm3, which is wide enough to cover the range of values reported in the experiments reported in ref. 23, 25 and 26. The variations in both components (Sx and Sy) with respect to all three strains εx, εy, and εb are shown in Fig. S1 in the ESI.† In all cases, the absolute values of the thermopower decrease with increasing electron concentration following the Mott relation50 that predicts S ∝ n−2/3. At a concentration of 2.19 × 10¹⁶ electron per cm3, the principal components of the Seebeck coefficient tensor are Sx = −785.56 μV K−1 and Sy = −783.18 μV K−1 at, which compare fairly well with the −850 μV K−1 at the same concentration measured on nanowhiskers and reported in ref. 23. Moreover, the thermopower seems quite insensitive to mechanical deformations, with only minor differences (within 2%) for most of the concentrations. Only at very low concentrations of 1014 electrons per cm3 do we find that the thermopower increases significantly.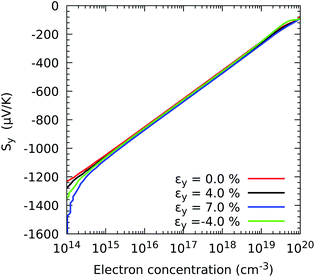 | ||
| Fig. 4 Effect of the electron concentration on the directional Seebeck coefficient Sy when strain is applied in the y direction of ZrS3 monolayers. | ||
We now discuss how we choose the relaxation times necessary to obtain numerical values of the electrical conductivity. Our DFT workflow, based on band deformation potentials, predicts electron relaxation times τx,DFT = 2825.12 fs and τy,DFT = 302.45 fs, whereas if we accept the experimental mobility reported in ref. 26, μexp = 1132.9 cm2 V−1 s−1, and plug it into eqn (2), we obtain the corresponding relaxation times τx,DFT-exp = 2826.12 fs and τy,DFT-exp = 302.45 fs, which in turn yield electrical conductivities at 0.66 × 10¹⁵ e− per cm3 of σx,DFT-exp = 0.46 (Ω cm)−1 and σy,DFT-exp = 0.17 (Ω cm)−1. Note that the latter is in excellent agreement with the 0.12 (Ω cm)−1 reported in ref. 26. We therefore opt for this approach, which is justified in view of the inability of the theoretical calculations to capture the complex experimental conditions in terms of substrate, defects, grain boundaries and other kind of lattice imperfection.
Note though that experimental data can also be taken to calculate electron mobilities following the method proposed in ref. 51. This method starts by setting the experimental Seebeck coefficient S(T;μ) as an input to determine the reduced chemical potential ηeff from its definition in BoltzTraP
 | (7) |
 | (8) |
In our case, we use the Seebeck coefficient component Sy = −850 μV K−1 reported in ref. 23; in eqn (7) to find a reduced chemical potential of ηeff = −9.74. We then plug this value in the following expression
 | (9) |
Having chosen appropriate relaxation times, we now illustrate the characteristic response of the electrical conductivity with respect to electron concentration and strain. The response of the in-plane component σyvs. εy is depicted in Fig. 5, and all combinations of in-plane components σx and σyvs. εx, εy and εb are shown in Fig. S2.† For uniaxial strains, each component experiences higher changes when the compression is parallel to the mechanical deformation. For instance the component σx increases by a factor of 2.87 with an εx of −4% and by 3.40 with an εb of −4%, and the component σy by 2.27 under an εy of −4%, at 0.66 × 10¹⁵ electron per cm3. Therefore, these enhancements evidence not only the possibility of improving the electronic transport by narrowing the band gap but also by increasing electron mobility. Specifically, the most remarkable improvements in electrical conductivity are detected when the electron mobility grows by nearly 50% upon 4% compression of the monolayer.
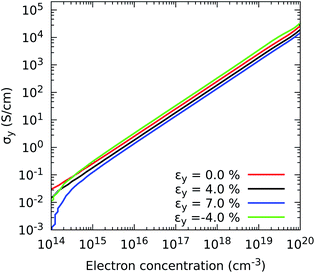 | ||
| Fig. 5 Effect of electron concentration on the directional electrical conductivity σy when strain is applied in the y direction of ZrS3 monolayers. | ||
3.4 Thermal transport properties
As a transition from electronic to thermal properties, we now examine the response of the electronic contribution κel to the thermal conductivity calculated with BoltzTraP under deformations. Here we are interested in reducing this contribution to improve the figure of merit. The reduction in κel occurs under tensile deformations that widen the band gap, and thus diminish the electrical conductivity. The decrease of the electrical conductivity causes a reduction in κel according to the Wiedemann–Franz law| κel = LσT, | (10) |
Fig. 6 and S3† show that strains applied along the x and y axes induce a similar response of the components κxxel and κyyel to those exhibited by their electrical conductivity counterparts, i.e., shrinking the ZrS3 nanosheet results in an enhancement of thermal transport by electrons, whereas stretching it reduces the amount of heat carried by these particles. Note that for concentrations higher than 1017 electrons per cm3, the heat transferred by electrons is comparable to that carried by phonons, as we show next. For instance, for the undeformed case, κxxel requires a concentration of 1.20 × 10¹⁷ electron per cm3 to reach a value of 1.15 W m−1 K−1, while κyyel requires a concentration of 5.75 × 10¹⁷ electron per cm3.
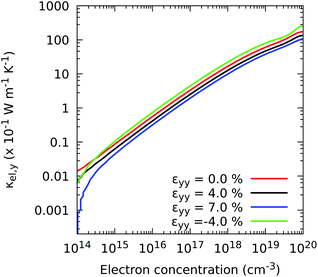 | ||
| Fig. 6 Effect of the electron concentration on the directional electronic contribution to the thermal conductivity κel,yy when strain is applied in the y direction. | ||
We now analyse the effects of deforming ZrS3 on phonon transport. We first show in Fig. 7 how the phonon dispersion curves change under biaxial strains of −4% and 7%. In particular, we draw the lowest-lying branches between Γ = [0.0, 0.0, 0.0] and Y = [0.125, 0.0, 0.0] to illustrate how these curves change near the zone centre when the rotational symmetry is restored, as described above. The results underscore the importance of this correction since, going by the raw results of the phononic calculations, a pocket of negative frequencies forms which would point to the presence of mechanical instabilities. Those disappear when the proper correction is applied and would also look unlikely in view of the fact (see Fig. S4†) that we are working in the elastic regime, with perpendicular deformations in x and y created in the monolayer as a response to the correspondent strain exerted in y and x that follow a linear relationship. As a result, we can extract the Poisson's ratios νxy = 0.12 and νyx = 0.18. The correction is also important to obtain reasonable values of the lattice thermal conductivity.18,42
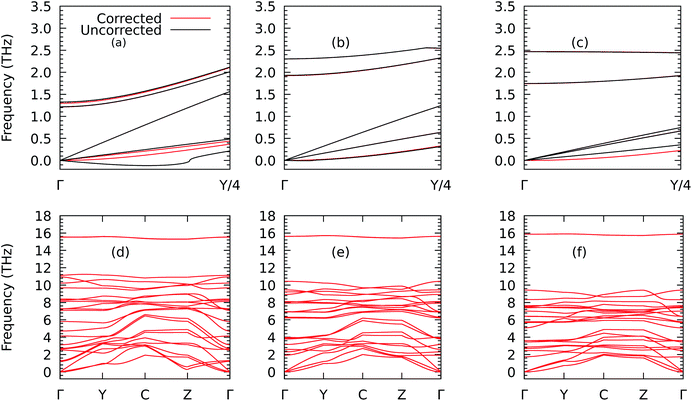 | ||
| Fig. 7 Details of the phonon dispersions from Γ = [0, 0, 0] to Y = [1/2, 0, 0] before (in black) and after (in red) correcting the harmonic IFCs according to the procedure given in ref. 40 for the ZrS3 monolayer for biaxial strains of −4% (a), 0% (b), and +7% (c) and their corresponding full views in (d), (e), and (f) along the path Γ–Y–C–Z–Γ, where C = [1/2, 1/2, 0] and Z = [0, 1/2, 0]. | ||
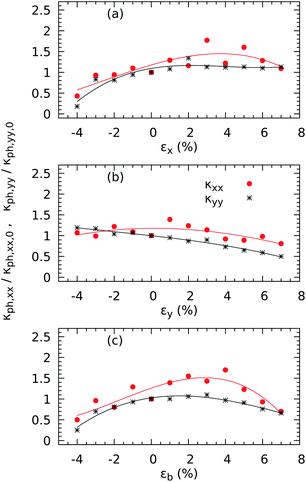
We then plot the components κph,xx and κph,yy of the thermal conductivity tensor (as calculated from the corrected force constants) in Fig. 8 to illustrate their different responses to uniaxial and biaxial stresses. When the monolayer is compressed by −4% along the x axis, both components decrease, down to 56.75% for κph,xx and 82.25% for κph,yy with respect to their zero-strain values of 18.65 W m−1 K−1 along the x-axis and 35.12 W m−1 K−1 along the y-axis. Meanwhile, a tensile εx has no significant effect on either in-plane conductivity. Along the y-axis, both components decrease with increasing strain, down to 7.49% of the original value for κph,xx and 19.20% of the no-strain value for κph,yy with εy = −4%. Nonetheless, the most significant effects are seen under biaxial strains εb: a compression of 7% causes both conductivities to decrease by 49.62% for κph,xx and 74.93% for κph,yy, and a compression εb = 4% decreases κph,xx by 30.05% and κph,yy by 34.28%. We note that the thermal transport along the x direction is enhanced for intermediate stretching as κph,xx increases by a factor of 1.29 with εx = 1% and 1.70 for with εb = 4%.
Since our study is intended to find those cases in which the figure of merit can be enhanced due to a reduction in the thermal transport, we now perform a deeper analysis of how strain reduces the thermal conductivity at 4% compression and at 7% stretching. According to eqn (6), changes in the thermal conductivity must be correlated to variations in the frequencies, group velocities or lifetimes of phonons. We show in Tables S1–S4† that the group velocities of the six lowest-lying branches (as a sample of the modes that carry most of the heat) vary significantly near Γ for uniaxial and biaxial deformations. However, not all of these group velocities are reduced upon compression. Therefore, we make a modal decomposition of the thermal conductivities (see Fig. S6 and S7† for details) and find that the lower frequencies contribute less when the monolayer is shrunk by 4%. Additionally, we show in Fig. S6† that heat capacities can be enhanced by a factor of up to 1.07 with εb = −4%, decreasing with increasing strain in both uniaxial and biaxial scenarios.
3.5 Thermoelectric efficiency: power factor and figure of merit
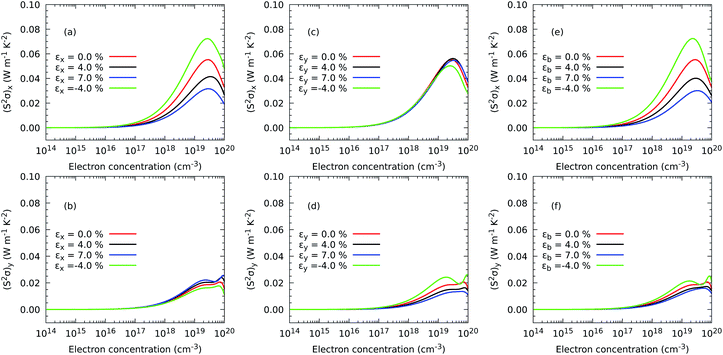
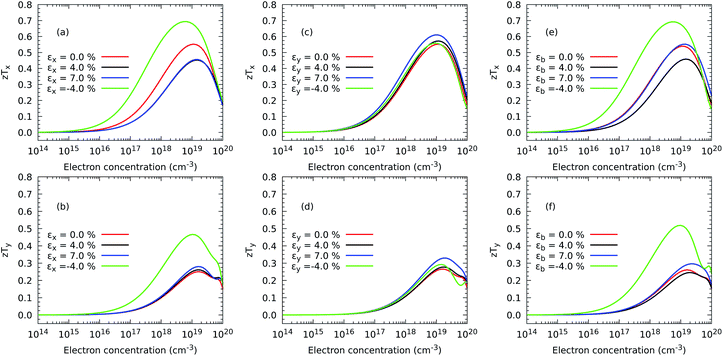
Finally, once all the thermal and charge transport properties are calculated, we analyse the behavior of the power factor S2σ and the figure of merit. The former describes the maximum amount of electrical power generated by a temperature difference ΔT, while the latter gives an idea of the efficiency of this conversion. Fig. 9 illustrates the behaviour of the power factor with strain. We predict that the generation of power is significantly enhanced only for a few values of the strain. In particular, (S2σ)x is maximum for εx and εb equal to −4%, and to a lower extent (S2σ)y is maximized by an εy equal to −4%. As we have recently observed for TiS3 monolayers,17 the behaviour of the power factor is driven by changes in the electrical conductivity caused by the widening of the electronic band gap under stretching.A similar picture is also exhibited by the figure of merit in Fig. 10, with the addition now that the component (zT)y is also enhanced under εx = εy = −4% as a result of depressed thermal transport caused by a shrinking of the monolayer. Although the absolute values of S2σ and zT depend on the choice of the relaxation time, our calculations predict that compression is successful at increasing the maximum value of zT with respect to the case with no stress applied on the atomic structure. In particular, the maximum (zT)x increases from 0.55 with 1.10 × 10¹⁹ electron per cm3 under no strain to 0.69 with 6.72 × 10¹⁸ electron per cm3 under a compressive strain εx = −4% and to 0.69 with 5.06 × 10¹⁸ electron per cm3 and εb = −4%, representing improvements of nearly 25% in both cases. A more striking result is obtained for the maximum (zT)y, which grows from 0.25 with 1.66 × 10¹⁹ electron per cm3 under no deformation to 0.47 with 1.05 × 10¹⁹ electron per cm3 applying εx = −4% and to 0.52 at 9.96 × 10¹⁹ electron per cm3, representing a rise of 86.06% and 107.00%, respectively. Based on these relative results, our DFT methodology is able to suggest a recipe to produce substantial improvements in the thermoelectric efficiency of ZrS3 due mostly to the reduction of the phonon thermal transport but also to a higher electrical conductivity.
4 Conclusions
In summary, we have calculated the electronic and thermal transport properties of ZrS3 monolayers under uniaxial and biaxial strains between −4.0% and 7.0% using first-principles calculations based on density functional theory and the hybrid functional HSE06. Our results indicate that the electronic band gap decreases substantially when compressing in the y-direction or in both directions simultaneously. For instance, in the former case the band gap can be reduced by 25%, from 1.98 to 1.49 eV, by shrinking the lattice by 4%. They also suggest that the band gap behaves similarly under biaxial stresses to the situation with uniaxial strain along the y-axis. Furthermore, we analyse the influence of mechanical strain on the electron mobilities by using deformation potential theory, which allows us to determine the electron relaxation times. Our calculations predict small changes in the Seebeck coefficient as metallic behaviour emerges, since the band gap is still present even for the tightest compressions. In contrast, the electrical conductivity exhibits higher variations upon shrinking of the monolayer with, for instance, its component σx growing by up to a factor of 3.40 under a biaxial compression of −4%, evidencing a relationship between an improvement of the electronic transport and the electron mobility. Furthermore, we have evaluated the electronic contribution to the thermal conductivity and determined that, even though it can be tuned through strain, its values require a doping level of at least 1019 electron per cm3 to compete with thermal transport by phonons. Meanwhile, the phononic contribution to the thermal conductivity shows a strong dependence on the direction and intensity of the mechanical applied. This contribution is highly anisotropic, with absolute values of the in-plane components of κph,xx = 18.65 W m−1 K−1 and κph,yy = 35.12 W m−1 K−1 at 300 K. We have found that the most successful strategy to reduce these values is to apply biaxial compressions of 4% and tensions of 7%. Finally, our predicted figure of merit at 300 K can be enhanced by 86.06% along the x-axis and 107.00% in the y-direction under a unidirectional compression of 4% along x.Overall, our calculations suggest that using strain to engineer the band gap and, more generally, the thermoelectric behaviour of a monolayer requires careful consideration of the direction along which deformation is applied. We note that possible buckling under compressive strain is outside the scope of this study, although the lack of imaginary phonon frequencies in our calculations suggests that the shrinkages that we propose should be achievable without inducing buckling.
Conflicts of interest
There are no conflicts to declare.Acknowledgements
We acknowledge the financial support received from the European Union's Horizon 2020 research and innovation programme under grant agreement No. 793726 (TELIOTES – Thermal and electronic transport in inorganic-organic thermoelectric superlattices), from the Ministerio de Economía, Industria y Competitividad (MINECO) under grant FEDER-MAT2017-90024-P and the Severo Ochoa Centres of Excellence Program Grant SEV-2015-0496, and from the Generalitat de Catalunya under grant no. 2017 SGR 1506. We also acknowledge the support from The Supercomputing Center of Galicia (CESGA), where the calculations have been made, and the fruitful discussions with Dr Andrés Castellanos-Gomez.References
- N. V. Morozova, I. V. Korobeinikov, K. V. Kurochka, A. N. Titov and S. V. Ovsyannikov, J. Phys. Chem. C, 2018, 122, 14362–14372 CrossRef CAS.
- Y. Wu, Z. Chen, P. Nan, F. Xiong, S. Lin, X. Zhang, Y. Chen, L. Chen, B. Ge and Y. Pei, Joule, 2019, 3, 1276–1288 CrossRef CAS.
- V. M. Pereira and A. C. Neto, Phys. Rev. Lett., 2009, 103, 046801 CrossRef.
- D. Zhang, K. Zhang, Y. Wang, Y. Wang and Y. Yang, Nano Energy, 2019, 56, 25–32 CrossRef CAS.
- A. Taheri, C. Da Silva and C. H. Amon, Phys. Chem. Chem. Phys., 2018, 20, 27611–27620 RSC.
- A. Castellanos-Gomez, R. Roldán, E. Cappelluti, M. Buscema, F. Guinea, H. S. van der Zant and G. A. Steele, Nano Lett., 2013, 13, 5361–5366 CrossRef CAS.
- G. Li, K. Yao and G. Gao, Nanotechnology, 2017, 29, 015204 CrossRef.
- R. D'Souza, S. Mukherjee and S. Ahmad, J. Appl. Phys., 2019, 126, 214302 CrossRef.
- L. Brattas and A. Kjekshus, Acta Chem. Scand., 1972, 26, 3441–3449 CrossRef CAS.
- S. Furuseth, L. Brattas and A. Kjekshus, Acta Chem. Scand., 1975, 29, 623 CrossRef.
- J. O. Island, A. J. Molina-Mendoza, M. Barawi, R. Biele, E. Flores, J. M. Clamagirand, J. R. Ares, C. Sánchez, H. S. van der Zant and R. D'Agosta, et al. , 2D Mater., 2017, 4, 022003 CrossRef.
- Y. Jin, X. Li and J. Yang, Phys. Chem. Chem. Phys., 2015, 17, 18665–18669 RSC.
- Y. Saeed, A. Kachmar and M. A. Carignano, J. Phys. Chem. C, 2017, 121, 1399–1403 CrossRef CAS.
- R. Biele, E. Flores, J. R. Ares, C. Sanchez, I. J. Ferrer, G. Rubio-Bollinger, A. Castellanos-Gomez and R. D'Agosta, Nano Res., 2018, 11, 225–232 CrossRef CAS.
- R. Roldán, A. Castellanos-Gomez, E. Cappelluti and F. Guinea, J. Phys.: Condens. Matter, 2015, 27, 313201 CrossRef.
- X. Meng, T. Pandey, J. Jeong, S. Fu, J. Yang, K. Chen, A. Singh, F. He, X. Xu, J. Zhou, W.-P. Hsieh, A. K. Singh, J.-F. Lin and Y. Wang, Phys. Rev. Lett., 2019, 122, 155901 CrossRef CAS.
- F. Saiz and R. Rurali, Nano Express, 2020, 1, 010026 CrossRef.
- F. Saiz, J. Carrete and R. Rurali, Nanomaterials, 2020, 10, 704 CrossRef CAS.
- C. Wang, C. Zheng and G. Gao, J. Phys. Chem. C, 2020, 124, 6536–6543 CrossRef CAS.
- J. O. Island, R. Biele, M. Barawi, J. M. Clamagirand, J. R. Ares, C. Sánchez, H. S. Van Der Zant, I. J. Ferrer, R. D'Agosta and A. Castellanos-Gomez, Sci. Rep., 2016, 6, 1–7 CrossRef.
- J. Zhang, X. Liu, Y. Wen, L. Shi, R. Chen, H. Liu and B. Shan, ACS Appl. Mater. Interfaces, 2017, 9, 2509–2515 CrossRef CAS.
- J. Heyd, G. E. Scuseria and M. Ernzerhof, J. Chem. Phys., 2003, 118, 8207–8215 CrossRef CAS.
- G. Perluzzo, A. Lakhani and S. Jandl, Solid State Commun., 1980, 35, 301–304 CrossRef CAS.
- E. Flores, J. R. Ares, I. J. Ferrer and C. Sánchez, Phys. Status Solidi RRL, 2016, 10, 802–806 CrossRef CAS.
- R. Späh, M. Lux-Steiner, E. Bucher and S. Wagner, Appl. Phys. Lett., 1984, 45, 744–745 CrossRef.
- K. R. Patel, Int. J. Phys., Chem. Math. Sci., 2012, 2, 74–85 Search PubMed.
- G. Kresse and J. Hafner, Phys. Rev. B: Condens. Matter Mater. Phys., 1993, 47, 558–561 CrossRef CAS.
- G. Kresse and J. Hafner, Phys. Rev. B: Condens. Matter Mater. Phys., 1994, 49, 14251–14269 CrossRef CAS.
- G. Kresse and J. Furthmüller, Comput. Mater. Sci., 1996, 6, 15–50 CrossRef CAS.
- G. Kresse and J. Furthmüller, Phys. Rev. B: Condens. Matter Mater. Phys., 1996, 54, 11169–11186 CrossRef CAS.
- J. P. Perdew, K. Burke and M. Ernzerhof, Phys. Rev. Lett., 1996, 77, 3865–3868 CrossRef CAS.
- P. E. Blöchl, Phys. Rev. B: Condens. Matter Mater. Phys., 1994, 50, 17953–17979 CrossRef.
- G. Kresse and D. Joubert, Phys. Rev. B: Condens. Matter Mater. Phys., 1999, 59, 1758–1775 CrossRef CAS.
- S. Grimme, J. Antony, S. Ehrlich and H. Krieg, J. Chem. Phys., 2010, 132, 154104 CrossRef.
- G. K. Madsen and D. J. Singh, Comput. Phys. Commun., 2006, 175, 67–71 CrossRef CAS.
- J. Bardeen and W. Shockley, Phys. Rev., 1950, 80, 72 CrossRef CAS.
- J. Carrete, B. Vermeersch, A. Katre, A. van Roekeghem, T. Wang, G. K. Madsen and N. Mingo, Comput. Phys. Commun., 2017, 220, 351–362 CrossRef CAS.
- A. Togo and I. Tanaka, Scr. Mater., 2015, 108, 1–5 CrossRef CAS.
- W. Li, J. Carrete, N. A. Katcho and N. Mingo, Comput. Phys. Commun., 2014, 185, 1747–1758 CrossRef CAS.
- J. Carrete, W. Li, L. Lindsay, D. A. Broido, L. J. Gallego and N. Mingo, Mater. Res. Lett., 2016, 4, 204–211 CrossRef CAS.
- P. Torres, F. X. Alvarez, X. Cartoixà and R. Rurali, 2D Mater., 2019, 6, 035002 CrossRef CAS.
- J. Carrete, W. Li, L. Lindsay, D. A. Broido, L. J. Gallego and N. Mingo, Mater. Res. Lett., 2016, 4, 204–211 CrossRef CAS.
- T. Sohier, M. Gibertini, M. Calandra, F. Mauri and N. Marzari, Nano Lett., 2017, 17, 3758–3763 CrossRef CAS.
- M. D. Luca, X. Cartoixa, D. Indolese, J. Martín-Sánchez, K. Watanabe, T. Taniguchi, C. Schoenenberger, R. Trotta, R. Rurali and I. Zardo, 2D Mater., 2020, 7, 035017 CrossRef.
- J. Carrete, B. Vermeersch, A. Katre, A. van Roekeghem, T. Wang, G. K. Madsen and N. Mingo, Comput. Phys. Commun., 2017, 220, 351–362 CrossRef CAS.
- W. Li, L. Lindsay, D. A. Broido, D. A. Stewart and N. Mingo, Phys. Rev. B: Condens. Matter Mater. Phys., 2012, 86, 174307 CrossRef.
- P. Torres, A. Torelló, J. Bafaluy, J. Camacho, X. Cartoixà and F. X. Alvarez, Phys. Rev. B, 2017, 95, 165407 CrossRef.
- S. Tamura, Phys. Rev. B: Condens. Matter Mater. Phys., 1983, 27, 858–866 CrossRef CAS.
- H. Yi, S. J. Gilbert, A. Lipatov, A. Sinitskii, J. Avila, J. Abourahma, T. Komesu, M. C. Asensio and P. A. Dowben, J. Phys.: Condens. Matter, 2020, 32, 29LT01 CrossRef CAS.
- H. Lee, Thermoelectric: Design and Materials, 2017 Search PubMed.
- Z. M. Gibbs, F. Ricci, G. Li, H. Zhu, K. Persson, G. Ceder, G. Hautier, A. Jain and G. J. Snyder, npj Comput. Mater., 2017, 3, 1–7 CrossRef CAS.
- G. Chester and A. Thellung, Proc. Phys. Soc., London, 1961, 77, 1005 CrossRef CAS.
Footnote |
| † Electronic supplementary information (ESI) available. See DOI: 10.1039/d0na00518e |
| This journal is © The Royal Society of Chemistry 2020 |

