
 Open Access Article
 This Open Access Article is licensed under a Creative Commons Attribution-Non Commercial 3.0 Unported Licence
Determining the morphology and concentration of core–shell Au/Ag nanoparticles†
Jieli
Lyu
 a,
Valérie
Geertsen
b,
Cyrille
Hamon
*a and
Doru
Constantin
*a
a,
Valérie
Geertsen
b,
Cyrille
Hamon
*a and
Doru
Constantin
*a
aUniversité Paris-Saclay, CNRS, Laboratoire de Physique des Solides, 91405 Orsay, France. E-mail: cyrille.hamon@universite-paris-saclay.fr; doru.constantin@universite-paris-saclay.fr
bUniversité Paris-Saclay, CEA, CNRS, NIMBE, 91190 Gif-sur-Yvette, France
First published on 2nd September 2020
Abstract
Accurately measuring the shape, structure and concentration of nanoparticles (NPs) is a crucial step towards understanding their formation and a prerequisite for any applications. While determining these parameters for single-metal NPs is by now rather routine, reliably characterizing bimetallic NPs is still a challenge. Using four complementary techniques: transmission electron microscopy (TEM), light absorbance spectroscopy (AS), small-angle X-ray scattering (SAXS) and inductively coupled plasma mass spectrometry (ICP-MS) we study bimetallic nanoparticles obtained by growing a silver shell on top of a gold seed. The initial quasi-spherical objects become faceted and grow into a rounded cube as the molar silver-to-gold ratio K increases. The shape evolution is well described by SAXS and TEM. The shell thickness, overall size polydispersity and number particle concentration obtained by the various methods are in good agreement, validating the use of non-invasive in situ techniques such as AS and SAXS for the study of bimetallic NPs.
1 Introduction
Synthesizing nanoparticles with carefully chosen properties (optical, magnetic, catalytical etc.) is one of the main goals of materials science. These properties depend on the shape and composition of the particles, and measuring these parameters accurately is an essential prerequisite to developing a reliable formulation process.Noble metal nanoparticles are particularly interesting due to their optical properties, related to the presence of plasmon resonances (very sensitive to the particle shape) and due to the richness of synthesis methods that can yield a large variety of shapes and sizes, with very good yield and relatively low polydispersity. Bimetallic particles consisting of a gold core covered with a silver shell offer further control over the optical properties and exhibit lower dissipation in the visible range.1–5
Before any application, it is indispensable to determine the particle concentration, as well as their average morphology (size, shape, rounding) and their distribution. Ideally, these parameters should be determined by non-invasive techniques, directly applicable in the reaction medium and time-resolved. The typical example is UV-vis-IR absorbance spectroscopy (AS),‡ but several groups have shown that small-angle X-ray scattering (SAXS) can also provide valuable information.6–10 Although the presence of two constituents complicates the application of these methods to bimetallic objects, recent studies point the way towards a deeper understanding of their structure and evolution.5,11 An important source of progress over the last decade has been the improvement in synthesis protocols, yielding particle populations with better size and shape monodispersity, and allowing the extraction of more information using the various characterization techniques. In turn, this information can be used to further improve the synthesis protocols.
Our goal in this paper is to apply AS and SAXS to a series of samples where the particle morphology is modified systematically by changing a reaction parameter and to validate the information by cross-checking the results and by comparing them with two other methods: transmission electron microscopy (TEM) and inductively coupled plasma mass spectrometry (ICP-MS) which, require extracting the particles from their environment. More specifically, we synthesize core–shell Au/Ag nanoparticles by growing a silver shell on top of a spherical gold seed, for various values of the molar ratio K between silver precursor and gold. At low K, the shell is quasi-spherical (probably rhombicuboctahedral11), while at higher K it becomes cubic. We measure the size and shape of the objects by SAXS and TEM and their concentration by SAXS, AS and ICP-MS and compare the results of the various techniques.
2 Materials and methods
2.1 Particle synthesis
• Seeds were prepared by mixing 50 μL of a 0.025 M HAuCl4 solution with 4.7 mL of a 0.1 M CTAB solution in a 20 mL scintillation vial at 30 °C; 300 μL of a freshly prepared 0.01 M NaBH4 solution was then injected under vigorous stirring. The mixture was left undisturbed at 30 °C for at least 1 h.
• S1 spheres: in a 20 mL scintillation vial, a growth solution was prepared by mixing 120 μL of a 0.025 M HAuCl4 solution with 10.5 mL of a 0.094 M CTAC solution. Then, 4.5 mL of AA at 0.1 M and 300 μL of the seed solution were added in sequence under vigorous stirring. The mixture was left undisturbed at room temperature for at least 1 h.
• S2 spheres: in a 200 mL Erlenmeyer flask, a growth solution was prepared by mixing 1200 μL of a 0.025 M HAuCl4 solution with 100.5 mL of a 0.094 M CTAC solution. Then, 40.5 mL of AA at 0.1 M and 300 μL of S1 solution was added in sequence under vigorous stirring. The mixture was left undisturbed at room temperature for at least 1 h. The AuSph were centrifuged and redispersed in 10 mM CTAC before further use.
2.2 Particle geometry
The particles are described as gold spheres with radius R centered within silver shells of thickness t, and hence with outer radius R + t (sphere-in-sphere model), or within cubes of size a (sphere-in-cube model). In the latter situation we define the thickness t = a/2 − R. We denote by the molar Ag/Au ratio for the individual particles. The corresponding volume ratio is given by fK, with
  . If K is known, t is given by:
| t = R[(1 + fK)1/3 − 1] | (1a) |
| t = R[(1 + fK)1/3(π/6)1/3 − 1], for fK > (6/π − 1) | (1b) |
2.3 Transmission electron microscopy
The solutions were concentrated by slow centrifugation to a final Au0 concentration of 0.75 mM in 0.55 mM CTAB. 10 μL of this solution was then dropped on a carbon-coated grid and dried at 70 °C. Transmission electron microscopy (TEM) images were obtained with a JEOL 1400 microscope, operating at an acceleration voltage of 120 kV. To extract the particle size, we analyzed the images using the ImageAnalyzeParticles operation in Igor Pro 7.0. The individual particles were modeled as ellipses with half-axes a and b and their equivalent radius was computed as . Due to the low relative contrast between gold and silver only the outer boundary of the particles was detected, so R corresponds to the radius of the complete object. The quadraticity parameter Q (area ratio of circumscribed square to particle) was extracted using the minboundrect function12 implemented in MATLAB.
2.4 Small-angle X-ray scattering
The SAXS measurements were performed on the SWING beamline of the SOLEIL synchrotron (Saint-Aubin, France). The sample-to-detector distance was 6.5 m and the beam energy E = 12 keV, covering a scattering vector range 0.0015 < q < 0.2 Å−1. The beam size was approximately 500 × 200 μm2 (H × V).The solutions were filled into round glass capillaries, with an outer diameter of 1.4 mm and 10 micron-thick walls, purchased from WJM-Glas (Berlin, Germany), placed vertically in a motorized holder. The capillaries were filled with the sample solution and sealed at the top using a glue gun to prevent evaporation. All measurements were performed at room temperature (22 °C).
The scattered signal was recorded by an Eiger 4 M detector (Dectris Ltd., Switzerland) with pixel size 75 μm. Preliminary data treatment (angular averaging and normalization) was done using the software Foxtrot developed at the beamline and yielded the intensity as a function of the scattering vector I(q) in absolute units. Subsequent data modeling was done in Igor Pro 7.0 using functions available in the NCNR SANS package13 (SchulzSpheres used to model the initial Au particles, before Ag addition and PolyCoreShellRatio used for the sphere-in-sphere model) and a model developed in-house for the sphere in cube (see the ESI for the details†). The latter is a simplified version of the algorithm presented in ref. 14.
2.5 UV-vis absorbance spectroscopy
The solutions were shaken and pipetted into polystyrene cuvettes with 1 cm optical path. We used a Cary 5000 spectrometer (Agilent) to measure the extinction spectrum between 200 and 1200 nm, in a dual-beam configuration with a water-filled cuvette in the reference path.2.6 BEM simulations
Simulated extinction spectra were calculated by the boundary element method (BEM), using the MNPBEM toolbox developed in the MATLAB environment.15 This numerical technique allows a very detailed description of the particle shape and the use of the full Maxwell equations, including retardation effects. It is however very demanding in computation time (tens of minutes for a given particle) and thus cannot be included in a fitting routine.2.7 Analytical model for the extinction
Rigorous analytical solutions exist for homogeneous and core–shell spherical particles in the framework of Mie theory.16,17 While computationally tractable, the full Mie theory is not always necessary for objects much smaller than the wavelength. Furthermore, using the complete formalism can sometimes obscure the role of the various parameters in the evolution of the spectra.We therefore start from the Rayleigh (or quasistatic) approximation, corresponding to the first term of Mie theory. This model yields very simple formulas for the extinction spectrum of homogeneous and core–shell spherical particles.18 For larger particle sizes, the deviation from the Rayleigh regime is accounted for in the long-wavelength approximation (LWA),19 as applied to a core–shell object by Chung et al.20,21 We validate the model by comparing it to BEM simulations. The full calculation details and the comparison to the BEM spectra are presented in the ESI.†
2.8 Inductively coupled plasma mass spectrometry
Inductively coupled plasma mass spectrometry (ICP-MS) yields the elemental concentration in solution, with very few assumptions. It is therefore a very robust technique, but it provides no information as to the size and shape of the objects. The gold and silver concentrations were determined using an iCAP Q Thermo Electron instrument after external calibration by dilution of multi-element standard solutions (SPEX, MS3 for gold and MS2 for silver). Measurements were repeated six times before averaging. All dilutions (samples and standards) were prepared by weight. Gold determination was performed at mass 198 in hydrochloric media. Silver was measured at mass 107 and 109 and before averaging. The silver determination is performed in nitric media. Sample dilutions were performed as follows: samples were heated in a bath at a temperature of 30 °C to avoid CTAB solidification. A 10 μL aliquot of sample was added to a polypropylene vial. On the aliquot was poured 10 μL of aqua regia saturated with NH4Cl to dissolve both gold and silver.22 Sample dilution was then realized by addition of diluted hydrochloric or nitric acid. Both hydrochloric acid and nitric acid were purified previously by distillation. The same protocol was repeated for standards except that stock standard solutions were not heated.3 Particle size and shape
3.1 Transmission electron microscopy
We performed TEM measurements on nine samples, with K = 0, 0.4, 0.7, 0.9, 1.2, 1.4, 2, 4, and 8. Some representative image selections are shown in Fig. 1. More images are shown in the ESI.†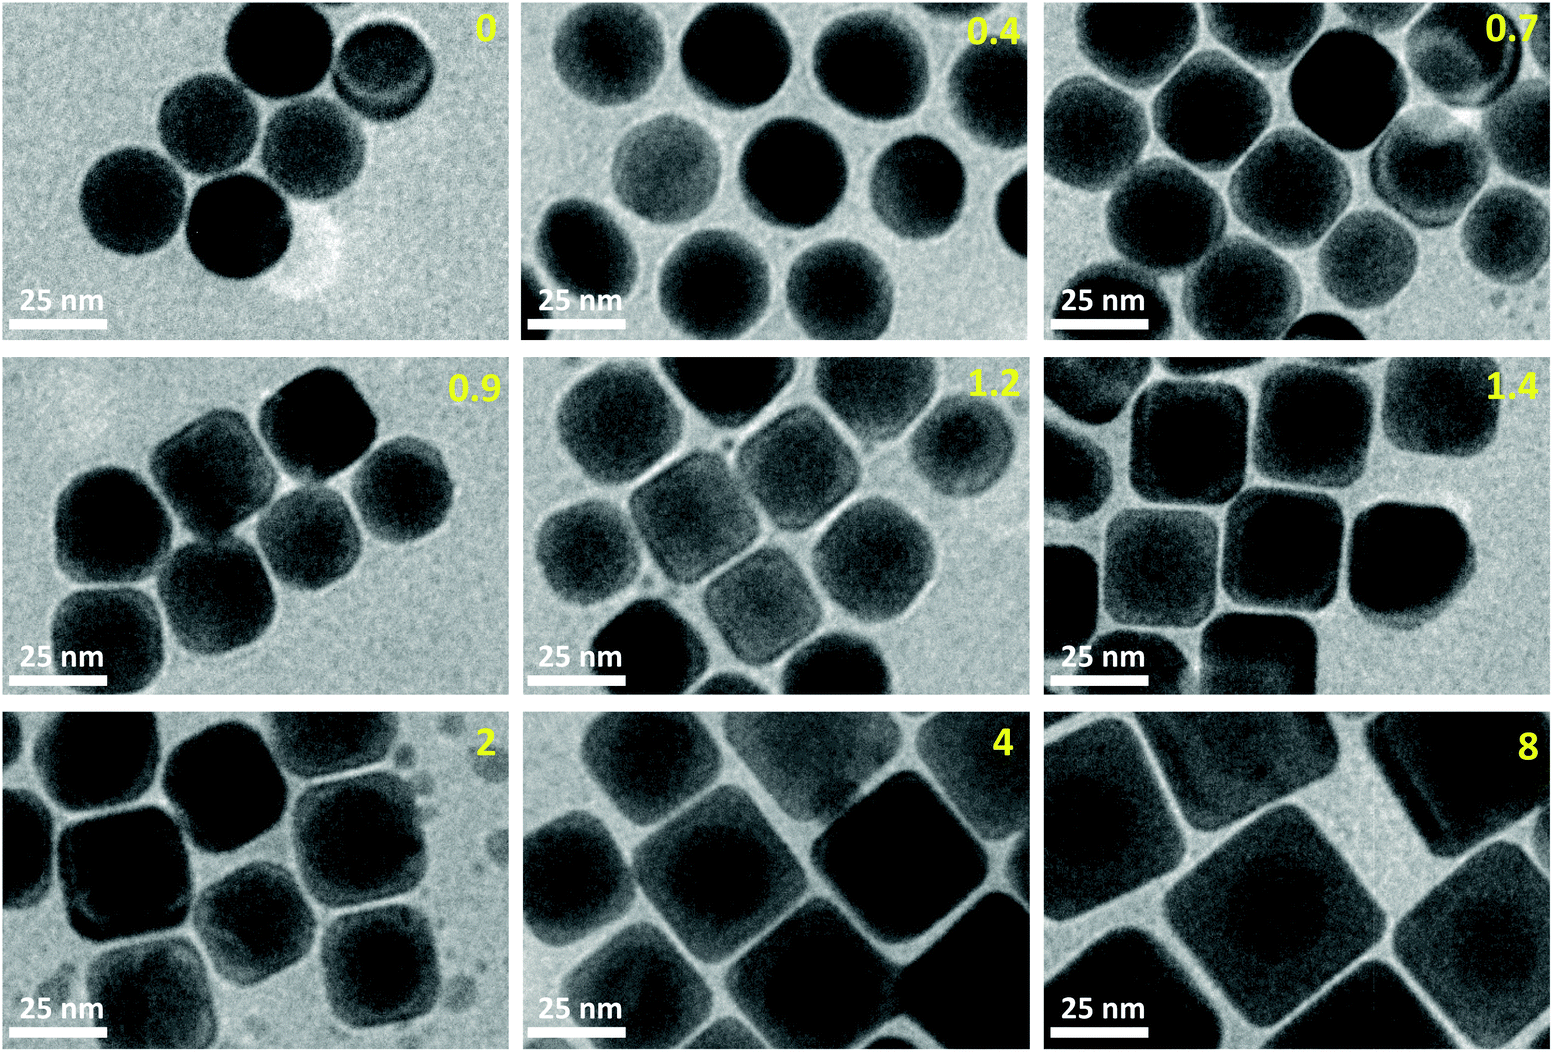 | ||
| Fig. 1 TEM images for different values of the molar ratio K. | ||
The size of the gold core was extracted from the initial population, before the addition of silver (molar ratio K = 0), yielding a radius R0 = 13.0 nm. The shell thickness for each K > 0 was obtained by subtracting R0 from the mean equivalent particle radius 〈RK〉 at that given K. The polydispersity is computed as the standard deviation of the radius distribution divided by its mean: pK = σK/〈RK〉. These parameters are compared to the SAXS data (see below).
The shape of the particles can be assessed using the quadraticity Q, defined as the ratio between the area of the smallest circumscribed square and that of the particle projection. This parameter is 1 for a perfect square, 4/π for a perfect circle and can be even larger for anisotropic or irregular shapes.
The mean quadraticity 〈Q〉 is shown in Fig. 2 (left panel): at first glance, it seems to decrease linearly with K, as shown by the fit. However, the large standard deviations call for a more refined analysis. To this end, we plot in the same figure (right panel) the histograms of Q for each K value. We can separate three regimes, identified by line color: at low K ≤ 0.7 (black line), the distributions are monomodal, relatively narrow and centered around the 4/π value corresponding to a perfect circle. Almost all particles are spherical. At intermediate K (blue line) the distributions are wide and possibly bimodal, with one spherical subpopulation and one with Q ≃ 1.15. At high K ≥ 2.0 (red line) the distributions are once again monomodal, with a decreasing mode but with a substantial contribution at higher Q. This contribution is almost absent for K = 8.0, as shown by the reduced std. dev. The cubes become predominant at K = 2.0, so we can locate the shape transition between 1.4 and 2.0.
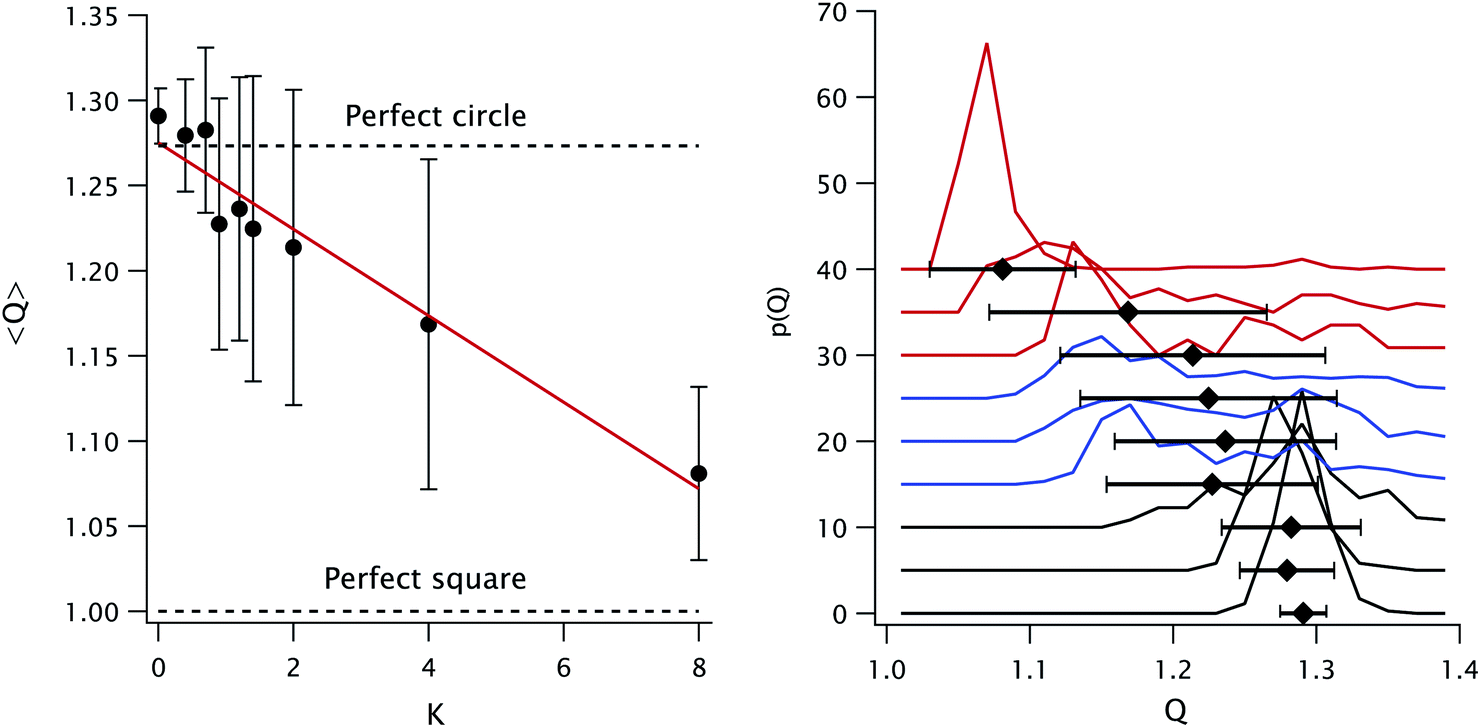 | ||
| Fig. 2 Quadraticity parameter Q. Left: average value 〈Q〉 as a function of K (mean and standard deviation, solid dots and error bars) with linear fit (solid line). The limiting values for a perfect circle and square are shown as dashed lines. Right: histograms of Q for each K value (shifted vertically for clarity). The mean and std. dev. from the left panel are shown under each curve. Colors (black, blue and red) distinguish three types of curves (see text). | ||
3.2 Small-angle X-ray scattering
We recorded the azimuthally averaged scattered intensity I(q) as a function of the scattering vector q for all samples in dilute solutions. The data is shown in Fig. 3, along with fits using both sphere-in-sphere and sphere-in-cube models (eqn (1a) and (1b), respectively). For coherence, the latter model was only used for molar Ag/Au ratios above Kmin ≃ 0.903; attempts to fit curves at lower ratios yield unphysical results (cube sizes a < 2R). We fixed throughout the core radius R = 12.4 nm, value obtained by fitting the data for K = 0.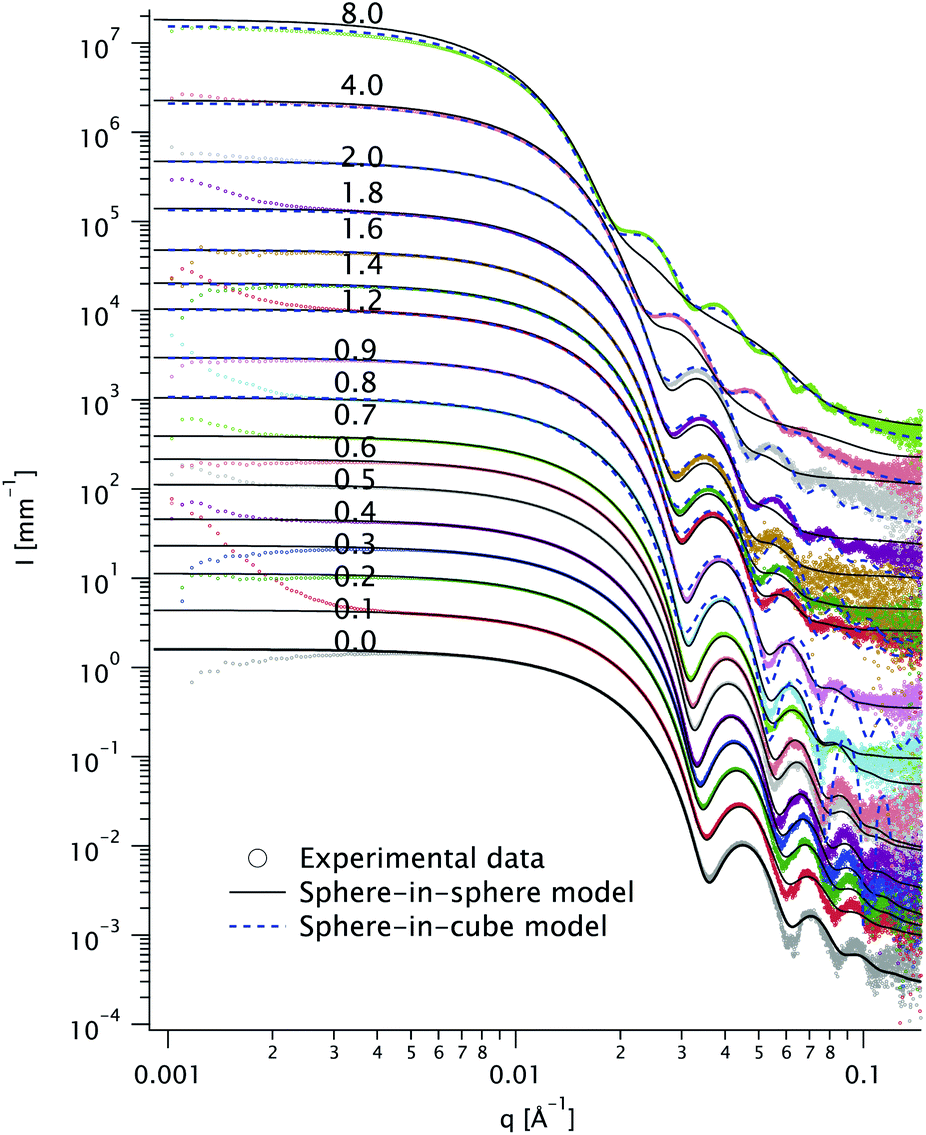 | ||
| Fig. 3 Scattered intensity I as a function of the scattering vector q for all solutions (dots, various colors). The spectra were shifted vertically for clarity. The molar Ag/Au ratio K is indicated above each curve. Fits with the sphere-in-sphere model (solid lines) and with the sphere-in-cube model (dashed lines) are displayed for each curve. | ||
The goodness-of-fit function χ2 divided by the number of experimental points Npts is shown in Fig. 4 for all the fits displayed in Fig. 3. The fit quality is better for the sphere-in-sphere model below K = 1.4 and for the sphere-in-cube model above K = 2, in agreement with the visual inspection of Fig. 3. The oscillations between 0.03 and 0.1 Å−1 are very revealing: they are deep for spheres and shallow for cubes and are very well described by the corresponding model at low and high K, respectively. In the intermediate range (0.9 ≤ K ≤ 1.6) both models are unsatisfactory due to the shape polydispersity illustrated in Fig. 2.
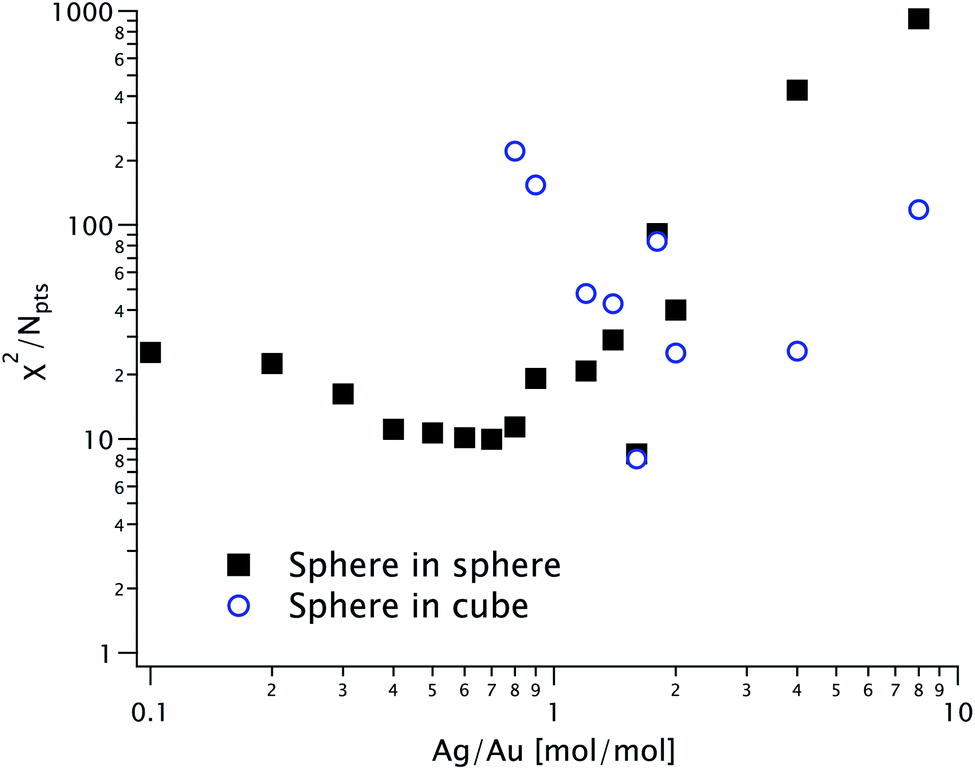 | ||
| Fig. 4 Goodness-of-fit function for the SAXS models in Fig. 3, shown as solid squares (for the sphere-in-sphere model) and as open circles (for the sphere-in-cube model) as a function of the Ag/Au ratio K. | ||
In Fig. 5 we plot the thickness t extracted from the fits in Fig. 3 (solid squares for sphere-in-sphere and open dots for sphere-in-cube) and the TEM values (diamonds). We also plot the thickness values predicted by eqn (1a) and (1b) (solid and dashed line, respectively) assuming that the Ag/Au ratio for each particle is the experimental one K in the reaction medium (i.e. that all the Ag ions are used to form shells and that all particles have the same morphology).
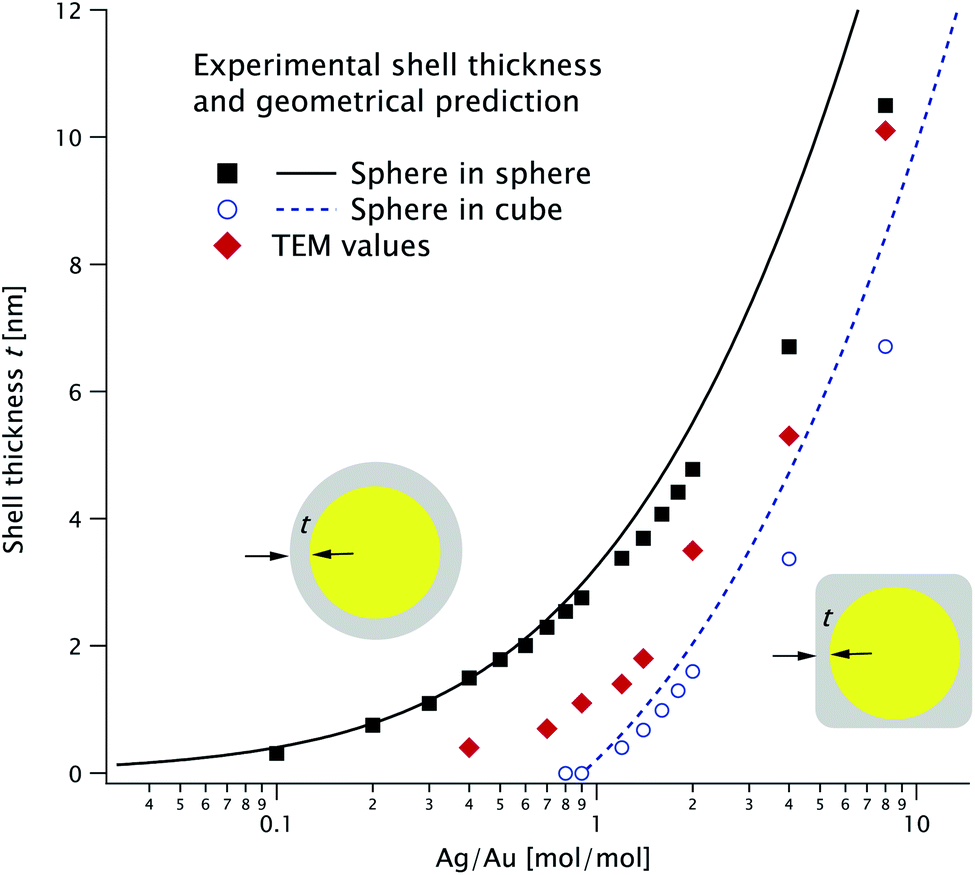 | ||
| Fig. 5 Shell thickness extracted from the fits in Fig. 3 for the two models and corresponding geometrical predictions (see the text for more details). The TEM values are shown as red diamonds. | ||
Both SAXS models include a homothetical polydispersity, plotted in Fig. 6, alongside the TEM values. The latter are in good agreement with the sphere-in-sphere model up to K = 2 and with the sphere-in-cube model above this value.
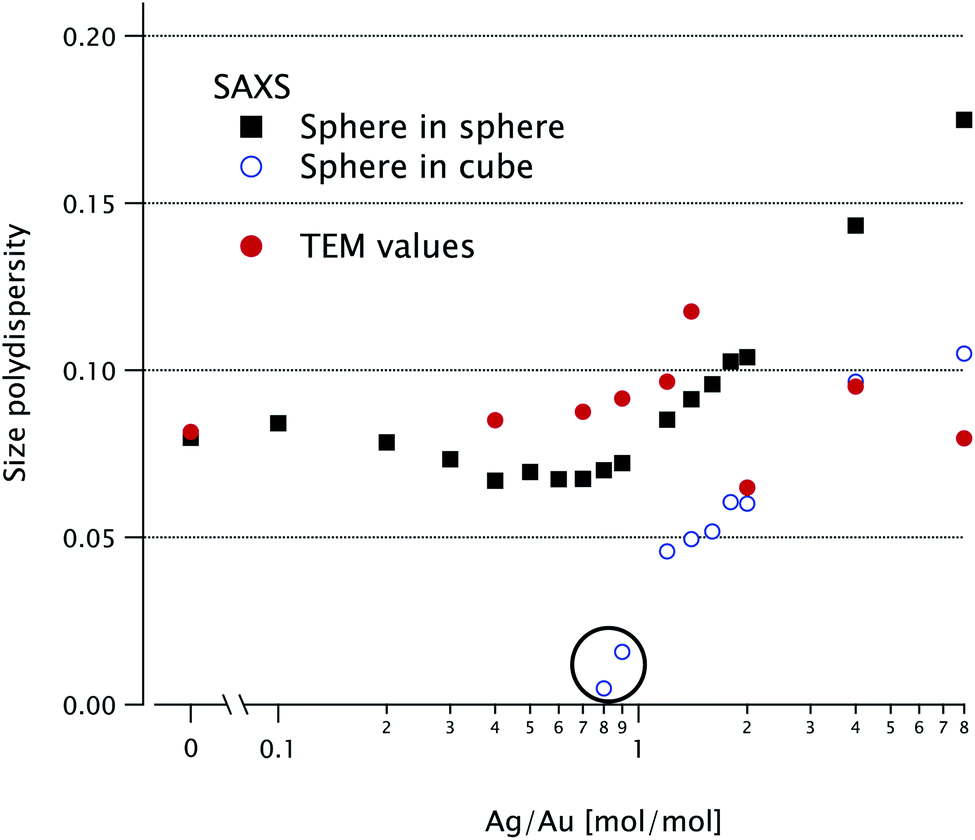 | ||
| Fig. 6 Relative polydispersity extracted from the SAXS fits in Fig. 3 for the two models (solid squares for sphere-in-sphere and open dots for sphere-in-cube). The circled points with abnormally low values (for K = 0.8 and 0.9) have very poor fit quality (see Fig. 4). Relative polydispersity extracted from the TEM data (solid dots). | ||
4 Silver-to-gold ratio
Using ICP-MS we can determine the Ag/Au ratio within the particles; we plot it against their ratio in solution, K, in Fig. 7. The diagonal line is the expected value if the reaction proceeded to completion and the two parameters are equal. The same line corresponds to the solid/dashed curve in Fig. 5 for the spherical/cubical shell model. The experimental values follow K with considerable variability: their ratio fluctuates between 0.74 and 1.74.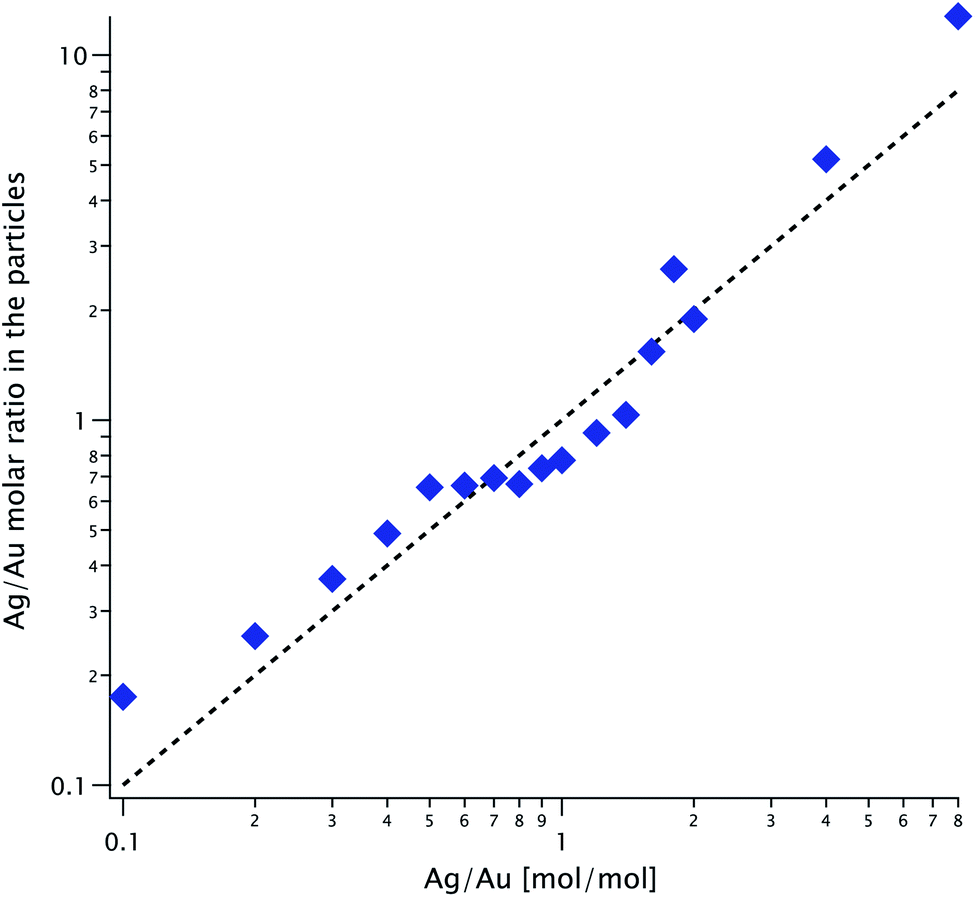 | ||
| Fig. 7 The Ag/Au ratio in the particles, measured by ICP-MS, versus the same ratio in solution, K (diamonds). The dashed line marks the expected values if all the silver is deposited onto the gold cores. | ||
5 Particle concentration
The concentration of particles in solution is of course a very important parameter; it can be obtained from full-curve fitting of the AS23 or SAXS24 curves or, for homogeneous gold nanoparticles, in an easier manner from the near-UV extinction25,26 or from the integrated invariant, respectively.27 ICP-MS gives access to the molar concentration of Au and Ag separately (in different measurements). Each of these techniques uses a completely different principle. A full analysis of the SAXS data gives access to both the size and the number density of the particles, while the other techniques only yield their product, i.e. the volume concentration. For bimetallic objects, no simple method exists, either in SAXS or AS; it is therefore necessary to model the entire experimental curve.Since the scattered intensity I(q) is measured in absolute units, it is directly proportional to the number density n. In Fig. 8 we plot (as solid squares) this parameter as a function of the molar ratio K for the sphere-in-sphere model (the results of the sphere-in-cube model are within 9% of these values).
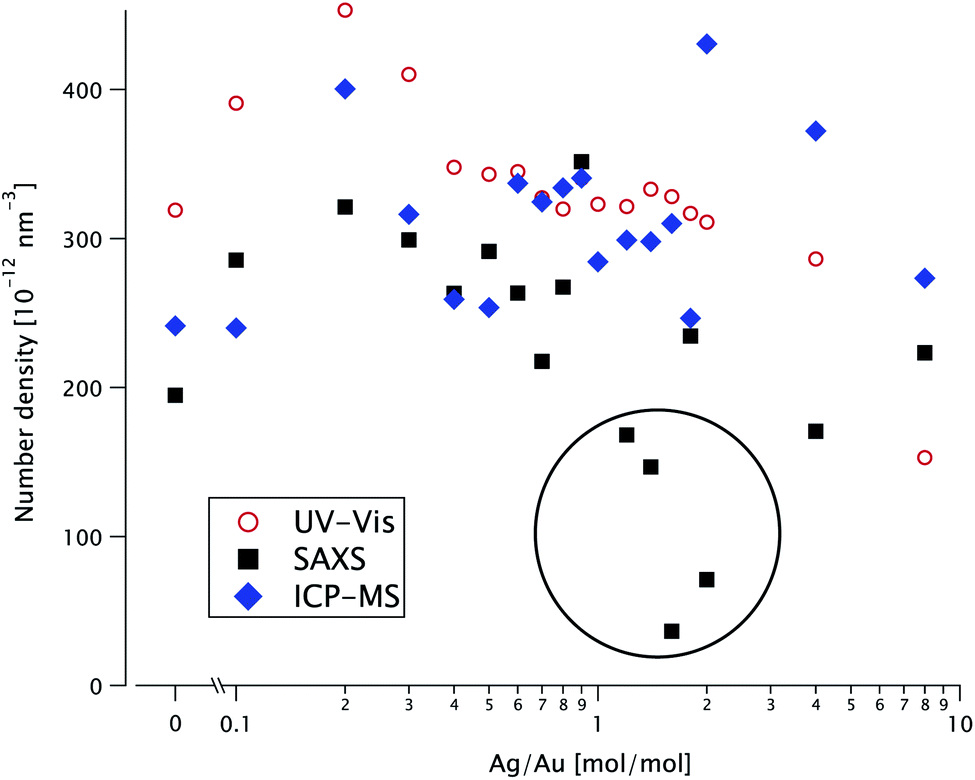 | ||
| Fig. 8 Number particle density n as a function of the Ag/Au ratio K, extracted from fitting the SAXS data in Fig. 3 (solid black squares), from the UV-vis absorbance data (open red dots) and from ICP-MS (blue diamonds). Anomalously low SAXS values are circled. | ||
The number density also appears in the model for the extinction spectra. We fit the experimental data with the sphere-in-sphere model, where only n and a constant background are adjustable parameters: the core radius R and the shell thickness t are fixed at the values obtained from the SAXS data using the same model. The results are plotted in Fig. 8 as open dots.
From the mass gold concentration cAu measured via ICP-MS we determine 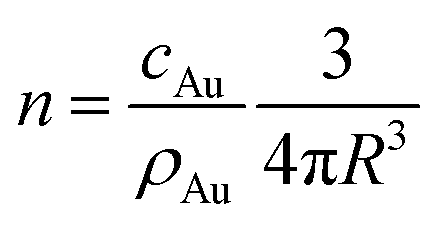 (where R = 12.4 nm is the radius determined by SAXS) and plot it in Fig. 8 as diamonds.
The SAXS values for n are more scattered than the AS ones and some points (circled in Fig. 8) are very low. The ICP-MS results are close to the SAXS ones at low K ≤ 1 and above the AS at K ≥ 2.
6 Conclusions
The particle populations have excellent monodispersity p (between 5 and 10%) as measured by SAXS and TEM (see Fig. 6) and confirmed by the agreement between the calculated and predicted shell thickness (see Fig. 5). Analysis of the TEM images (see Fig. 2) shows a transition between quasi-spherical and cubic shapes between K = 1.4 and 2, while the quality of the SAXS fits finds the transition at about K = 2: the two techniques are in very good agreement!The values for the particle concentration n obtained by three techniques are in good agreement (within 40% of their average), except for some low-value SAXS points. The systematic difference between the techniques is lower than the spread of values for each technique, highlighting the importance of careful sampling protocols: sample agitation to ensure homogeneity and avoid the appearance of concentration gradients, temperature control to prevent surfactant crystallization, weighing the aliquots rather than relying on pipetting volumes (which are not always accurate for surfactant solutions).
Among the four methods used, SAXS yields the most information about the particles: the size, polydispersity, shape and concentration are accurately determined, as shown by very good agreement with the other techniques. This result validates the use of SAXS for studying complex (bimetallic and aspherical) nano-objects, statically or during their growth. However, the particles must be reasonably monodisperse in order to take full advantage of this technique. Of course, scattering methods only yield indirect information and imaging techniques remain essential for identifying the particle shapes and choosing the appropriate model, so TEM should always be used as a complement.
Conflicts of interest
There are no conflicts to declare.Acknowledgements
J. L. acknowledges financial support by the China Scholarship Council (CSC). The SOLEIL synchrotron is acknowledged for the provision of beamtime and Thomas Bizien for his support. We thank Claire Goldmann for the preparation of some nanoparticle batches and for continuous experimental support.Notes and references
- Y. Ma, W. Li, E. C. Cho, Z. Li, T. Yu, J. Zeng, Z. Xie and Y. Xia, ACS Nano, 2010, 4, 6725–6734 CrossRef.
- Y. Okuno, K. Nishioka, A. Kiya, N. Nakashima, A. Ishibashi and Y. Niidome, Nanoscale, 2010, 2, 1489–1493 RSC.
- K. Park, L. F. Drummy and R. A. Vaia, J. Mater. Chem., 2011, 21, 15608 RSC.
- S. Gómez-Graña, B. Goris, T. Altantzis, C. Fernández-López, E. Carbó-Argibay, A. Guerrero-Martínez, N. Almora-Barrios, N. López, I. Pastoriza-Santos, J. Pérez-Juste, S. Bals, G. Van Tendeloo and L. M. Liz-Marzán, J. Phys. Chem. Lett., 2013, 4, 2209–2216 CrossRef.
- M. Tebbe, C. Kuttner, M. Mayer, M. Maennel, N. Pazos-Perez, T. A. König and A. Fery, J. Phys. Chem. C, 2015, 119, 9513–9523 CrossRef.
- S. Alayoglu, P. Zavalij, B. Eichhorn, Q. Wang, A. I. Frenkel and P. Chupas, ACS Nano, 2009, 3, 3127–3137 CrossRef.
- U. Bentrup, Chem. Soc. Rev., 2010, 39, 4718 RSC.
- L. Sciortino, F. Giannici, A. Martorana, A. M. Ruggirello, V. T. Liveri, G. Portale, M. P. Casaletto and A. Longo, J. Phys. Chem. C, 2011, 115, 6360–6366 CrossRef.
- A. Lehoux, L. Ramos, P. Beaunier, D. B. Uribe, P. Dieudonné, F. Audonnet, A. Etcheberry, M. José-Yacaman and H. Remita, Adv. Funct. Mater., 2012, 22, 4900–4908 CrossRef.
- P. R. A. F. Garcia, O. Prymak, V. Grasmik, K. Pappert, W. Wlysses, L. Otubo, M. Epple and C. L. P. Oliveira, Nanoscale Adv., 2020, 2, 225–238 RSC.
- A. M. Steiner, M. Mayer, D. Schletz, D. Wolf, P. Formanek, R. Hübner, M. Dulle, S. Förster, T. A. Koenig and A. Fery, Chem. Mater., 2019, 31(8), 2822–2827 CrossRef CAS.
- J. D'Errico, A Suite of Minimal Bounding Objects, https://fr.mathworks.com/matlabcentral/fileexchange/34767-a-suite-of-minimal-bounding-objects, accessed 29/06/2020 Search PubMed.
- S. R. Kline, J. Appl. Crystallogr., 2006, 39, 895–900 CrossRef CAS.
- C. Hamon, C. Goldmann and D. Constantin, Nanoscale, 2018, 10, 18362–18369 RSC.
- U. Hohenester and A. Trügler, Comput. Phys. Commun., 2012, 183, 370–381 CrossRef CAS.
- P. K. Jain, K. S. Lee, I. H. El-Sayed and M. A. El-Sayed, J. Phys. Chem. B, 2006, 110, 7238–7248 CrossRef CAS.
- J. Olson, S. Dominguez-Medina, A. Hoggard, L.-Y. Wang, W.-S. Chang and S. Link, Chem. Soc. Rev., 2015, 44, 40–57 RSC.
- C. F. Bohren and D. R. Huffman, Absorption and Scattering of Light by Small Particles, Wiley, New York, 1983 Search PubMed.
- M. Meier and A. Wokaun, Opt. Lett., 1983, 8, 581–583 CrossRef CAS.
- H. Y. Chung, P. T. Leung and D. P. Tsai, J. Chem. Phys., 2009, 131, 124122 CrossRef CAS.
- H. Y. Chung, G. Y. Guo, H.-P. Chiang, D. P. Tsai and P. T. Leung, Phys. Rev. B: Condens. Matter Mater. Phys., 2010, 82, 165440 CrossRef.
- W. B. Pollard, J. Chem. Soc., Trans., 1920, 117, 99–103 RSC.
- V. Amendola and M. Meneghetti, J. Phys. Chem. C, 2009, 113, 4277–4285 CrossRef CAS.
- K. Slyusarenko, B. Abécassis, P. Davidson and D. Constantin, Nanoscale, 2014, 6, 13527–13534 RSC.
- W. Haiss, N. T. K. Thanh, J. Aveyard and D. G. Fernig, Anal. Chem., 2007, 79, 4215–4221 CrossRef CAS.
- T. Hendel, M. Wuithschick, F. Kettemann, A. Birnbaum, K. Rademann and J. Polte, Anal. Chem., 2014, 86, 11115–11124 CrossRef CAS.
- B. Abécassis, F. Testard, O. Spalla and P. Barboux, Nano Lett., 2007, 7, 1723–1727 CrossRef.
Footnotes |
| † Electronic supplementary information (ESI) available: TEM images and associated histograms of particle sizes, calculations of the SAXS form factor, calculations of the UV-vis extinction spectra of core–shell objects in the LWA approximation and BEM simulations of the UV-vis extinction spectra. See DOI: 10.1039/d0na00629g |
| ‡ For instance, the Au0 concentration can be determined from the absorbance of gold NPs at 450 nm, independently of their morphology. To date, no such convenient procedure exists for bimetallic NPs. |
| This journal is © The Royal Society of Chemistry 2020 |