 Open Access Article
Molybdenum oxynitride nanoparticles on nitrogen-doped CNT architectures for the oxygen evolution reaction†
Sucheng
Ji
a,
Wushuang
Chen
a,
Zhixin
Zhao
a,
Xu
Yu
 *a and
Ho Seok
Park
 *b
*b
aSchool of Chemistry and Chemical Engineering Yangzhou University, 88 South University Ave., Yangzhou, 225009, China. E-mail: yxypz15@yzu.edu.cn
bDepartment of Chemical Engineering, College of Engineering, Sungkyunkwan University, 2066, Seobu-ro, Jangan-gu, Suwon-si, Gyeonggi-do 440-746, Republic of Korea. E-mail: phs0727@skku.edu
First published on 6th November 2020
Abstract
Transition metal-based electrocatalysts are considered the potential alternative to noble metal-based ones owing to their comparable electrocatalytic properties, durability, and low cost for the oxygen evolution reaction (OER). Herein, we report the partial nitridation of molybdenum oxide nanoparticles anchored on nitrogen-doped carbon nanotube (Mo–N-CNT) architectures for a highly active OER electrocatalyst. The molybdenum oxynitride nanoparticles are uniformly distributed on the surface of hierarchical N-CNT architectures, where nitrogen heteroatoms are incorporated through the thermal decomposition of carbon nitride. The modified surface chemistry can boost the electrocatalytic activity of Mo–N-CNT to show improved electrochemical behaviours for OER operation. The Mo–N-CNT achieves a current density of 10 mA cm−2 with an overpotential of 344 mV, Tafel slope of 64 mV dec−1, and current density retention of 79% during the oxidation in an alkaline electrolyte for 80 h. The enhanced electrocatalytic performance of Mo–N-CNT is attributed to the hierarchical N-CNT structure and nitridation of Mo oxides.
Introduction
Highly efficient energy conversion and storage technologies are needed to resolve environmental issues related to fossil fuels and to develop a sustainable society with renewable energy.1–5 The oxygen evolution reaction (OER) is regarded as a vital electrochemical process for application in renewable energy systems such as water splitting, fuel cells, and metal–air batteries.6–10 Oxygen gas is produced through the complicated electron transfer pathway of the OER process, but the efficiency is still low due to the sluggish anodic reaction.11 To overcome this limitation, highly efficient catalytic performances of anode materials with the lowest overpotential need to be achieved.To date, noble metal-based electrocatalysts have been exploited to be the most efficient candidate for the OER, but their high cost and unsatisfactory cycling stability during long-term operation are the technical bottlenecks for their practical applications.12,13 Transition metal-based electrocatalysts are considered the potential alternative to noble metal-based ones owing to their comparable electrocatalytic properties, durability, and low cost. Recently, the non-oxide form of transition metals and hybridization with conductive supports have been investigated to significantly improve electrocatalytic performances for the OER.14–21 In particular, non-oxide molybdenum (Mo)-based electrocatalysts, such as nitrides, sulfides, and phosphides, were developed to achieve high OER catalytic activity as non-oxide ceramics.22–25 The catalytically active sites of Mo-based materials have been localized at the edge sites, while the inactive sites exist on the basal planes, which is associated with the insulating properties of Mo electrocatalysts.26 On the other hand, metallic transition metal nitrides are expected to achieve a high electrocatalytic activity for the OER owing to their high electrical conductivity and intrinsic stability in strong alkaline and acid electrolytes.27–29 Therefore, the incorporation of molybdenum nitride (MoN) into molybdenum oxides can improve their electrocatalytic activity and cycling stability.
Nitrogen (N) atoms that are incorporated into the surface of carbon nanomaterials can coordinate with the metal ion at the lone electron-pair sites in ligands.6 Graphitic carbon nitride (g-C3N4) can be used as the precursor of N heteroatoms and decomposed into atomic N for the incorporation into carbon nanomaterials. Thus, N-incorporated carbon nanotubes (CNTs) can be used as the conductive substrate to coordinate with metal ions, improving the electrical conductivity and the utilization of active sites. In particular, the hierarchical structure of N-doped carbons provides fast ion diffusion pathways and a large accessible surface area.30,31
Herein, we report molybdenum oxynitride nanoparticles deposited on hierarchical N-doped CNT architectures (Mo–N-CNT) as a highly efficient OER electrocatalyst. The nitridation of Mo oxides and N doping into the CNT architecture are accomplished via the thermal decomposition of carbon nitride, thereby improving the electrocatalytic activity as demonstrated by the low overpotential, small Tafel slope, and high specific current. The long-term durability of Mo–N-CNT in KOH solution for 80 h is also achieved due to the strong interaction between Mo oxynitride and N-doped CNTs.
Results and discussion
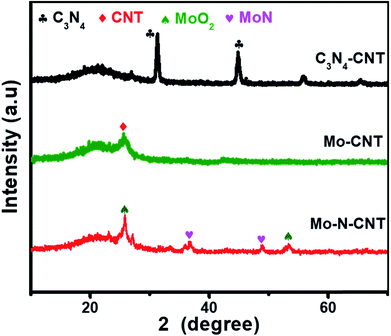
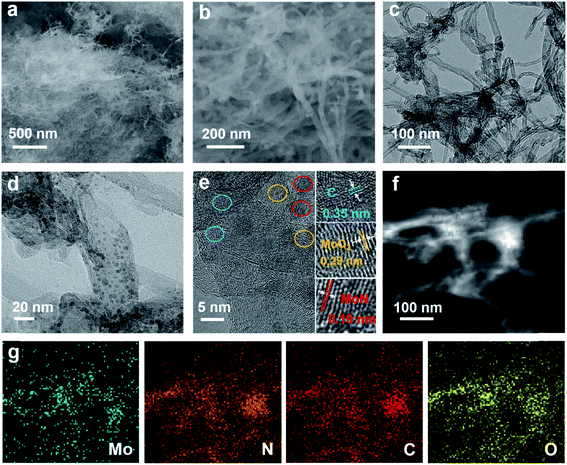
The hierarchical Mo–N-CNT electrocatalyst was prepared by combining simple polymer gelation and hydrothermal and thermal treatment processes. During the formation of C3N4-CNT networks, the homogeneity and optimized pH of the solution are important for achieving the polymeric gel. Subsequently, a mixture of C3N4-CNTs with the Mo precursor was hydrothermally treated and heated at 800 °C to construct the Mo–N-CNT architecture. As shown in Fig. 1 and S1,† the XRD patterns of C3N4-CNT, Mo-CNT and Mo–N-CNT show a very broad peak at 2θ = 21.08° corresponding to the amorphous halo. The intense peak of C3N4-CNT at 2θ = 31.39° was assigned to the (200) plane of C3N4,32 whereas this peak was not observed for Mo–N-CNT due to the thermal decomposition of C3N4 at high temperatures. A clear peak appeared at 25.04° and 25.26° for Mo-CNT and Mo–N-CNT, respectively, which is ascribed to the (002) peak of CNTs. Moreover, the peaks of Mo–N-CNT at 36.2° and 49.0° were assigned to (200) and (202) planes of MoN. The additional peaks at 26.0° and 53.1° represent the existence of Mo-oxide compounds. These results indicate the partial nitridation of Mo-oxide compounds through the thermal decomposition of C3N4.The structure and morphology of Mo–N-CNT were characterized using SEM and TEM, as shown in Fig. 2. The Mo–N-CNT revealed the hierarchical network structure through the crosslinking of the interweaved CNT bundles (Fig. 2a and b), which can expose abundant active sites of Mo oxynitride. As shown in the high-resolution TEM (HR-TEM) images in Fig. 2c and S2,† the inside of N-CNTs was hollow with an average diameter of 13 nm, indicating a tubular structure. Moreover, the N-CNTs were quite curved due to the existence of a turbostratic structure due to the N incorporation. The MoN nanoparticles with a size of 2 to 5 nm were uniformly deposited on the surface of N-CNTs (Fig. 2d and S3†), which is different from Mo–N–O with large size nanoparticles (Fig. S4†). Three types of finger-lattices are observed in Fig. 2e. The interlayer spacings of 0.19 nm and 0.35 nm correspond to the (202) plane of MoN and (002) plane of CNTs, respectively, while the interlayer spacing of 0.29 nm was attributed to the (101) plane of Mo oxide compounds.27,33 These assignments were consistent with the XRD results. The lattices of MoN and Mo oxides are indicative of the deposition of crystalline nanoparticles on the surface of N-CNTs. As shown in the EDX spectra (Fig. S5†), the existence of Mo, N, C and O atoms is observed. The elemental mapping images of Mo, C, N and O elements confirmed the uniform distribution of MoN and Mo oxides on the surface of N-CNTs (Fig. 2f and g).
As shown in Fig. 3, the chemical composition and structure of the Mo–N-CNT catalyst are analyzed by XPS. The full survey spectrum of Mo–N-CNT showed peaks at 284 eV, 398 eV, 530 eV, and 232 eV corresponding to C, N, O and Mo elements (Fig. 3a and Table S1†), respectively. As shown in Fig. 3b, the high-resolution Mo 3d spectrum was deconvoluted into six peaks. The two peaks at 229.2 eV and 232.3 eV are assigned to the Mo–N bond of MoN, the two peaks at 229.7 eV and 233.1 eV to the oxidation state of Mo4+, and the other peaks at 232.7 eV and 236.0 eV to the oxidation state of Mo6+.33 The existence of the Mo–O bond was dominant for Mo–N-CNT, which is further confirmed from the deconvoluted O 1s peak (Fig. S6†). The formation of the Mo–N bond originated from the surface nitridation of Mo oxides during the thermal activation process. As shown in the high resolution spectrum of the N 1s peak in Fig. 3c, four peaks were observed at 397.4, 398.3, 399.2, and 400.1 eV representing the Mo–N, pyridinic–N, pyrrolic–N, and graphitic–N bonds,34 which confirms the successful incorporation of N atoms into Mo oxides and CNTs. The observation of Mo–N peaks in both Mo 3d and N 1s spectra strongly supports the formation of MoN compounds. Based on the the integrated area of the Mo 3d spectra, the ratio of the nitrides to oxides was found to be about 1 to 10, indicating partial nitridation. The formation of C–N and C![[double bond, length as m-dash]](https://www.rsc.org/images/entities/char_e001.gif) N bonds at 284.9 and 286.7 eV was confirmed from the C 1s peak (Fig. 3d), implying the N doping into CNTs.35 This N doping can improve the electrical conductivity and provide catalytically active sites.36–38 Therefore, the formation of Mo–N bonds and the N-containing groups of N-CNTs can improve the electrical conductivity and boost the electrocatalytic activity toward OER operation.36–38
N bonds at 284.9 and 286.7 eV was confirmed from the C 1s peak (Fig. 3d), implying the N doping into CNTs.35 This N doping can improve the electrical conductivity and provide catalytically active sites.36–38 Therefore, the formation of Mo–N bonds and the N-containing groups of N-CNTs can improve the electrical conductivity and boost the electrocatalytic activity toward OER operation.36–38
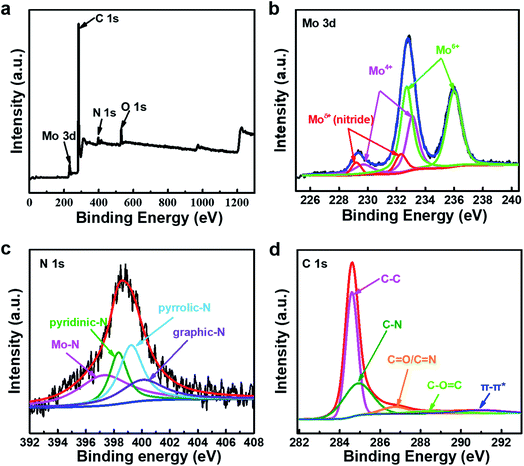 | ||
| Fig. 3 (a) The overview XPS survey spectra of Mo–N-CNT. High-resolution XPS spectra of Mo–N-CNT. (b) Mo 3d, (c) N 1s, and (d) C 1s. | ||
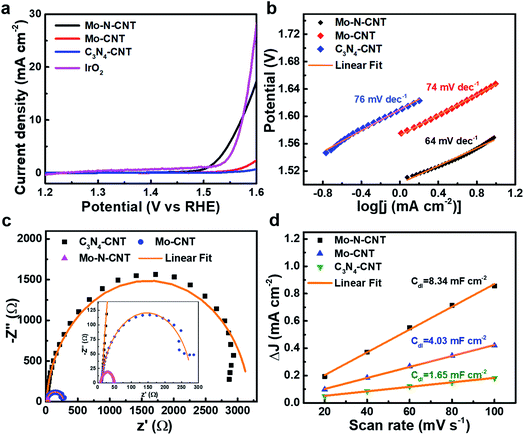
To verify the electrocatalytic performances of the as-prepared C3N4-CNT, Mo-CNT and Mo–N-CNT catalysts toward the OER, the CV curves were measured in a three-electrode configuration in 1 M KOH aqueous electrolyte at 5 mV s−1. The mass loading of the three catalysts was identical for comparative investigation. As shown in the polarization curves in Fig. 4a, the Mo–N-CNT exhibited a smaller overpotential of 344 mV at a current density of 10 mA cm−2 than the 420 mV of Mo-CNT, indicating the faster electrode kinetics for the OER. This excellent OER activity of Mo–N-CNT in the alkaline electrolyte was superior to that of previous metal carbide/nitride-based catalysts for the OER (Table S2†). The overpotential of the Mo–N-CNT catalyst was comparable to that of IrO2, which implies that the Mo–N-CNT achieves a high electrocatalytic activity for OER operation.
The electrode kinetics of Mo–N-CNT during the OER process was investigated by estimating the Tafel slope from the corresponding polarization curves. The Tafel slopes of the three electrocatalysts were calculated based on the following equation: η = a + b![[thin space (1/6-em)]](https://www.rsc.org/images/entities/char_2009.gif) log
log![[thin space (1/6-em)]](https://www.rsc.org/images/entities/char_2009.gif) j. The Mo–N-CNT showed a value of 64 mV dec−1 (Fig. 4b), which was smaller than those of Mo-CNT (74 mV dec−1) and C3N4-CNT (76 mV dec−1), indicating the more facile electrode kinetics. The exchange current density (j0) was also determined from the extrapolation of the Tafel plots (Fig. S7†). The value of the Mo–N-CNT was higher than those of C3N4-CNT and Mo-CNT. These results indicated the superior electrocatalytic activity of Mo–N-CNT for the OER.
j. The Mo–N-CNT showed a value of 64 mV dec−1 (Fig. 4b), which was smaller than those of Mo-CNT (74 mV dec−1) and C3N4-CNT (76 mV dec−1), indicating the more facile electrode kinetics. The exchange current density (j0) was also determined from the extrapolation of the Tafel plots (Fig. S7†). The value of the Mo–N-CNT was higher than those of C3N4-CNT and Mo-CNT. These results indicated the superior electrocatalytic activity of Mo–N-CNT for the OER.
The kinetic parameter of Mo–N-CNT was investigated by measuring Nyquist plots in the range of 1 MHz to 0.1 Hz as presented in Fig. 4c. As derived from the semicircle in the high-frequency region, the charge transfer resistance (Rct) of Mo–N-CNT was 40 Ω, much smaller than those of Mo-CNT (291 Ω) and C3N4-CNT (3240 Ω). The small value of Rct suggested the fast charge transfer on the surface of Mo–N-CNT, which supports the improved catalytic activity for the OER by the hybridization of Mo oxynitride nanoparticles with N doped CNTs. The ECSA value was determined from the corresponding Cdl value in the non-faradaic region of CV curves in the potential range of 0.35 to 0.53 V vs. RHE (Fig. 4d and S8†). The Cdl can be obtained from the linear plot of the double layer charge current.39 The Mo–N-CNT exhibited a larger Cdl value of 8.34 mF cm−2 than the Mo-CNT (4.03 mF cm−2) and the C3N4-CNT (1.65 mF cm−2), respectively. The resulting ECSA values, which are derived from the specific capacity of 0.04 mF cm−2, are determined to be 0.33, 0.16, and 0.07 cm2 for Mo–N-CNT, Mo-CNT, and C3N4-CNT, respectively.40 The largest ECSA for Mo–N-CNT implies more abundant active sites exposed on the N-CNT surface. The turnover frequency (TOF) was applied to demonstrate the catalytic efficiency of Mo–N and Mo–O bonds as active sites (Fig. S9†). In particular, the Mo–N-CNT showed the highest TOF value at a specific overpotential, indicating the highest catalytic efficiency.
The electrochemical durability was investigated by measuring CV curves for 1000 cycles at a scan rate of 5 mV s−1 (Fig. 5). The collected polarization curves for the 1st and 1000th cycles showed a little degradation in terms of both OER onset overpotential and anodic current density. To drive the current density of 10 mA cm−2, the overpotential (344 mV) of Mo–N-CNT at the 1st cycle associated with water oxidation was not significantly changed after the 1000th cycle (350 mV) (Fig. 5a). Furthermore, the chronoamperometry (CA) curves were measured to evaluate the long-term durability of the Mo–N-CNT catalyst at an overpotential of 344 mV for 80 h. The initial current density was preserved up to 20 h of measurement and this value gradually decreased with a retention of 79% for 80 h. These results indicate that the Mo–N-CNT electrocatalyst showed high electrocatalytic activity and good durability for the OER due to the partial nitridation of Mo oxides and the hybridization of N-doped CNTs.
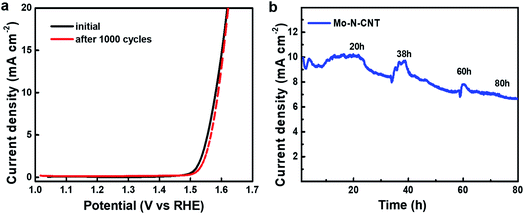 | ||
| Fig. 5 (a) Polarization curves of Mo–N-CNT at the initial and 1000th cycles and (b) chronoamperometry curve of Mo–N-CNT at an overpotential of 344 mV. | ||
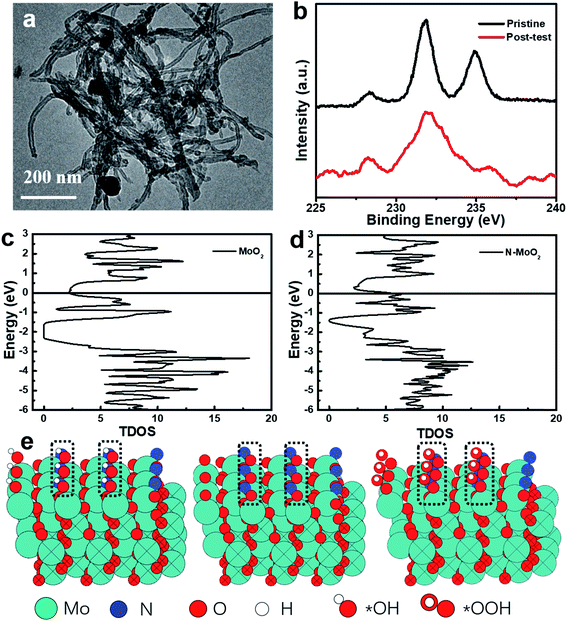
To evaluate the electrocatalytic stability of post-test Mo–N-CNT after the OER test, the changes of the morphological structure and chemical configurations were confirmed. Fig. 6a shows the TEM images of Mo–N-CNT after the OER test, and a slight change can be found attributed to the formation of Mo oxides on the surface in the alkaline solution and the residual Nafion, which is also further verified by XPS in Fig. 6b. In comparison to that of the pristine state, the additional bond at 688 eV corresponded to the appearance of F atoms from the residual Nafion (Fig. S10†), and the high-resolution Mo 3d peak at 232.8 eV was much broadened, indicating the different chemical state of Mo–N-CNT during the OER test. To understand the chemical environment and efficient catalytically active sites, the reaction energy and electronic structure of Mo–N-CNT were calculated by density functional theory (DFT). It can be obviously observed from the density of state (DOS) diagram in Fig. 6c and d that MoO2 is a semiconductor material with a bandgap of 0.7 eV. Interestingly, the bandgap vanished and the valence band was directly connected with the conduction band after the modification of MoO2 with heteroatom N doping. The metallic properties of Mo nitride as the catalytic material are conducive to water splitting. Additionally, to reveal the modified electronic structure by N atom doping to enhance the OER properties of Mo–N-CNT, the partially nitridized MoO2 was examined by a serious of calculations. The Gibbs energy at different reaction steps (*OH, *O, *OOH and *O2) was obtained by modeling calculation in Fig. 6e and S11.† During the whole OER process, the reaction energy at the N sites, which depends on the Gibbs energy of all the reaction steps, is smaller for Mo oxynitride than that of Mo sites. Upon incorporating N atoms, the adsorption of *OH was the rate-determining step (RSD) for the OER at N sites, while the conversion of *O to *OOH was the RSD for Mo sites. Therefore, the catalytically active sites for partial nitridation of MoO2 are more conducive to the desorption of O2 to further improve the electrocatalytic performance of the OER catalyst.
Experimental
Synthesis of C3N4-CNT
All chemicals and CNTs were purchased from Aladdin Reagent Co., Ltd. Firstly, the C3N4-CNT was synthesized as follows. Tripolycyanamide (645 mg) as the precursor of C3N4 was dissolved in deionized (DI) water and methanol (1.2 mL) and KOH (0.1 g) was added. The aqueous solution (20 mL) was continuously stirred for 4 h at 80 °C. Then, 50 mg CNTs, which were used to construct a tubular structure, were added into the above solution with advanced ultrasonication to obtain a homogeneous solution. The pH value of the homogeneous solution was adjusted to 1.0 by adding 1 M HCl solution, and the KOH solution was further added to form a polymeric gel. Finally, the polymeric gel was heated at 700 °C for 1.5 h under an ammonia atmosphere and the sample was named C3N4-CNT.Synthesis of Mo-CNT
The CNTs (50 mg) were added into DI water (20 mL) under ultrasonication to form a homogeneous solution. Ammonium molybdate (50 mg) was also dissolved in DI water (20 mL) and then, mixed with the CNT dispersion under magnetic stirring for 1 h. The mixture was transferred to a Teflon-lined autoclave and heated at 180 °C for 24 h. After naturally cooling down to room temperature, the precipitates were washed with water/ethanol, collected by vacuum filtration, and dried in a vacuum oven at 80 °C overnight. Finally, the composite was annealed at 800 °C for 2 h under an argon atmosphere, and the sample was denoted as Mo-CNT.Synthesis of Mo–N-CNT
The as-obtained C3N4-CNT was dispersed in DI water at a concentration of 3 mg mL−1. Ammonium molybdate (50 mg) was dissolved in DI water (20 mL) and then, mixed with the C3N4-CNT dispersion under magnetic stirring for 1 h. After this, Mo–N-CNT was synthesized following the same method as Mo-CNT. Meanwhile, a control sample without adding CNTs was prepared with the same method and denoted as Mo–N–O.Electrochemical measurement
Electrochemical measurements were conducted in a three-electrode system using an Interface 1000 electrochemical workstation. The aqueous electrolyte was 1 M KOH at a pH of 13.62 and deaerated using high-purity nitrogen before the measurement. Platinum wire and a Hg/HgO electrode (the saturated calomel electrode, SCE) with a salt bridge were used as the counter and reference electrodes, respectively. Both electrodes were rinsed with DI water and dried with compressed air. Notably, the SCE was calibrated before and after the accuracy tests. Potentials were referenced to a reversible hydrogen electrode (RHE) following an equation of (0.24 + 0.0592 × pH) V. All potentials were converted and referred to the RHE unless stated otherwise. The glassy carbon electrode was cleaned in ultrapure water several times and dried at room temperature before use. The Mo–N-CNT sample was deposited on the glassy carbon electrode, which was used as the working electrode. The preparation process of Mo–N-CNT inks and the working electrode was carried out as described below. The Mo–N-CNT sample was ground in agate mortars and placed in a 5 mL centrifuge tube. Upon adding the Nafion ionomer solution and ethanol, the final concentration of the mixture was 5 mg mL−1. The mixture was sonicated using an ultrasound probe to obtain the Mo–N-CNT catalytic inks. The catalytic performances of Mo–N-CNT and other samples for the OER were examined using cyclic voltammetry (CV) in 1 M KOH electrolyte at 5 mV s−1.The potential range was from 1.0 V to 1.6 V (vs. RHE) and IR correction was done to offset the uncompensated resistance. Electrochemical impedance spectroscopy (EIS) was used to record Nyquist plots in 1 M KOH in a three-electrode cell at room temperature, varying the frequencies from 1 MHz to 0.1 Hz. The electrochemically active surface area (ECSA) was estimated from the electrochemical double-layer capacitance (Cdl) by measuring CV in a non-faradaic region from 0.35 V to 0.55 V (vs. RHE) at scan rates of 20, 40, 60, 80, and 100 mV s−1. Chronoamperometry (CA) was carried out in 1 M KOH at 10 mA cm−2 for 80 h.
Conclusions
In summary, we have constructed hierarchical Mo–N-CNT architectures as a low cost and highly active electrocatalyst by facile hydrothermal and thermal activation of C3N4. The partial nitridation of Mo oxides effectively modified the chemical structure, thereby improving the catalytic activity of Mo–N-CNT in strong alkaline electrolytes. The hierarchical porous structure was also favorable for accelerating the ion diffusion and exposing abundant active sites for efficient OER operation. The Mo–N-CNT showed a lower overpotential of 344 mV to drive a current density of 10 mA cm−2 with a small Tafel slope of 64 mV dec−1. The small charge transfer resistance for Mo–N-CNT implied the fast OER kinetics. Thus, this work provides a chemical strategy to design cost-effective and efficient transition metal-based electrocatalysts and to improve the electrocatalytic activity and stability through partial nitridation and N doping for OER applications.Conflicts of interest
There are no conflicts to declare.Acknowledgements
The work was supported by the National Natural Science Foundation of China (21805239), the Natural Science Foundation of the Jiangsu Higher Education Institutions of China (18KJB150034) and the ‘Lvyang Jinfeng’ Talents Attracting Plan. We also acknowledge the technical support at the Testing Center of Yangzhou University.References
- L. Dai, Y. Xue, L. Qu, H. J. Choi and J. B. Baek, Chem. Rev., 2015, 115(11), 4823–4892 CrossRef CAS.
- K. Elumeeva, J. Masa, J. Sierau, F. Tietz, M. Muhler and W. Schuhmann, Electrochim. Acta, 2016, 208, 25–32 CrossRef CAS.
- P. Nakhanivej, X. Yu, S. K. Park, S. Kim, J.-Y. Hong, H. J. Kim, W. Lee, J. Y. Hwang, J. E. Yang, C. Wolverton, J. Kong, M. Chhowalla and H. S. Park, Nat. Mater., 2019, 18(2), 156–162 CrossRef CAS.
- C. Wang, D. Ren, H. S. Park, Z. Dong, Y. Yang, Q. Ren and X. Yu, J. Alloys Compd., 2017, 728, 767–772 CrossRef CAS.
- C. Wu, Y. Du, Y. Fu, W. Wang, T. Zhan, Y. Liu, Y. Yang and L. Wang, Composites, Part B, 2019, 177, 107252 CrossRef CAS.
- Y. Dou, T. Liao, Z. Ma, D. Tian, Q. Liu, F. Xiao, Z. Sun, J. H. Kim and S. X. Dou, Nano Energy, 2016, 30, 267–275 CrossRef CAS.
- Z. Wang, D. Xu, J. Xu and X. Zhang, Chem. Soc. Rev., 2014, 43(22), 7746–7786 RSC.
- S. Wang, G. Bendt, S. Saddeler and S. Schulz, Energy Technol., 2019, 7(6), 1801121 CrossRef.
- M. Tahir, C. Cao, F. K. Butt, F. Idrees, N. Mahmood, Z. Ali, I. Aslam, M. Tanveer, M. Rizwan and T. Mahmood, J. Mater. Chem. A, 2013, 1(44), 13949–13955 RSC.
- M. Tahir, L. Pan, F. Idrees, X. Zhang, L. Wang, J. Zou and Z. Wang, Nano Energy, 2017, 37, 136–157 CrossRef CAS.
- N. Suen, S. Hung, Q. Quan, N. Zhang, Y. Xu and H. Chen, Chem. Soc. Rev., 2017, 46(2), 337–365 RSC.
- L. C. Seitz, C. F. Dickens, K. Nishio, Y. Hikita, J. Montoya, A. Doyle, C. Kirk, A. Vojvodic, H. Y. Hwang and J. K. Norskov, Science, 2016, 353(6303), 1011–1014 CrossRef CAS.
- M. Gong and H. Dai, Nano Res., 2015, 8(1), 23–39 CrossRef CAS.
- Y. Wang, S. Liu, X. Hao, S. Luan, H. You, J. Zhou, D. Song, D. Wang, H. Li and F. Gao, J. Mater. Chem. A, 2019, 7(17), 10572–10580 RSC.
- F. Lyu, Y. Bai, Z. Li, W. Xu, Q. Wang, J. Mao, L. Wang, X. Zhang and Y. Yin, Adv. Funct. Mater., 2017, 27(34), 1702324 CrossRef.
- Y. Jin, H. Wang, J. Li, X. Yue, Y. Han, P. K. Shen and Y. Cui, Adv. Mater., 2016, 28(19), 3785–3790 CrossRef CAS.
- K. Prabakaran, S. B. Ingavale and B. Kakade, J. Alloys Compd., 2020, 812, 152126 CrossRef CAS.
- W. Zhang, L. Cui and J. Liu, J. Alloys Compd., 2020, 821, 153542 CrossRef CAS.
- J. Du, Z. Zou, C. Liu and C. Xu, Nanoscale, 2018, 10(11), 5163–5170 RSC.
- L. Chai, Z. Hu, X. Wang, Y. Xu, L. Zhang, T.-T. Li, Y. Hu, J. Qian and S. Huang, Adv. Sci., 2020, 7(5), 1903195 CrossRef CAS.
- X. Wang, Z. Ma, L. Chai, L. Xu, Z. Zhu, Y. Hu, J. Qian and S. Huang, Carbon, 2019, 141, 643–651 CrossRef CAS.
- A. T. Garcia Esparza, T. Shinagawa, S. Ould Chikh, M. Qureshi, X. Peng, N. Wei, D. H. Anjum, A. Clo, T. C. Weng, D. Nordlund, D. Sokaras, J. Kubota, K. Domen and K. Takanabe, Angew. Chem., Int. Ed., 2017, 56(21), 5780–5784 CrossRef CAS.
- J. Jiang, Q. Liu, C. Zeng and L. Ai, J. Mater. Chem. A, 2017, 5(32), 16929–16935 RSC.
- X. Wang, L. Chai, J. Ding, L. Zhong, Y. Du, T.-T. Li, Y. Hu, J. Qian and S. Huang, Nano Energy, 2019, 62, 745–753 CrossRef CAS.
- Q. Huang, Y. Guo, X. Wang, L. Chai, J. Ding, L. Zhong, T.-T. Li, Y. Hu, J. Qian and S. Huang, Nanoscale, 2020, 12(18), 10019–10025 RSC.
- M. Dan, J. Xiang, F. Wu, S. Yu, Q. Cai, L. Ye, Y. Ye and Y. Zhou, Appl. Catal., B, 2019, 256, 117870 CrossRef CAS.
- P. Chen, K. Xu, Z. Fang, Y. Tong, J. Wu, X. Lu, X. Peng, H. Ding, C. Wu and Y. Xie, Angew. Chem., Int. Ed., 2015, 54(49), 14710–14714 CrossRef CAS.
- T. Liu, Y. Tian, M. Li, Z. Su, J. Bai, C. Ma, X. Bo, W. Guan and M. Zhou, Electrochim. Acta, 2019, 323, 134684 CrossRef CAS.
- Y. Zhang, W. Li, L. Lu, W. Song, C. Wang, L. Zhou, J. Liu, Y. Chen, H. Jin and Y. Zhang, Electrochim. Acta, 2018, 265, 497–506 CrossRef CAS.
- Y. Wang, B. Zhang, W. Pan, H. Ma and J. Zhang, ChemSusChem, 2017, 10(21), 4170–4177 CrossRef CAS.
- B. K. Kang, S. Y. Im, J. Lee, S. H. Kwag, S. B. Kwon, S. Tiruneh, M.-J. Kim, J. H. Kim, W. S. Yang, B. Lim and D. H. Yoon, Nano Res., 2019, 12(7), 1605–1611 CrossRef CAS.
- F.-Y. Su, C.-Q. Xu, Y.-X. Yu and W.-D. Zhang, ChemCatChem, 2016, 8(22), 3527–3535 CrossRef.
- D. Ruan, R. Lin, K. Jiang, X. Yu, Y. Zhu, Y. Fu, Z. Wang, H. Yan and W. Mai, ACS Appl. Mater. Interfaces, 2017, 9(35), 29699–29706 CrossRef CAS.
- X. Chen, J. Qi, P. Wang, C. Li, X. Chen and C. Liang, Electrochim. Acta, 2018, 273, 239–247 CrossRef CAS.
- I. S. Amiinu, Z. Pu, X. Liu, K. A. Owusu, H. G. R. Monestel, F. O. Boakye, H. Zhang and S. Mu, Adv. Funct. Mater., 2017, 27(44), 1702300 CrossRef.
- Y. Zheng, Y. Jiao, Y. Zhu, Q. Cai, A. Vasileff, L. H. Li, Y. Han, Y. Chen and S. Qiao, J. Am. Chem. Soc., 2017, 139(9), 3336–3339 CrossRef CAS.
- H. Jin, X. Liu, Y. Jiao, A. Vasileff, Y. Zheng and S. Qiao, Nano Energy, 2018, 53, 690–697 CrossRef CAS.
- D. J. Li, U. N. Maiti, J. Lim, D. S. Choi, W. J. Lee, Y. Oh, G. Y. Lee and S. O. Kim, Nano Lett., 2014, 14(3), 1228–1233 CrossRef CAS.
- Z. Liu, X. Yu, H. Yu, H. Xue and L. Feng, ChemSusChem, 2018, 11(16), 2703–2709 CrossRef CAS.
- A. T. Swesi, J. Masud and M. Nath, Energy Environ. Sci., 2016, 9(5), 1771–1782 RSC.
Footnote |
| † Electronic supplementary information (ESI) available. See DOI: 10.1039/d0na00648c |
| This journal is © The Royal Society of Chemistry 2020 |

