
 Open Access Article
 This Open Access Article is licensed under a Creative Commons Attribution-Non Commercial 3.0 Unported Licence
A slow, efficient and safe nanoplatform of tailored ZnS QD-mycophenolic acid conjugates for in vitro drug delivery against dengue virus 2 genome replication†
Ranjeet
Dungdung‡
a,
Manikanta
Bayal‡
b,
Lathika
Valliyott
a,
Unnikrishnan
Unniyampurath
c,
Swapna S.
Nair
 *b and
Rajendra
Pilankatta
*a
*b and
Rajendra
Pilankatta
*a
aDepartment of Biochemistry and Molecular Biology, School of Biological Sciences, Krishna Block, Central University of Kerala, Periya, Kasargod, Kerala, India 671316. E-mail: praj74@cukerala.ac.in
bDepartment of Physics, School of Physical Sciences, Narmada Block, Central University of Kerala, Periya, Kasargod, Kerala, India 671316. E-mail: swapna@cukerala.ac.in
cDUKE-NUS Medical School, 8 College Road, Singapore 169857
First published on 6th October 2020
Abstract
Dengue is a major health concern causing significant mortality, morbidity and economic loss. The development of anti-dengue viral drugs is challenging due to high toxicity, as well as off-target/side effects. We engineered size tuned ZnS QDs as a platform for the efficient delivery of mycophenolic acid (MPA) against dengue virus serotype 2 (DENV2) to evaluate the drug efficacy and toxicity using the DENV2 sub-genomic replicon system in BHK21 cells. The results indicate that the Selectivity Index 50 (SI50) of the ZnS QD-MPA conjugate was two orders higher than that of free MPA with lower cytotoxicity. The effect is attributed to the sustained release of MPA from ZnS QD-MPA. The conjugated MPA caused significant inhibition of the virus at the level of replication and viral protein translation. The study underpins the efficiency of the ZnS QD for the delivery of antiviral drugs against DENV2 with negligible toxicity and side effects.
Introduction
Viral infections are one of the leading causes of mortality worldwide, having a global negative impact on healthcare and socio-economic development.1 However, the lack of selective inhibitors against a multitude of medically important viruses, with a prominence of emerging and re-emerging RNA viruses (e.g.: Dengue, Chikungunya, SARS-CoV, MERS-CoV, and SARS-CoV2) has aggravated the scenario. Although it is impractical to develop drugs against each of these viruses within a short duration, the development of novel treatment strategies is the key to resolve the issue.2 The adverse side effects/toxicity due to prolonged use of drugs and the rapid development of drug resistance in patients to the existing therapies make it a more serious public health concern.3In this context, nanomedicine based strategies using biocompatible nanomaterials can be considered as a powerful tool to enhance the efficacy of antiviral drugs with the possibility of a remarkable reduction in toxicity. Nanoparticles offer distinctive physical properties that can have associated advantages for drug delivery, mainly due to the small particle size, large surface area to volume ratio, and the tunable surface charge of the particle.4 The possibility of drug encapsulation, as well as the capability of nanoparticles to handle large drug payloads, can be attributed to the above properties. Thus nanoparticulate drug delivery systems are attractive candidates to improve the therapeutic effects of drugs.5,6 Several anti-cancer drugs including paclitaxel, doxorubicin, 5-fluorouracil, and dexamethasone have been successfully re-formulated using nano-material based delivery systems.7–10 Nano-medicines with different types of nano-formulations against HIV have been approved and are currently undergoing investigation for the treatment of viral infections.11 It was reported that glucose coated gold nanoparticles (GNPs) attached to the drugs abacavir and lamivudine can act as a multivalent drug against HIV.12
Importantly, quantum dots (QDs) are promising zero-dimensional materials that can be designed/engineered for tailored applications. The use of QDs in medicine, and cell and molecular biology is one of the fastest emerging and most interesting interfaces of nanotechnology.13–15 The biodistribution and the toxicity of QDs are determined by their surface coating and particle size.16,17 Zinc sulfide (ZnS), which belongs to the semi-conductor class II–VI, is one of the most ideal QDs which can be explored for biological applications due to its low toxicity levels.4 It has excellent potential for application in fields such as drug delivery, and bio-imaging and also emerges as one of the most promising materials for biosensor applications.18–20 However, reports on the employment of ZnS in drug delivery and related applications are rather scarce. In this backdrop, we have investigated the application of ZnS QDs for the delivery of antiviral drugs against one of the most dangerous mosquito-borne tropical flaviviruses known as Dengue virus (DENV).
Dengue virus belonging to the family of Flaviviridae and genus Flavivirus is one of the major global health threats, leading to significant morbidity, and mortality. It is a mosquito-borne viral disease caused by Ades aegypti.21 As per the World Health Organization (WHO), there were 390 million cases of dengue fever reported worldwide, and annually 100 million infections and 25![[thin space (1/6-em)]](https://www.rsc.org/images/entities/char_2009.gif) 000 deaths are associated with it while the victims are mostly children.22 There are four distinct (DENV1 to DENV4) serotypes circulating all over the globe causing DENV infection.23 The infection causes symptoms ranging from acute febrile disease to severe manifestations, including bleeding and organ failure resulting in Dengue Haemorrhagic Fever (DHF) or Dengue Shock Syndrome (DSS), but there is no available vaccine or antiviral drug that can prevent all four dengue virus serotypes.24,25 Even though, several small molecule based anti-dengue virus drug molecules have been explored none of them are in clinical use due to their toxic effect.26,27
000 deaths are associated with it while the victims are mostly children.22 There are four distinct (DENV1 to DENV4) serotypes circulating all over the globe causing DENV infection.23 The infection causes symptoms ranging from acute febrile disease to severe manifestations, including bleeding and organ failure resulting in Dengue Haemorrhagic Fever (DHF) or Dengue Shock Syndrome (DSS), but there is no available vaccine or antiviral drug that can prevent all four dengue virus serotypes.24,25 Even though, several small molecule based anti-dengue virus drug molecules have been explored none of them are in clinical use due to their toxic effect.26,27
Mycophenolic acid (MPA) is an immunosuppressant that exerts its effects by selectively reducing guanine nucleotide synthesis via the reversible inhibition of inosine monophosphate dehydrogenase (IMPDH). The drug inhibits dengue virus RNA replication and virus production.28,29 However, the inherent toxic nature of MPA downgrades its use as an anti-dengue viral drug.30,31 In the present study, ZnS QDs were used as a nanoplatform for the effective delivery of (MPA) against DENV2 with an enhanced selectivity index.
Experimental methods
Materials
For the synthesis of the quantum dots, zinc chloride (ZnCl2) (Cat# 229997) was purchased from Sigma and sodium sulfide (Na2S) (Cat # 06020) was purchased from Loba Chemie.Dulbecco's modified Eagle medium (DMEM) (Cat# AL007), Geneticin (G418) (Cat#A016), L-glutamine (Cat#TCL012), 1× trypsin (Cat#TCL099), antibiotics (penicillin + streptomycin) (Cat# A018), and Bovine Serum Albumin (BSA) (Cat# TC194) were purchased from HiMedia.
The restriction digestion enzyme Sac1-HF (Cat# R3156S) was purchased from NEB.
A transIT-mRNA transfection Kit (Mirus Bio, Cat#MIR2250) was purchased for in vitro RNA transfection.
An ELISA detection kit (Dengue NS1 Ag Microlisa ELISA kit) (Cat# IR031096) for Dengue virus NS1Antigen was purchased from J. Mitra & Co.
Dimethyl sulfoxide (DMSO) (Cat# D8418), sodium dodecyl sulphate (SDS) (Cat# L3771), triton x-100 (Cat# 93443), mycophenolic acid (Cat# M3536), celgosivir (Cat# SML2314), curcumin (Cat# 239802), HRP-conjugated anti-rabbit secondary antibody (Cat# A9169), HRP-conjugated anti-mouse secondary antibody (Cat# A9044), DAPI (Cat# D9542), fluoroshield (Cat# F6937), and acrylamide/bis acrylamide (Cat# A3574) were purchased from Sigma.
Fetal bovine serum (FBS) (Cat# 16000044), Stbl2 cells (Cat# 10268019), horse serum (Cat# 16050114), an Invitro Transcription kit MEGAscript™ SP6 Transcription kit (Cat#AM1330), Cap Analog (m7G(5′) ppp (5′)G) (Cat# AM8048), Trizol reagent (Cat# 15596026), MTT (Cat# M6494), Verso cDNA synthesis kit (Cat# AB1453B), RIPA lysis buffer (Cat# 89900), BCA kit (Cat#23227), anti-dengue NS3 polyclonal rabbit antibody (Cat# PA5-32199), β-actin antibody (Cat# MA5-15739), Alexa Fluor 488 (Cat# A-11034), Alexa Fluor 555 (Cat# A-31570), and a chemiluminescent substrate (Cat# 32132), were purchased from Thermo scientific (USA).
Roche SYBR Green RT-PCR kits (Cat# 04707516001) were purchased from Roche. NS4A and GAPDH primers were purchased from IDT. Rluc activity assay was carried out using a luciferase assay kit (Cat# E2810) purchased from Promega. For dsRNA staining, J2 anti-dsRNA IgG2a monoclonal mouse antibody (Cat# 10010200) was purchased from Scicons. A PVDF membrane (Cat# IPVH00010) was purchased from Merckmilipore. A plasmid midiprep kit (Cat# 12143) was purchased from Qiagen.
Synthesis of the MPA capped ZnS quantum dots
MPA capped ZnS QDs were synthesized by the chemical co-precipitation method. Zinc chloride (ZnCl2), sodium sulphide (Na2S) and mycophenolic acid (MPA) (C17H20O6) were the precursors. ZnCl2 (3 mM) and Na2S (3 mM) were independently dissolved in 10 ml of distilled water and a white precipitate of ZnS QDs was formed. MPA (3 mM, 2.2 ml) was added to the colloidal suspension of ZnS QDs and stirred well. The precipitate was centrifuged at 12000 rpm for 20 min. ZnS QDs were separated from water and dried well at room temperature as a pellet.
X-ray characterization
The samples were prepared for the X-ray diffraction study as follows. The pellet was ground well in a mortar pestle and made into a fine powder. The characterization was performed using a Rigaku Miniflex X-ray diffractometer using Cu-Kα radiation of wavelength 1.5406 Å. The sample was scanned from 15 degrees to 90 degrees. The grain size was calculated from the obtained three peaks of the diffraction pattern using the Debye Scherrer formula.Optical characterization
The as prepared samples were dispersed in water and their absorption spectra were recorded using a UV-Vis spectrometer in a wavelength range of 190–900 nm. And the samples are measured in UV cuvettes with the blank cuvette as the reference. Tauc plots were plotted to study the band gap of samples.The same samples were analysed for their luminescence properties using fluorescence spectroscopy. Here authors studied the luminescence spectra using 300 nm as the excitation wavelength (LS55, Perkin Elmer).
Transmission electron microscopy (TEM) analysis
The sample preparation for this study is as detailed above. The morphology, size and shape of the samples were analysed using a JEOL JEM-2100 High Resolution Transmission Electron Microscope. The samples were scanned at different magnifications to confirm the grain size and their lattice planes.Fourier transformer infra-red (FTIR) spectroscopy analysis
The prepared samples were pelletized by the KBr pellet method. The fourier Transform infra-red characteristics of the sample were determined using a Spectrum Two-FTIR Spectrometer. The samples were scanned from 400 cm−1 to 4000 cm−1. The result will show how well a sample absorbs light at each wavelength and also provide information about bond formation.Scanning electron microscopy (SEM) analysis
The surface morphology and EDAX studies of ZnS QDs and ZnS QD-MPA are carried out using a ZEISS Gemini Scanning Electron Microscope. The sample preparation for this study is as detailed above in X-ray characterisation. The size and shape of the QDs are determined. EDAX gives information on the chemical composition of the sample. Using the weight percentage obtained from the results, the MPA to ZnS ratio was calculated.CHNS analysis
CHNS elemental analysis was performed using an EAS Vario MICRO CHNS analyser (Ser. No. 15133023). Initially the analysis was carried out with the blank and calibrated using sulphanilamide. Nearly 3.19 mg of ZnS QD-MPA (unconjugated MPA was removed by centrifugation and the ZnS QD-MPA pellet was collected) was weighed and the experiment was carried out. The results were reported in weight percent of carbon, hydrogen, nitrogen and sulphur.Determining drug encapsulation efficiency
The encapsulation efficiency of MPA was measured by analysing the supernatant collected from ZnS QD-MPA solution after centrifugation at 5000 rpm. The absorbance of the supernatant was measured at 300 nm using a spectrophotometer (Enspire, Perkin Elmer). The standard curves of MPA were constructed at a concentration in the range of 0–1 mg wt%. A standard graph was prepared to determine the unknown concentration of the un-encapsulated MPA. The encapsulation efficiency of the MPA loaded into ZnS QDs was calculated as follows:The encapsulation efficiency (%):

Cell culture
BHK-21 cells were maintained in Dulbecco's modified Eagle medium (DMEM) with 10% fetal bovine serum (FBS) with 5% CO2 at 37 °C. All cell lines were procured from the National Centre for Cell Sciences, Pune. All the experiments were performed under the approval of the Institutional Biosafety Committee, Central University of Kerala.Generation of the DV2-replicon cell line
The plasmid pRS424LucIRESNeoDen2 kindly gifted by Prof. R.Padmanabhan (Georgetown University, Washington DC) was transformed into Stbl2 cells and grown at 30 °C for two days and plasmid midiprep was prepared. The plasmid was linearized by digestion with the Sac1-HF enzyme and purified. In vitro Transcription (IVT) was carried out using 1 μg μl−1 of the purified DNA as a template. The capping analog was added as per the manufacturer's instructions. Then the in vitro transcribed RNA was transfected into BHK-21 cells using a TransIT-mRNA transfection kit as per the manufacturer's instructions and incubated at 37 °C with 5% CO2 and 400 μg ml−1 of Geneticin (G418) for 72 h and for an additional one week. Drug-resistant BHK-21 cells containing DV2-replicon were propagated in the presence of G418. A schematic diagram representing the process of DV2-replicon cell generation is shown in Fig. S4(a), ESI.†ELISA of the dengue virus NS1 antigen
The supernatant of DV2-replicon cells was collected and subjected to a serological test against the dengue NS1 antigen. NS1 antigens were detected by enzyme-linked immunosorbent assay (ELISA) based on the “Direct Sandwich” principle using a Dengue NS1 Ag Microlisa ELISA kit as per the manufacturer's protocol. The yellow color developed was finally read at 450 nm (Fig. S4c, ESI†).Morphological observations
DV2-replicon cells were seeded with a density of 1 × 10⁴ cells per well into a 96-well plate. After cells attached to the bottom of the plate, varying concentrations (0–3 mM) of ZnS QDs or MPA or ZnS QD-MPA were added to the cells.The medium containing compounds in the wells was removed after 24 h. Bright-field images were then captured using an inverted phase-contrast microscope under 10× magnification (Fig. S5, ESI†).Cell viability (MTT assay) and LD50 determination
DV2-replicon cells (expressing subgenomic dengue virus replicon, propagated in our lab) were seeded@1 × 10⁴ into a 96-well plate supplemented with 10% FBS and incubated for 24 h at 37 °C, and 5% CO2. The medium was then removed and replaced with treatment infused media serially half diluted with ZnS QD or MPA or ZnS QD-MPA concentrations ranging from 0–6 mM and incubated for 24 h. After which 10 μl of MTT solution was added with a concentration of 5 mg ml−1 to each well including a negative control of 10 μl of the MTT solution added to 100 μl of medium alone. Then the cells were incubated for 3 h under the same conditions. The supernatant was replaced with 50 μl of DMSO to dissolve the formazan. The formazan product was analyzed spectrophotometrically at an absorbance of 570 nm. The lethal dose 50 (LD50) of ZnS QDs or MPA or ZnS QD-MPA was calculated by using GraphPad Prism v5 software. The cell viability assay was repeated in three independent experiments.Luciferase assay (RLuc) and EC50 determination
DV2-replicon cells were maintained in DMEM supplemented with 10% FBS, 100 μg ml−1 antibiotics (penicillin + streptomycin), and 400 μg ml−1 of G418. Briefly, DV2-replicon expressing cells (1 × 10⁴ in 100 μl) were seeded onto 96-well plates and incubated at 37 °C for 24 h in a humidified incubator with 5% CO2. MPA or ZnS QD-MPA was added at various concentrations (0, 0.39, 0.78, 1.56, 3.12, 6.25, 12.5, 25, 50, 100, and 200 μM) in 1% DMSO in triplicate wells. The treated cells were incubated at 37 °C for 24 h, washed, and lysed, and the Rluc activity assay was carried out using a luciferase assay kit as per the manufacturer's instructions. Luminescence was measured using a Multimode plate reader (PerkinElmer Enspire). The results were confirmed by 3 independent experiments. The Rluc activities were reported as percent inhibition relative to 1% DMSO (0% inhibition).The luciferase activity was estimated by using GraphPad Prism v5 software and the Effective Concentration 50 (EC50) was calculated.Release kinetics of MPA and ZnS QD-MPA
The release kinetics of free MPA and MPA from the conjugated ZnS QDs were measured by a dialysis method. An amount of 1 mg ml−1 of free MPA or conjugated MPA solution was introduced into 12 kDa dialysis tubing (sigma) and sealed with clips. The filled dialysis tubing was then placed into 2 ml of (i) a phosphate buffer solution at pH 5 or (ii) a phosphate buffer at pH 7.2 in order to monitor the amount of released MPA at a specific pH over 3 hours at room temperature. An aliquot of 100 μl of the phosphate buffer solution (pH 5/7.2) was removed at specific time points and the absorbance was measured at 300 nm using a multimode plate reader (Enspire, Perkin Elmer). Throughout the experiment the buffer volume was maintained at 2 ml by replenishing the 100 μl of phosphate buffer solution at pH 5 or 7.2 at respective time intervals of sampling. The standard curves of MPA at both pH were constructed with a concentration range between 0 and 1 mg. The amount of MPA released into the buffer though the dialysis membrane was determined from the standard curves.38,39 The percentage drug released was calculated using the equation:MPA released (%)
RNA extraction, reverse transcription and the quantitative real-time polymerase chain reaction (qRT-PCR)
The expression of the dengue non-structural NS4A gene in DV2-replicon cells was analyzed using the real-time qRT-PCR. The cells were grown in complete media to reach confluence and then the cells were treated with MPA or ZnS QD-MPA for 24 h. The treated cells were then trypsinized, centrifuged and collected as cell pellets for RNA extraction. Total RNA was extracted from the collected cells using the Trizol reagent method. The concentrations were analyzed using a NanoDrop™ 2000/2000c (Thermo Scientific). The first-strand cDNA was synthesized using a Verso cDNA synthesis kit. The expression of the NS4A gene was measured using Roche SYBR Green RT-PCR kits in a Lightcycler 480 II Real-time qRT-PCR system (Roche). The real-time qRTPCR was performed in triplicate. The mRNA level of GAPDH was measured as an internal control. The oligonucleotides used wereNS4A sense:
5′-AACTGTAGATCTACCATGTCCCTGACCCTGAACCTAATCACAG-3′,
Anti-sense:
5′-TTGACAGCGGCCGCTCATTATCTTTTCTGAGCTTCTCTGGTTG-3′and
GAPDH sense:
5′-AACGGGAAGCTTGTCATCAATGGAAA-3′,
Antisense:
5′-GCATCAGCAGAGGGGGCAGAG-3′.
The qRT-PCR conditions include initial denaturation at 94 °C for 2 min and 35 cycles of denaturation at 94 °C for 30 seconds, annealing at 55 °C for 30 seconds and elongation at 72 °C for 60 seconds and final extension of 72 °C for 7 min.
Western blotting analysis of dengue NS3 protein
DV2-replicon cells were cultured in 60 mm dishes and treated with MPA or ZnS QD-MPA. After 24 h treatment, the cells were collected, lysed with RIPA buffer and briefly sonicated for 5 min. The protein concentrations were measured with the BCA kit and equal protein (20 μg) concentrations were loaded into a 10% SDS-polyacrylamide gel after denaturation at 95 °C for 5 min. The proteins in the cell lysates were separated with SDS-PAGE and transferred onto a PVDF membrane overnight at 4 °C. The membrane was blocked for 1 h with 5% bovine serum albumin in Tris-buffered saline containing 0.1% Tween 20. After the membrane was washed 3 times the membrane was probed with primary antibody directed against DENV2 NS3 protein (rabbit anti-human; diluted 1:1000) and then incubated overnight at 4 °C. β-actin (mouse anti-human; diluted 1:2000) was used as an internal control. After that, the membrane was washed 3 times and incubated with corresponding HRP-conjugated anti-rabbit/mouse secondary antibody (diluted 1:10000) for 1 h. A chemiluminescent Substrate was added and the signal was visualized by exposing the membrane to a western blot image developer (cDigit, LiCor). The band intensities from three independent experiments were quantified.
Confocal laser scanning microscopy images of dengue double-stranded RNA and NS3 protein
The DV2-replicon cells were seeded on the coverslips which covered the bottom of 6-well plates with a density of 5 × 10⁴ cells per well. The cells were incubated at 37 °C maintained with 5% CO2 for 24 h for attachment of cells to the coverslip placed inside the wells. The growth medium in the wells was aspirated and then replaced by our compounds (MPA or ZnS QD-MPA) at a concentration of 1.229 μM or 4.54 μM in a fresh medium. After 24 h, the medium containing the compounds was aspirated and the cells were washed with PBS buffer about 3 times. Then, a 4% paraformaldehyde solution was added into the wells to fix the cells. The cells were permeabilized with 0.1% triton x-100 (5 min) and blocked with 5% horse serum for 1 h. Then, the cells were stained with J2 anti-dsRNA IgG2 a monoclonal mouse antibody or anti-dengue NS3 polyclonal rabbit antibody overnight at 4 °C followed by incubation with secondary antibody anti-mouse AlexaFluor-555 or anti-rabbit AlexaFluor-488 for 1 h at room temperature. To clearly determine cell co-localization, 0.5 μg ml−1 of DAPI was used to incubate cells in a dark room for 10 min. For every experimental step, the cells were washed with PBS buffer about three times. And the coverslips were carefully taken out and sealed with fluorescent seals. All experiments were performed protected from light. All images were captured at the same voltage using laser scanning confocal microscopy (Leica Dmi8 Sp8 model).Statistical analysis
All statistical comparisons were performed using GraphPad Prism Software (version 5) and the data were compared between treated and untreated groups (DMSO control). The results were analyzed for statistical variance using an unpaired Student t-test. P-Values of 0.05 were considered to be significantly different from those of the control. All the data sets are represented as mean ± SEM.Results and discussion
Synthesis of ZnS-QDs or ZnS QD-MPA
ZnS-QDs were synthesized using the co-precipitation method by mixing ZnCl2 and Na2S at room temperature at an optimal ratio,4 while the MPA capped ZnS QDs were prepared by mixing MPA and the as prepared ZnS at room temperature in the respective molar ratio of 1:8.
Characterization of ZnS-QDs
The X-ray diffraction spectra (Fig. 1a) of the ZnS QDs recorded by employing a Rigaku Dmax-C X-ray diffractometer using Cu-Kα radiation of wavelength 1.5406 Å showed diffraction maxima at 28.5°, 47.8° and 56.5° which were compared with standard JCPDS data and the cubic structure of ZnS (with no detectable hexagonal phase) and the observed peaks correspond to the (111), (220) and (311) crystal planes of cubic ZnS respectively. The crystallite size of the sample was calculated to be 1.3 nm using Debye Scherrer's formulae. TEM images were captured using a JEOL, JEM-2100 High-Resolution Transmission Electron Microscope (HRTEM) for the synthesized ZnS samples which confirm that the particles are spherical in shape with an average particle size of ∼5–6 nm for the synthesized ZnS QDs, which lies in a strong quantum confinement regime (Fig. 1b and c) show the electron diffractogram of ZnS QDs. Three bright circular diffraction rings were observed corresponding to the (111), (220) and (311) crystal planes of cubic ZnS with no signs of hexagonal ZnS and the results validate the XRD findings. The lattice spacings (d-spacing) were calculated from Fig. 1c. The microstructural characterization of the sample carried out using a ZEISS Gemini Scanning Electron Microscope (Fig. 1d) showed that the ZnS QDs form nanoclusters with a spherical shape with a cluster size in the 40–80 nm range (it can be assumed that around 10 to 12 individual particles form a nanocluster). Fig. 1e shows the EDAX analysis of ZnS QDs. The Zn to S ratio was estimated to be 1.4:1 showing sulfur deficiencies in ZnS QDs. The sulfur vacancies are often advantageous from an optical application point of view owing to the strong defect emission at 570 nm induced by the sulfur vacancies.
 | ||
| Fig. 1 Structural characterization of ZnS Q44Ds (a) X-ray pattern shows 3 distinct peaks corresponding to the pure cubic form. (b) TEM analysis with 10 nm magnification shows the particle size ranging from 5 to 6 nm (QD regime). (c) Electron diffraction study using HRTEM confirms the d-spacing corresponding to cubic ZnS. (d) SEM image of the surface of the particles. (e) EDAX spectra shows the presence of Zn and S in the QD sample with a ∼1.4:1 ratio. | ||
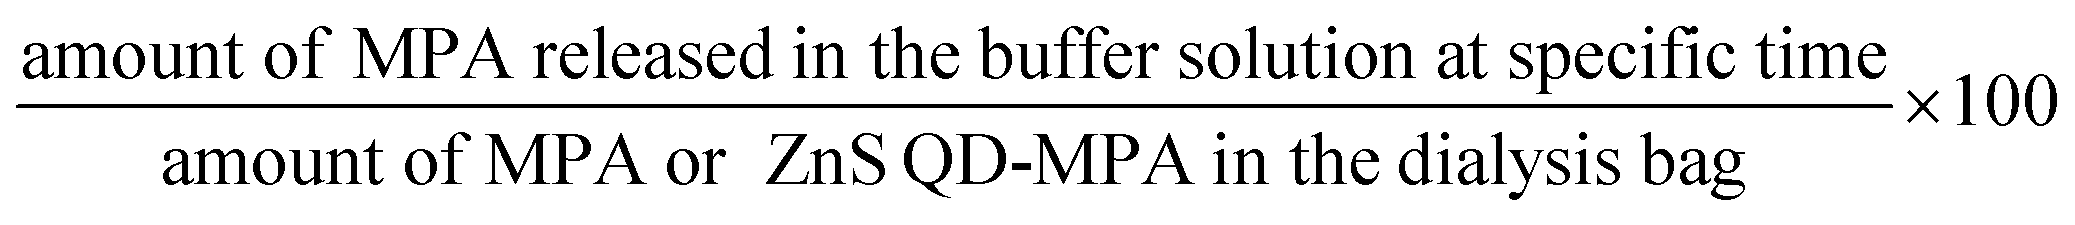
Characterization of ZnS QD-MPA
X-Ray diffraction of the MPA capped ZnS QDs is depicted in Fig. 2a. The spectrum shows peaks at 2θ = 28.5°, 47.8° and 56.5° which correspond to the (111), (220) and (311) crystal planes of cubic ZnS respectively with no detectable hexagonal phase (Fig. 2a). The crystallite size of the sample was calculated using the Debye Scherrer formula and it is obtained as 1.75 nm. The lattice parameter was calculated (5.4 Å-cubic). To find the exact particle size of MPA capped ZnS QDs, the TEM images of MPA capped ZnS QDs were recorded and are shown in Fig. 2e. It is found that the size of each particle lies in the range of 4–6 nm. Lattice planes are also identified from the electron diffractogram rings (Fig. 2f), which confirms that the ZnS QDs formed are monophasic with no detectable multiphase. | ||
| Fig. 2 Structural characterization of ZnS QD-MPA conjugates (a) X-ray pattern shows only 3 peaks corresponding to cubic ZnS. (b) FTIR analysis of pure ZnS, pure MPA and MPA conjugated ZnS showing signatures of conjugation. (c) Schematic shows the conjugation of ZnS QDs with MPA. (d) and (e) TEM analysis shows spherical QDs of average size ∼5 nm. (f) Electron diffraction spectra confirm the cubic phase. (g) Surface morphology using SEM analysis. (h) EDX spectra show the relative percentage of ZnS with MPA. (i) Binding of MPA on the ZnS surface. (j) Table shows the elemental quantification data of ZnS QD-MPA with a ratio 1:100 in (i) to show the conjugation of MPA based on the calculations performed. | ||
FTIR analysis of ZnS QDs, mycophenolic acid, and MPA capped ZnS QDs was conducted using a spectrum two FT-IR spectrometer and the spectra are shown in Fig. 2b. The spectrum of pure ZnS shows absorption peaks at 1562 cm−1 and 1414 cm−1, which are attributed to the bending mode of SH (slightly modified from the usually observed peak at ∼1550 for the bending mode of OH) and SO stretching respectively. This shows the presence of an adsorbed water molecule on the ZnS surface where it gets bonded through hydrogen linkage with S. The doublet observed in the fingerprint region at 515 cm−1 and 643 cm−1 represents the Zn–O and Zn–S vibrations respectively.31,32 This again confirms the presence of the adsorbed water molecule which is hydrogen-bonded to the ZnS QDs.
MPA capped ZnS also shows similar results in the absorption range of ∼1549 cm−1 and 1407 cm−1 which is slightly shifted compared to that of the parent ZnS quantum dots due to the mass variation because of the attachment of MPA on the ZnS surface through S–H hydrogen linkage. The absorption edge of pure ZnS observed in the range of 3440 cm−1 is attributed to the O–H stretching mode of H2O adsorbed on the surface of the particles, which vanishes in MPA capped ZnS due to the attachment of MPA. The peaks observed at 515 cm−1 and 643 cm−1 for the pure ZnS also disappeared in MPA coated samples because the adsorbed water molecules with hydrogen bond linkage are replaced by the S–H and S–O linkages confirming the surface attachment of MPA on the ZnS QD surface. The peaks situated in the range of 643 cm−1 is a characteristic peak of pure ZnS due to Zn–S stretching and the peak observed at 677 cm−1 in pure MPA is attributed to C![[double bond, length as m-dash]](https://www.rsc.org/images/entities/char_e001.gif) C. The peak observed at 670 cm−1 in MPA capped ZnS is a characteristic peak of the material due to the presence of ZnS and MPA. A schematic illustration (based on the FTIR results) of the binding of MPA on the ZnS surface is provided in Fig. 2c.
C. The peak observed at 670 cm−1 in MPA capped ZnS is a characteristic peak of the material due to the presence of ZnS and MPA. A schematic illustration (based on the FTIR results) of the binding of MPA on the ZnS surface is provided in Fig. 2c.
The surface morphology of ZnS QDs was probed using scanning electron microscopy and the images are shown in Fig. 2g. The results show that ZnS QDs exist as spherical clusters with a size of a few tens of nanometers. Fig. 2h shows the characteristic X-ray (EDAX) pattern of the QDs, which shows the presence of carbon and oxygen in ZnS QDs, confirming the conjugation of MPA on the ZnS QD surface.
From the analysis, it is clear that the modification with MPA didn't alter the structure of ZnS, which still exists in the cubic phase with an average particle size in the range of 4–6 nm. The FTIR and EDX results confirm the conjugation of MPA on the ZnS QD phase and hence the unit cell volume is 157.5 Å. From the morphological characterization, the average particle size is estimated to be 5 nm. From the elemental quantification data (Fig. 2j) (assuming sc close packing) it can be concluded that around 100 MPA molecules cover around a single ZnS QD of particle size 5 nm. From the HRTEM measurements, it is observed that ZnS quantum dots are covered by MPA molecules. A schematic illustration is provided.
ZnS QD-MPA is less toxic to BHK-21 cell harboring sustained DENV2 subgenomic replication (DV2-replicon cells)
We tested the cytotoxic effect of the ZnS QD-MPA conjugate in BHK-21 replicon cells hosting sustained replication of the DENV2 subgenome (DV2-replicon). The model system (DV2-replicon) was derived by an infectious clone technique using the transfection of naïve BHK21 cells with the in vitro transcribed DENV2 subgenome (∼11 kb).28 The advantage of the DV2-replicon model system is that it covers the various stages of the viral life cycle including the formation of intracellular replication complexes, and formation of both plus and minus-sense strand RNA treated with various concentrations (0, 2.5, 5,10, 100, 1000, 2000, and 3000 μM) of MPA or ZnS QDs or ZnS QD-MPA for 24 h.The cytotoxic effect of the cells was observed under a brightfield inverted microscope using 10× magnification (Fig. S5, ESI†). The cells were treated with different concentrations of the ZnS QDs or MPA or ZnS QD-MPA resulting in the morphological changes. The cells started to lose their viability with increased concentration of treatment. Interestingly, the cells treated with ZnS QDs showed no cytotoxicity up to a concentration of 3000 μM. Cytotoxicity was clearly visible upon treatment with MPA even at a significantly lower concentration such as 5 μM. Surprisingly, ZnS QD-MPA treatment of DV2-replicon cells showed no cytotoxicity up to a concentration of 2000 μM indicating the possibility of using ZnS QDs as an effective MPA drug delivery nanoplatform (Fig. 3a). The bright-field images showing the comparison of the cell morphology clearly indicates that the drug (MPA), when conjugated with ZnS QDs, reduces the cytotoxicity. In order to determine the cytotoxicity of these compounds at the cellular level, the MTT assay was also performed.
 | ||
| Fig. 3 Cell viability assay by MTT: the cytotoxicity of the ZnS QD, MPA, and ZnS QD-MPA was investigated in DV2-replicon cell lines. The cell line was incubated with these drugs at various concentrations (0–3000 μM) for a period of 24 h. Lethal Dose (LD50) of (a) ZnS QDs LD50 = 2969 ± 1.085 μM, (b) MPA LD50 = 3.823 ± 1.134 μM and (c) ZnS QD-MPA with LD50 = 1867 ± 1.099 μM. (d) The MPA conjugated with ZnS QD shows the higher LD50value which is relatively less toxic to the cells as compared to the free MPA(unconjugated). | ||
The cytotoxicity of MPA and ZnS QD-MPA was investigated in DV2-replicon cell lines using MTT assay. The cell line was incubated with MPA or ZnS QD-MPA at various concentrations (0–6 mM) for a period of 24 h. In order to quantify the toxicity, the mitochondrial activity of the cells was assessed with a colorimetric assay that is based on the reduction of yellow MTT (3-[4,5-dimethylthiazol-2-yl]-2,5-diphenyltetrazolium bromide) to purple formazan crystals by mitochondrial dehydrogenase enzymes.35
The cleavage of MTT occurs only in living cells so that the amount of the formazan crystals produced is proportional to the number of living cells. The data from the MTT assay after 24 h of exposure to these compounds are provided in Fig. 3 for the DV2-replicon cells. The cells incubated with MPA for 24 h showed a significant decrease in the mitochondrial activity with increasing concentration, whereas, in the presence of ZnS QD-MPA, the mitochondrial activity showed no difference up to 2000 μM. The data suggest that the quantum dot conjugated with MPA has relatively higher LD50 (1867 μM) as compared to the free drug MPA; LD50 (3.82 μM). The LD50 value is a measure of the drug concentration at which 50% of cells die. Therefore, the higher the LD50 value lower will be the toxicity.
In the current study, the results indicate that the conjugation of ZnS QDs with MPA rendered toxic MPA relatively less toxic in DV2-replicon cells (Fig. 3b–d). The control cells treated with plain ZnS QDs were also set up and in all the cases, the viability remained at values close to 100% suggesting that only the presence of the MPA and ZnS QD-MPA influences the reduction of cytotoxicity values. As supporting evidence, we conjugated the ZnS QDs with curcumin or celgosivir which are also known as antiviral drugs33,34 and the LD50 value was found to be significantly enhanced (Fig. S6, ESI†).
ZnS QD-MPA significantly enhances the selectivity index (SI50) of MPA
The DENV2 subgenome present in the DV2-replicon cells encodes the luciferase reporter enzyme as a measure of the DENV2 replication. The luciferase assay is a very sensitive method to study the transcriptional activity of a gene. The transcriptional activity of DENV2 was assayed by measuring the luciferase activity in the presence of a varying concentration of MPA or ZnS QD-MPA. The assay was carried out by using the luciferase assay kit in a multimode plate reader (Perkin Elmer, EnSpire multimode plate reader). The results showed that the free MPA has EC50 = 1.229 μM as compared to the ZnS QD-MPA; EC50 = 4.54 μM (Fig. 4b and c). | ||
| Fig. 4 Luciferase (RLuc) assay: the luciferase assay was carried out with MPA or ZnS QD-MPA in DV2-replicon cells. (a) Schematic representation of the RLuc assay. The Effective Concentration (EC50) of these compounds was determined to be (b) MPA EC50 = 1.229 ± 0.0814 μM and (c) ZnS QD-MPA EC50 = 4.543 ± 0.0368 μM. (d) Comparative graph of MPA and ZnS QD-MPA showing the minimal difference in EC50. (e) Safety index (SI50) of these compounds was calculated and presented in the table showing that the safety index window was increased in ZnS QD-MPA as compared to free MPA. | ||
EC50 is the concentration of the drug at which 50% of DENV2 replication is inhibited as measured by the luciferase activity (50% inhibition of luciferase activity). It is very important to note that the EC50 value was not significantly altered in the case of ZnS QD-MPA as compared to free MPA. However, the LD50 values of ZnS QD-MPA and free MPA were found to be 1867 μM and 3.82 μM respectively (Fig. 3c and d). This implies that the capping of MPA on ZnS QDs (ZnS QD-MPA) significantly reduced the toxicity of MPA without compromising the drug efficacy. This observation is further supported by the SI50 values of 3.11 and 410.9 for free MPA and ZnS QD-MPA respectively. The SI50 index is a ratio that measures the window between the cytotoxicity and antiviral activity. The higher SI50 value of ZnS QD-MPA indicates that the drug conjugate is less toxic and more potent against DENV2 (Fig. 4d).
The formula for calculations:
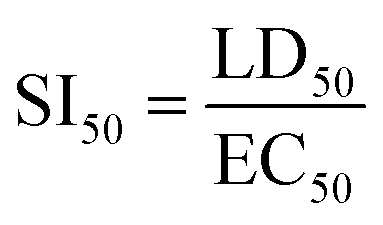
Drug release kinetics of MPA and ZnS QD-MPA
The drug release kinetics of MPA was analyzed to understand the reason for the reduction in toxicity of MPA upon conjugation with ZnS QD, as compared to free MPA. The assay was carried out in both acidic as well as neutral environments using phosphate buffers (pH 5/7.2). Fig. 5 clearly indicates that there is a significant reduction in the percent of drug release from ZnS QD-MPA at both pH 5 and 7.2 as compared to free MPA. It is noteworthy that even after 190 min, the concentration of free MPA drug in the dialysate is significantly lower in the case of the conjugated MPA drug (ZnS QD MPA) as compared to the non-conjugated MPA drug. This observation implies that the ZnS QD MPA is intact inside the dialysis bag owing to its relatively larger size without dissociating into Zn and S at endosomal (5) or cytosolic (7.2) pH. | ||
| Fig. 5 MPA and ZnS QD-MPA release kinetics in different phosphate buffer solutions (a) pH 5and (b) pH 7.2. Absorption was measured (300 nm) at specific time points. The absorbance was equated using a standard calibration curve. The X-axis indicates time (min); Y-axis indicates (%) of drug release. | ||
ZnS QD-MPA successfully inhibits DENV2 subgenomic RNA replication
ZnS QD-MPA is found to be very effective in inhibiting DENV2 replication evidenced by the aforesaid indirect measurements of the luciferase reporter gene expression. The findings were further analyzed by the direct measurements of the subgenomic replication using the immunostaining as well as qRT-PCR based quantification of DENV2 subgenomic RNA. Double-stranded RNA (dsRNA) replicative intermediates of DENV2 can be detected by using the J2 antibody which has become a gold standard tool for the detection of dsRNA. It was also used for the detection of dsRNA intermediates of viruses as diverse as Hepatitis C virus, rhinovirus, Chikungunya virus, Rabies virus, Poliovirus, Classic swine fever virus, and Brome mosaic virus.36,37 The visualization of DENV2 dsRNA within the DV2-replicon cells ensured the viral RNA synthesis and also the sites of replication. The confocal image analysis of untreated DV2-replicon cells identified viral RNA as puncta distributed throughout the cytoplasm, with accumulation near the perinuclear region (Fig. 6a). Interestingly, the DV2-replicon cells treated with free MPA or ZnS QD-MPA showed a significantly fewer number of puncta representing immunostained double-stranded DENV2 RNA (Fig. 6a). This observation indicates that ZnS QD-MPA is equally potent as free MPA (toxic) in inhibiting DENV2 replication.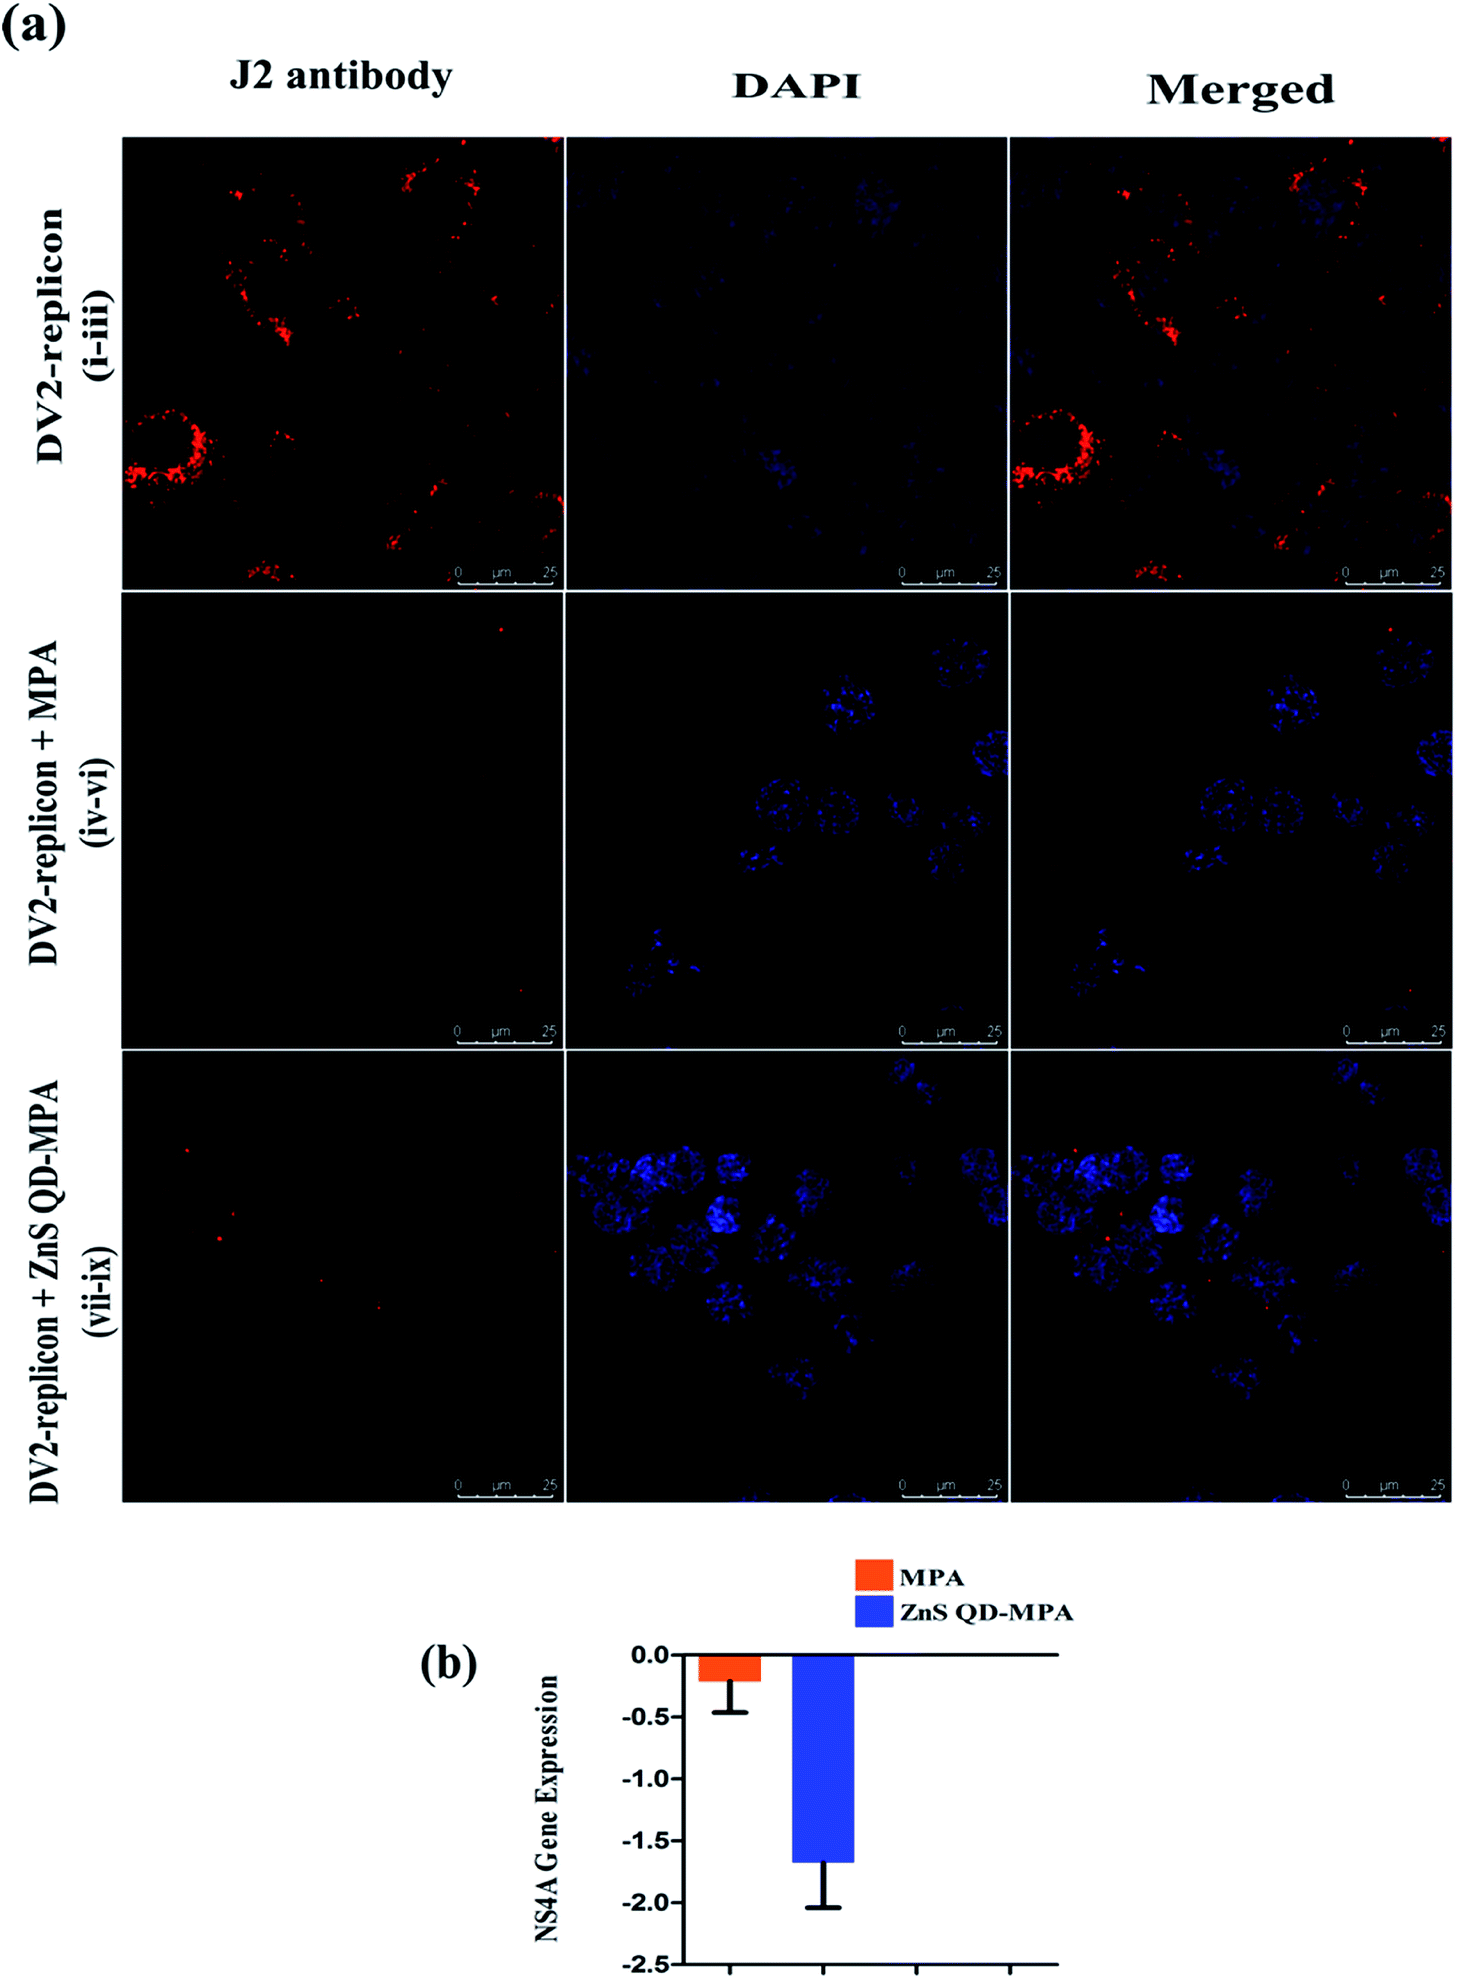 | ||
| Fig. 6 Inhibition of Dengue virus at the transcriptional level: (a) Co-localization of dengue double-stranded RNA (dsRNA) in DV2 replicon cells after treatment with ZnS QD-MPA. DV2-replicon cells containing dengue virus (panels i–iii) as the control, treated with MPA 1.229 μM (panel iv–vi) and ZnS QD-MPA 4.54 μM (panel vii–ix) were immunostained with a dsRNA specific J2 antibody (red) and counterstained with nuclear stained DAPI (blue). (b) The expression of the dengue non structural NS4A gene in DV2-replicon cells was analyzed using qRT-PCR after the treatment with MPA or ZnS QD-MPA for 24 h. The total RNA was extracted and the concentrations were analyzed. The expression of the NS4A gene was measured using the qRT-PCR system and performed in triplicate. The mRNA level of GAPDH was measured as an internal control. | ||
The qRT-PCR analysis data obtained from the treated DV2-replicon cells with MPA or ZnS QD-MPA are provided in Fig. 6b. The level of the NS4A gene transcription was significantly down-regulated in MPA (−0.215 fold) as well as ZnS QD-MPA (−1.674 fold) treated cells as compared to the untreated cells. Importantly, the down-regulation of the NS4A gene transcription in the presence of ZnS QD-MPA is higher (−7.78 fold) as compared to the free MPA (−0.215 fold). This confirms that ZnS QDs are a more effective nanoplatform for the delivery of anti-dengue viral drugs.39
ZnS QD-MPA effectively down-regulated the intracellular level of DENV2 NS3 protease
We next performed immunostaining of DENV2 NS3 protein, which is a key viral protease that plays a significant role in the processing of DENV polyprotein, a pre-requisite step for the virus replication. The confocal image (Fig. 7a) shows that the levels of NS3 protein were significantly reduced in both free MPA and ZnS QD-MPA treated DV2-replicon cells as compared to untreated cells. The intracellular level of NS3 protein was further analyzed using western blots. The analysis revealed that ZnS QD-MPA or free MPA treatment significantly reduced the expression level of NS3 protein in the DV2-replicon cells as compared to the untreated cells (Fig. 7b and c). Here, both confocal image-based analysis and western blot analysis indicated that there is a significant reduction in the expression level of the NS3 protease, translated by DENV2 subgenomic RNA, in the presence of free MPA or ZnS QD-MPA. This observation can be attributed to the decreased level of replication of the DENV2 subgenome in the presence of free MPA or ZnS QD-MPA as explained above.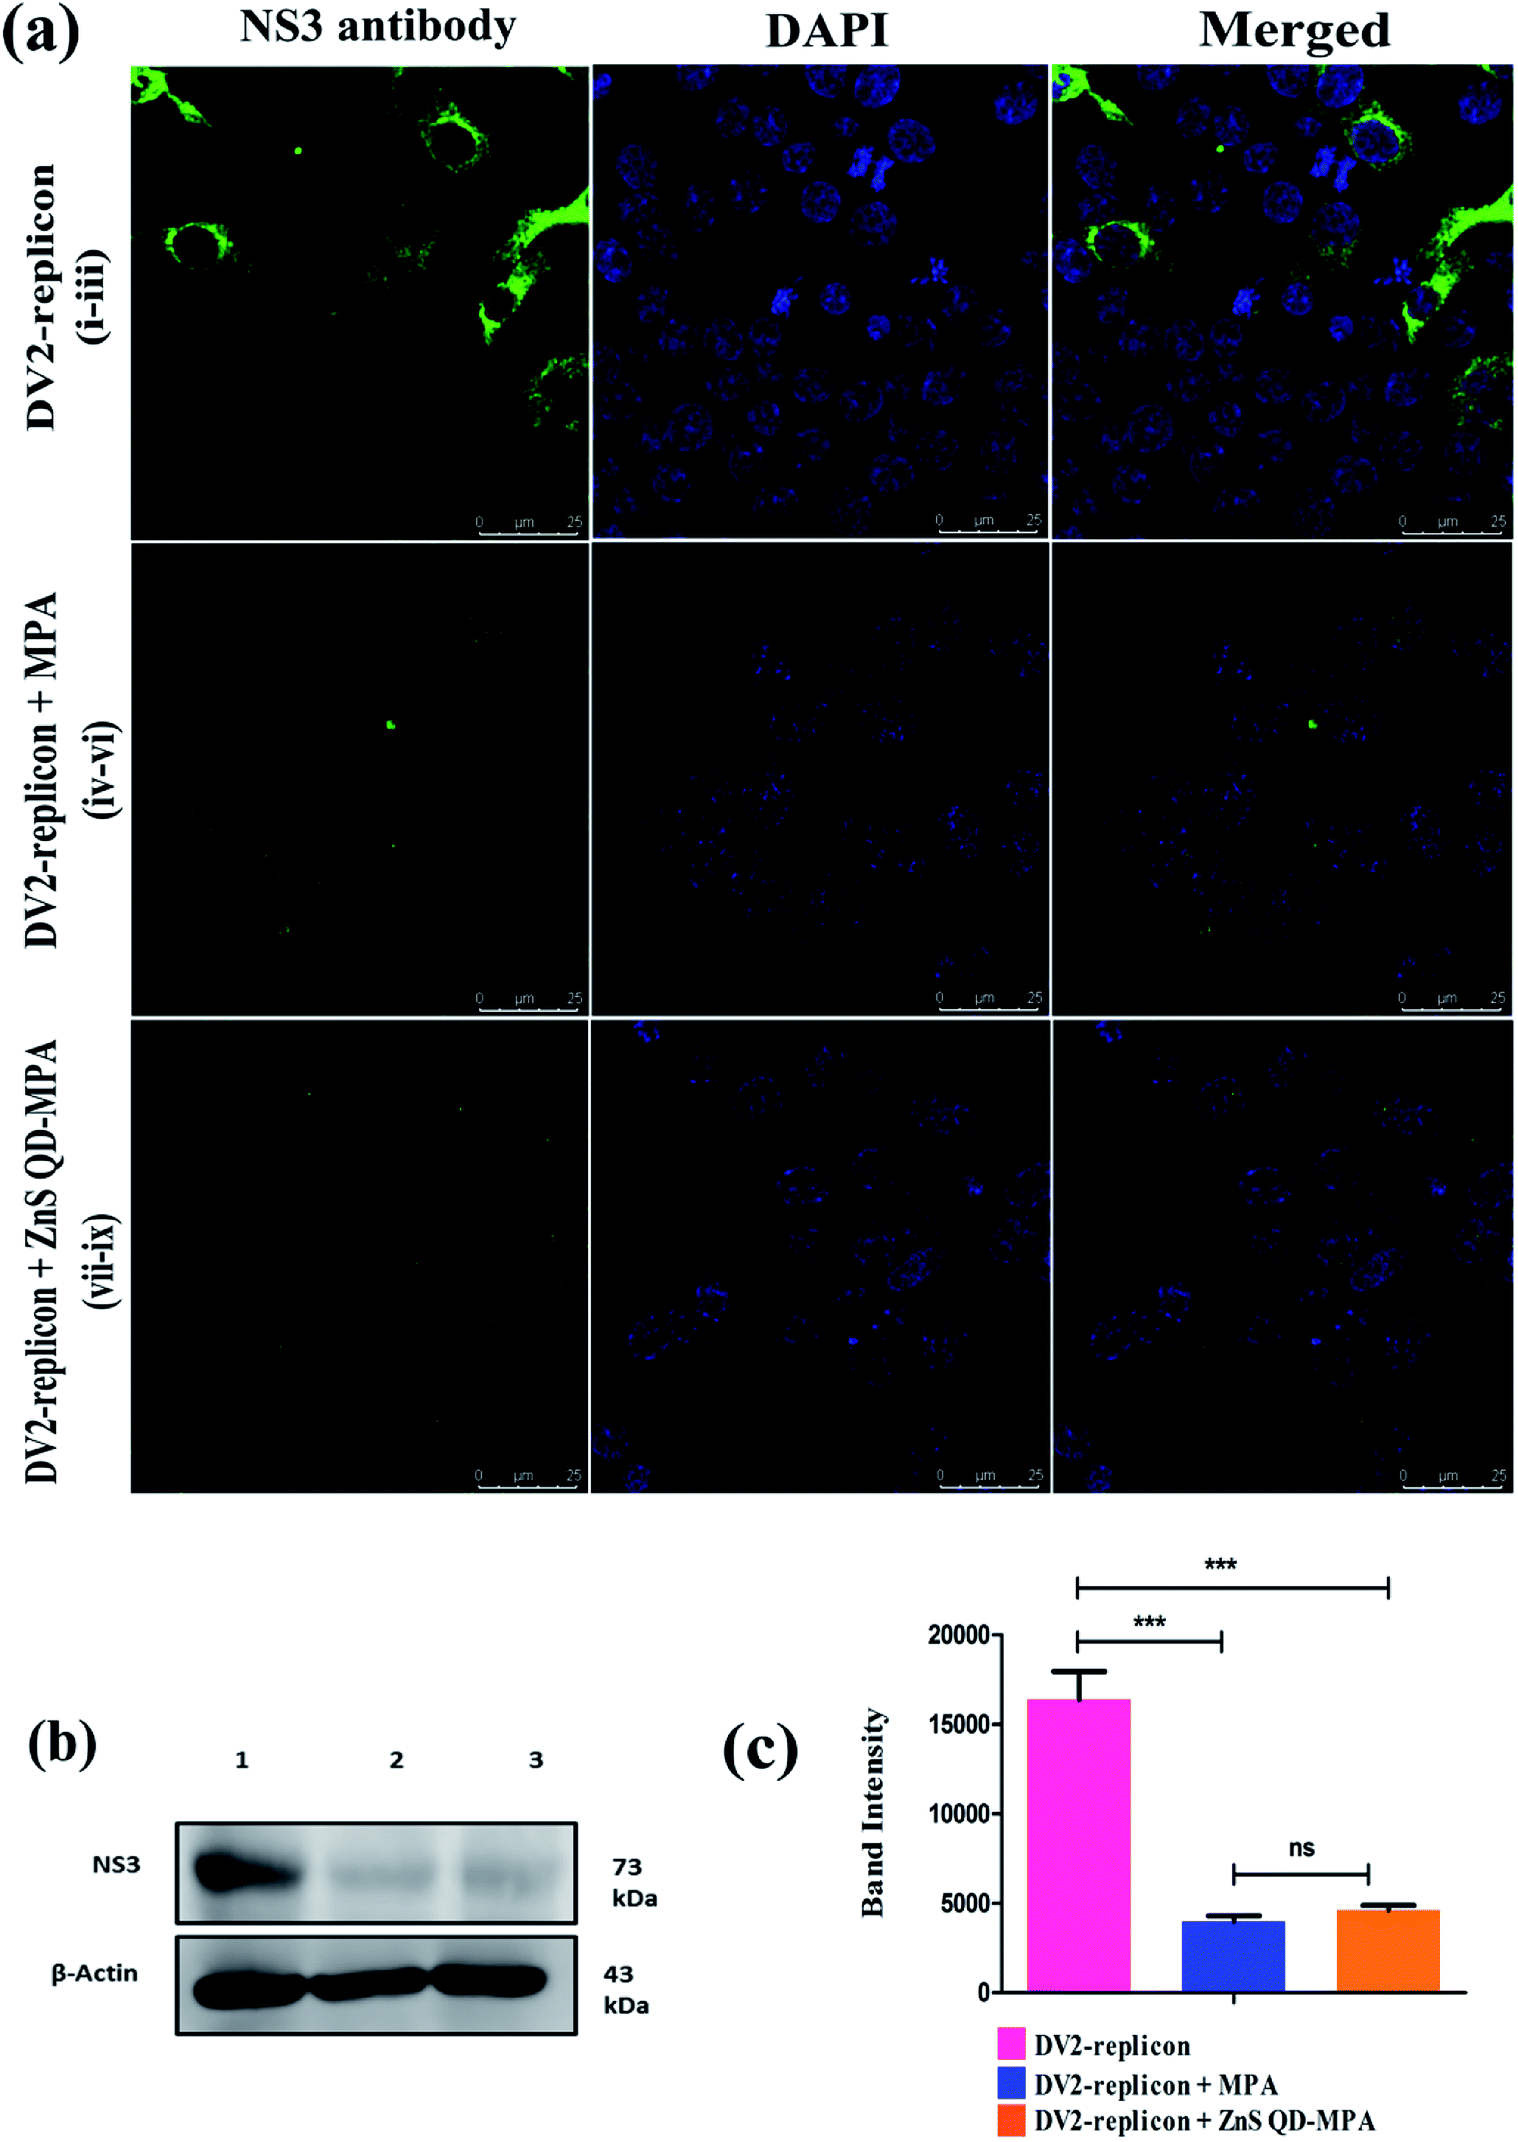 | ||
| Fig. 7 Inhibition of Dengue virus at the translational level: (a) immunofluorescence assay of inhibition of the viral protein expression by drugs, using DENV2 NS3 antibody (green). Concentration for drugs: (panel i–iii) without any treatment; (panel iv–vi) MPA 1.229 μM; (panel vii–ix) ZnS QD-MPA 4.54 μM; nuclei (blue) were stained in all immunofluorescence assays with DAPI stain solution. (b) Immunoblot of anti-dengue NS3 antibody: lane 1: shows the DV2 replicon without treatment; lane 2: DV2-replicon + MPA; lane 3: DV2-replicon + ZnS QD-MPA. (c) The immunoblot image analysis showed the significantly decreased expression of the dengue NS3 protein in DV2-replicon vs. treated with MPA or ZnS QD-MPA (P < 0.05). However there is no significant change of expression between treated MPA vs. ZnS QD-MPA. | ||
Conclusion
In summary, we engineered ZnS QDs for the effective delivery of an antiviral drug, targeting cytoplasmically replicating highly pathogenic Dengue virus. Dengue viral infections cause a looming public health threat resulting in significant morbidity and mortality. The size tuned ZnS QDs of 5 nm size were synthesized chemically, under controlled conditions for the conjugation of MPA, the anti-dengue viral drug. The coupling of MPA with ZnS QDs was confirmed by FTIR/EDAX and it was found that each ZnS QD was conjugated with 100 molecules of MPA. Interestingly, the conjugation of MPA with ZnS QDs dramatically reduced the toxicity of MPA in the cells hosting dengue virus replication, without compromising the efficiency of the drug against the virus. The selectivity index (SI50) of ZnS QD MPA was increased to an order of two (around 132 times) as compared to the plain drug, which was inherently found to be toxic to DV2-replicon cells in which dengue virus replicates. Zn2+ has a reported broad spectrum antiviral effect.40 We didn't observe any augmentation of the EC50 (a measure of the specific anti-dengue viral effect) value of the specific anti-dengue viral drug, mycophenolic acid, upon conjugation with ZnS-QDs (Fig. 4). This may be due to the fact that Zn2+ can only show the reported nonspecific and broad-spectrum antiviral effect inside the human body.40 This observation has been attributed to the slow and sustained release of the drug from the nanoformulation (ZnS QD-MPA) at pH 5 and pH 7.2 (Fig. 5). The inhibition of dengue virus replication by ZnS QD-MPA was evident by the reduced level of the double-stranded RNA intermediate and the viral protease (NS3) in the cytoplasm of the DV2-replicon cells. To the best of our knowledge, this is an unprecedented investigation on ZnS QD based nano-delivery of antiviral drugs against deadly pathogenic dengue virus. The study will pave the way to develop strategies for delivery of antiviral drugs using QDs, against other pathogenic viruses too.Conflicts of interest
There are no conflicts to declare.Acknowledgements
We acknowledge Prof. R. Padmanabhan for his kind gift of pRS424LucIRESNeoDen2 Plasmid. Dr. Rajendra Pilankatta and Dr. Swapna S. Nair acknowledge the establishments and facilities provided by the Central University of Kerala, India, and DBT India for the funding (6242-P52/RGCB/PMD/DBT/RPKT/2015). Dr. Rajendra Pilankatta also acknowledges DST-SERB India (DST No: SB/YS/LS-366/2013), the University Grants Commission (UGC, India) for the funding (UGC BSR Start-up F.20-1/2013), the Department of Science and Technology (DST, Govt. of India, Fast Track-YSS/2014/000436) and the Department of Biotechnology, Govt. of India. Manikanta Bayal acknowledges CSIR Ref No. [09/1108(0035)/2019-EMR-I], and Ranjeet Dungdung acknowledges the Rajiv Gandhi National Fellowship (RGNF) (Ref No: RGNF-2012-13-ST-ORI-30084) for research fellowship. Unnikrishnan Unniyampurath acknowledges the funding (Grant No. NRF2017/CRP001/034, SiT Decode) from NRF-Singapore.Notes and references
- K. M. Smith, C. C. Machalaba, R. Seifman, Y. Feferholtz and W. B. Karesh, One Health, 2019, 7, 100080 CrossRef.
- Y. Debing, J. Neyts and L. Delang, Curr. Opin. Infect. Dis., 2015, 28, 596–602 CrossRef CAS.
- L. Singh, H. G. Kruger, G. E. M. Maguire, T. Govender and R. Parboosing, Ther. Adv. Infect. Dis., 2017, 4, 105–131 CAS.
- M. Bayal, P. Janardhanan, E. Tom, N. Chandran, S. Devadathan, D. Ranjeet, U. Unniyampurath, R. Pilankatta and S. S. Nair, Nanotoxicology, 2019, 13, 1005–1020 CrossRef CAS.
- R. Singh and J. W. Lillard Jr, Exp. Mol. Pathol., 2009, 86, 215–223 CrossRef CAS.
- A. P. Singh, A. Biswas, A. Shukla and P. Maiti, Signal Transduction Targeted Ther., 2019, 4, 1–21 CrossRef CAS.
- C. Fonseca, S. Simões and R. Gaspar, J. Controlled Release, 2002, 83, 273–286 CrossRef CAS.
- H. S. Yoo, K. H. Lee, J. E. Oh and T. G. Park, J. Controlled Release, 2000, 68, 419–431 CrossRef CAS.
- D. Bhadra, S. Bhadra, S. Jain and N. K. Jain, Int. J. Pharm., 2003, 257, 111–124 CrossRef CAS.
- J. Panyam and V. Labhasetwar, Mol. Pharm., 2004, 1, 77–84 CrossRef CAS.
- R. Raj, P. Mongia, S. Kumar Sahu and A. Ram, Curr. Drug Targets, 2016, 17, 206–228 CrossRef CAS.
- F. Chiodo, M. Marradi, J. Calvo, E. Yuste and S. Penadés, J. Org. Chem., 2014, 10, 1339–1346 Search PubMed.
- I. V. Martynenko, A. P. Litvin, F. Purcell-Milton, A. V. Baranov, A. V. Fedorov and Y. K. Gun’ko, J. Mater. Chem. B, 2017, 5, 6701–6727 RSC.
- A. Gomase, S. Sangale, A. Mundhe, P. Gadakh and V. Nikam, J. Drug Delivery Ther., 2019, 9, 670–672 CrossRef.
- H. S. Mansur, Wiley Interdiscip. Rev.: Nanomed. Nanobiotechnol., 2010, 2, 113–129 CAS.
- H. S. Choi, W. Liu, P. Misra, E. Tanaka, J. P. Zimmer, B. Itty Ipe, M. G. Bawendi and J. V. Frangioni, Nat. Biotechnol., 2007, 25, 1165–1170 CrossRef CAS.
- K. L. Aillon, Y. Xie, N. El-Gendy, C. J. Berkland and M. L. Forrest, Adv. Drug Delivery Rev., 2009, 61, 457–466 CrossRef CAS.
- M. Singhal, J. K. Sharma, H. C. Jeon, T. W. Kang and S. Kumar, Adv. Appl. Ceram., 2019, 118, 321–328 CrossRef CAS.
- P. Wu, T. Zhao, Y. Tian, L. Wu and X. Hou, Chem.–Eur. J., 2013, 19, 7473–7479 CrossRef CAS.
- P. Zrazhevskiy and X. Gao, Nano Today, 2009, 4, 414–428 CrossRef CAS.
- M. G. Guzman, D. J. Gubler, A. Izquierdo, E. Martinez and S. B. Halstead, Nat. Rev. Dis. Primers, 2016, 2, 16055 CrossRef.
- N. R. Manchala, R. Dungdung and R. Pilankatta, Trop. Med. Int. Health, 2017, 22, 1334–1342 CrossRef CAS.
- D. J. Gubler, Clin. Microbiol. Rev., 1998, 11, 480–496 CrossRef CAS.
- S. B. Halstead, Lancet, 2007, 370, 1644–1652 CrossRef.
- S. P. Lim, Q. Y. Wang, C. G. Noble, Y. L. Chen, H. Dong, B. Zou, F. Yokokawa, S. Nilar, P. Smith, D. Beer, J. Lescar and P. Y. Shi, Antiviral Res., 2013, 100, 500–519 CrossRef CAS.
- J. G. Low, E. E. Ooi and S. G. Vasudevan, J. Infect. Dis., 2017, 215, 96–102 CrossRef.
- M. N. Reddy, R. Dungdung, L. Valliyott and R. Pilankatta, PeerJ, 2017, 5, e2970 CrossRef.
- R. Takhampunya, S. Ubol, H. S. Houng, C. E. Cameron and R. Padmanabhan, J. Gen. Virol., 2006, 87, 1947–1952 CrossRef CAS.
- M. S. Diamond, M. Zachariah and E. Harris, Virology, 2002, 304, 211–221 CrossRef CAS.
- D. W. Mudge, B. A. Atcheson, P. J. Taylor, P. I. Pillans and D. W. Johnson, Ther. Drug Monit., 2004, 26, 453–455 CrossRef.
- W. Arns, Transplant. Proc., 2007, 39, 88–93 CrossRef CAS.
- S. Yedurkar, C. Maurya and P. Mahanwar, Open J. Synth. Theory Appl., 2016, 5, 1–14 CrossRef CAS.
- J. G. Low, C. Sung, L. Wijaya, Y. Wei, A. P. S. Rathore, B. H. Watanabe, B. H. Tan, L. Toh, L.T. Chua, Y. Hou, A. Chow, S. Howe, W. K. Chan, K. H. Tan, J. S. Chung, B. P. Cherng, D. C. Lye, P. A. Tambayah, L. C. Ng, J. Connolly, M. L. Hibberd, Y. S. Leo, Y. B. Cheung, E. E. Ooi and S. G. Vasudevan, Lancet infect. Dis., 2014, 14, 706–715 CrossRef CAS.
- A. Balasubramanian, R. Pilankatta, T. Teramoto, A. M. Sajith, E. Nwulia, A. Kulkarni and R. Padmanabhan, Antiviral Res., 2019, 162, 71–78 CrossRef CAS.
- C. S. Teo and J. J. Chu, J. Virol., 2014, 88, 1897–1913 CrossRef.
- F. Weber, V. Wagner, S. B. Rasmussen, R. Hartmann and S. R. Paludan, J. Virol., 2006, 80, 5059–5064 CrossRef CAS.
- K. N. Son, Z. Liang and H. L. Lipton, J. Virol., 2015, 89, 9383–9392 CrossRef CAS.
- M. Sethi, R. Sukumar, S. Karve, M. E. Werner, E. C. Wang, D. T. Moore, S. R. Kowalczyk, L. Zhang and A. Z. Wang, Nanoscale, 2014, 6, 2321–2327 RSC.
- C. M. Lee, X. Xie, J. Zou, S. H. Li, M. Y. Lee, H. Dong, C. F. Qin, C. Kang and P. Y. Shi, J. Virol., 2015, 89, 6171–6183 CrossRef CAS.
- S. A. Read, S. Obeid, C. Ahlenstiel and G. Ahlenstiel, Adv. Nutr., 2019, 10, 696–710 CrossRef.
Footnotes |
| † Electronic supplementary information (ESI) available. See DOI: 10.1039/d0na00725k |
| ‡ The first and second authors contributed equally to this work. |
| This journal is © The Royal Society of Chemistry 2020 |