Inter-overlapped MoS2/C composites with large-interlayer-spacing for high-performance sodium-ion batteries†
Yinghui
Wang
a,
Ya
Yang
a,
Deyang
Zhang
*a,
Yangbo
Wang
a,
Xiaoke
Luo
b,
Xianming
Liu
 c,
Jang-Kyo
Kim
 d and
Yongsong
Luo
 *ae
*ae
aKey Laboratory of Microelectronics and Energy of Henan Province, Henan Joint International Research Laboratory of New Energy Storage Technology, School of Physics and Electronic Engineering, Xinyang Normal University, Xinyang 464000, P. R. China. E-mail: ysluo@xynu.edu.cn; zdy@xynu.edu.cn; Tel: +86 376 6390801
bSchool of Information Engineering, Zhengzhou University, Zhengzhou 450001, P. R. China
cCollege of Chemistry and Chemical Engineering, Luoyang Normal University, Luoyang 471934, P. R. China
dDepartment of Mechanical and Aerospace Engineering, Hong Kong University of Science and Technology, Clear Water Bay, Kowloon, Hong Kong, P. R. China
eCollege of Physics and Electronic Engineering, Nanyang Normal University, Nanyang 473061, P. R. China
First published on 20th May 2020
Abstract
As a two-dimensional layered material with a structure analogous to that of graphene, molybdenum disulfide (MoS2) holds great promise in sodium-ion batteries (SIBs). However, recent research findings have revealed some disadvantages in two-dimensional (2D) materials such as poor interlayer conductivity and structural instability, resulting in poor rate performance and short cycle life for SIBs. Herein, we designed MoS2 nanoflowers with an ultra-wide spacing interlayer (W-MoS2/C) anchored on special double carbon tubes to construct three-dimensional (3D) nanostructures. When tested as an anode material in a SIB, the as-prepared CNT@NCT@W-MoS2/C sample achieves high capacities (530 and 230 mA h g−1 at current densities of 0.1 and 2 A g−1, respectively). Density functional theory (DFT) calculations demonstrate that the ultra-wide spacing MoS2/C structure is beneficial for the chemical adsorption of sodium ions and facilitates redox reactions. The wide interlayer spacing and the presence of an intermediate carbon layer provide a rapid diffusion channel for ions and offer a free space for volume expansion of the electrode material.
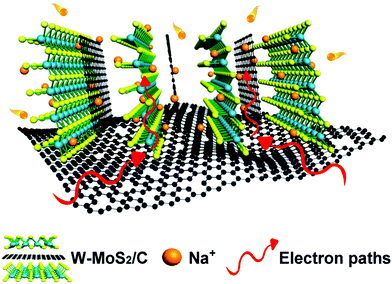
New concepts2D transition metal dichalcogenides (TMDCs) such as MoS2 with an analogous structure to graphene have received great attention as one of the most promising materials for sodium-ion batteries. We introduce polymer-derived carbon embedded in the MoS2 layer to obtain materials with an ultra-wide spacing MoS2/C structure. Electrochemical tests demonstrate that the expanded interlayer spacing can facilitate the insertion/extraction of Na+ and the ion transport during the charge and discharge process. In addition, the conductivity of the MoS2 is also improved by the presence of interlayer derived carbon, which means that the electron transport rate in electrochemical reactions will be improved. Furthermore, the density functional theory (DFT) calculation of sodium storage on W-MoS2/C inter-overlapped layers reveals that this structure has significantly improved the adsorption and diffusion of sodium ions, compared with the normal MoS2. This work improves the performance of sodium-ion batteries by adjusting the structure of MoS2, which provides new insights into the structural design of 2D materials. |
1. Introduction
Sodium-ion batteries (SIBs) have attracted great interest as a substitute for lithium-ion batteries (LIBs). This is because SIBs have the potential for new possibilities in future development compared to LIBs that have been extensively studied.1–3 However, the radius of Na+ (1.02 Å) is almost twice that of Li+ (0.76 Å), the reaction kinetics will be slower and the electrode material will face more severe volume expansion in SIBs.4–6 2D transition metal dichalcogenides (TMDCs) such as MoS2 with a structure analogous to that of graphene have received great attention due to their structure and some special properties in physics and chemistry. As a typical 2D material, the 2H phase MoS2 consists of three layers, the Mo–S–Mo unit in the layer is strongly covalently bonded, and the inter-layer is weak van der Waals interactions.7–9 The high theoretical-specific capacity (670 mA h g−1), and 2D layered structure render MoS2 a desirable electrode material in SIBs. However, the real application of 2D MoS2 is limited by some of its intrinsic properties. Firstly, bulk MoS2 is a semiconductor with a bandgap of approximately 1.29 eV.10 Poor conductivity affects the transport of ions and electrons in MoS2. Secondly, thermodynamically, 2D layers are easy to restack along the c-axis forming a bulk material during sodium insertion and extraction.11 Thirdly, the large volume variation and mechanical stress during sodiation/desodiation will lead to the fall off and pulverization of the active material on the current collector, affecting the cycle stability.12–14In order to solve the above-mentioned challenges, previous research strategies have mainly focused on the construction of various nanoscale structures of MoS2 and the study of MoS2/carbon composites, such as graphene/MoS2,15,16 carbon nanotubes (CNTs)/MoS2,17,18 and porous carbons/MoS2.19–21 In addition, the preparation of few-layered MoS2 with increased reaction sites and inter-layer spacing to increase the diffusion coefficient of Na+ can also improve the performance of the battery.22–25 For instance, few-layer MoS2 nanosheets have been successfully synthesized via a simple and scalable ultrasonic exfoliation technique.26 Due to the intercalation of formamide, the number of layers of MoS2 is greatly reduced, and the interlayer spacing is increased from 0.62 to 0.638 nm. Benefiting from these special structures, the ultrathin MoS2 nanosheet electrode exhibits a sodium storage capacity of 386 mA h g−1 after 100 cycles at 40 mA g−1. Therefore, combining with various carbon materials, expanding the spacing of the MoS2 layer could be an effective way to improve the Na+ storage properties of TMDCs.
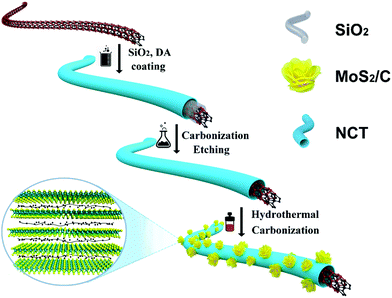
Herein, we report a “bottom-up” strategy for the synthesis of ultra-wide interlayer spacing MoS2 flowers (W-MoS2/C) anchored on special double-layer carbon tubes to construct three-dimensional (3D) nanostructures. This special double-layer carbon tube (CNT@NCT), is manufactured through the sacrificial template method and consists of a hollow nitrogen-doped carbon tube (NCT) nested outside a carbon nanotube (CNT). Subsequently, CNT@NCT@W-MoS2/C was fabricated through the in situ nucleation and growth of MoS2 monolayers on polyvinyl pyrrolidone and CNT@NCT. The critical feature of the CNT@NCT@W-MoS2/C for boosting SIB performance is the polymer-derived carbon embedded in the MoS2 layer, which facilitates the insertion/extraction of Na+ and the ion transport during the charge and discharge process. Consequently, the CNT@NCT@W-MoS2/C hybrids exhibited higher capacity and excellent cycling stability compared to CNT@NCT@MoS2 when used as an SIB anode material. Electrochemical characterization and density functional theory (DFT) calculations were performed to demonstrate the Na+ storage mechanism and the rational design of the conductivity.
2. Experimental section
2.1 Sample preparation
2.2 Material characterization
The crystalline structure and phase of the composites were identified by X-ray diffraction (XRD, D8-Advance (Bruker) automated X-ray diffractometer system) using Cu-Kα (λ = 1.5418 Å) radiation at 40 kV and 40 mA, with 2θ between 5° and 80° at room temperature. Raman spectroscopy was carried out using an INVIA Raman microprobe (Renishaw Instruments) with a 532 nm laser source, a 50× objective lens and a laser power of 10%. The chemical elements were analyzed by X-ray photoelectron spectroscopy (XPS, PerkinElmer model PHI 5600) with a resolution of 0.3–0.5 eV from a monochromated aluminum anode X-ray source. The thermogravimetric (TG) analyzer curve was obtained using an STA449F5 (NETZSCH) with 100 mL min−1 of oxygen flow from 20 °C to 800 °C at a heating rate of 10 °C min−1. The morphologies were examined on a field emission scanning electron microscope (FESEM, JEOL S-4800) and a transmission electron microscope (TEM, JEOL JEM-2010).2.3 Electrochemical measurements
The slurry was prepared using active material, acetylene black and polyvinylidene fluoride (PVDF) binder at a weight ratio of 7![[thin space (1/6-em)]](https://www.rsc.org/images/entities/char_2009.gif) :
:![[thin space (1/6-em)]](https://www.rsc.org/images/entities/char_2009.gif) 2
2![[thin space (1/6-em)]](https://www.rsc.org/images/entities/char_2009.gif) :
:![[thin space (1/6-em)]](https://www.rsc.org/images/entities/char_2009.gif) 1. The material was mixed and milled after adding N-methyl-2-pyrrolidone (NMP) as a solvent. Next, the obtained slurry was cast onto copper foil substrates and dried at about 80 °C overnight. After the organic solvent was evaporated, the electrode film was cut to sheets 14 mm in diameter and then dried at 60 °C under vacuum for 12 h. The areal density of active material for each electrode is ∼0.4 mg cm−2. The electrochemical properties of SIBs were measured using 2032-type coin cells, which were prepared using a sodium metal sheet as the counter, with glass fiber membrane (Whatman, GF/D) as the separator. The electrolyte was 1 M NaClO4 in EC
1. The material was mixed and milled after adding N-methyl-2-pyrrolidone (NMP) as a solvent. Next, the obtained slurry was cast onto copper foil substrates and dried at about 80 °C overnight. After the organic solvent was evaporated, the electrode film was cut to sheets 14 mm in diameter and then dried at 60 °C under vacuum for 12 h. The areal density of active material for each electrode is ∼0.4 mg cm−2. The electrochemical properties of SIBs were measured using 2032-type coin cells, which were prepared using a sodium metal sheet as the counter, with glass fiber membrane (Whatman, GF/D) as the separator. The electrolyte was 1 M NaClO4 in EC![[thin space (1/6-em)]](https://www.rsc.org/images/entities/char_2009.gif) :
:![[thin space (1/6-em)]](https://www.rsc.org/images/entities/char_2009.gif) diethyl carbonate (DEC) (1
diethyl carbonate (DEC) (1![[thin space (1/6-em)]](https://www.rsc.org/images/entities/char_2009.gif) :
:![[thin space (1/6-em)]](https://www.rsc.org/images/entities/char_2009.gif) 1 in volume) with 10 wt% fluoroethylene (FEC). Cyclic voltammetry (CV) was carried out on a VMP3 electrochemical workstation under different scanning speeds. Electrochemical impedance spectroscopy (EIS) was performed by applying a sine wave with an amplitude of 0.5 mV over the frequency range of 0.01 Hz–100 kHz. Charge/discharge tests were carried out on a Neware battery testing system in the potential range of 0.01–3.0 V.
1 in volume) with 10 wt% fluoroethylene (FEC). Cyclic voltammetry (CV) was carried out on a VMP3 electrochemical workstation under different scanning speeds. Electrochemical impedance spectroscopy (EIS) was performed by applying a sine wave with an amplitude of 0.5 mV over the frequency range of 0.01 Hz–100 kHz. Charge/discharge tests were carried out on a Neware battery testing system in the potential range of 0.01–3.0 V.
2.4 DFT calculations
All the spin-polarized calculations were performed with the Perdew–Burke–Ernzerhof (PBE) function within the generalized gradient approximation using the VASP code. The energy cutoff was at 450 eV. The occupancy of the one-electron states was calculated using Gaussian smearing (SIGMA = 0.05 eV). The geometry structure was fully optimized until the Feynman forces on each ion were less than 0.01 eV Å−1. The energy was optimized until the difference between two steps was less than 10−5 eV. The van der Waals interactions were considered by adopting the dispersion correction by virtue of the DFT-D2 approach. As for periodic interface model construction, to minimize the lattice mismatch between MoS2 and G, a suitable slab containing a p(3 × 3) bilayer-MoS2 and p(4 × 4) G sandwich structure was adopted. The vacuum between slabs is ∼15 Å to avoid unnecessary interaction. A 3 × 3 × 1 k-points mesh was used during optimizations.3. Results and discussion
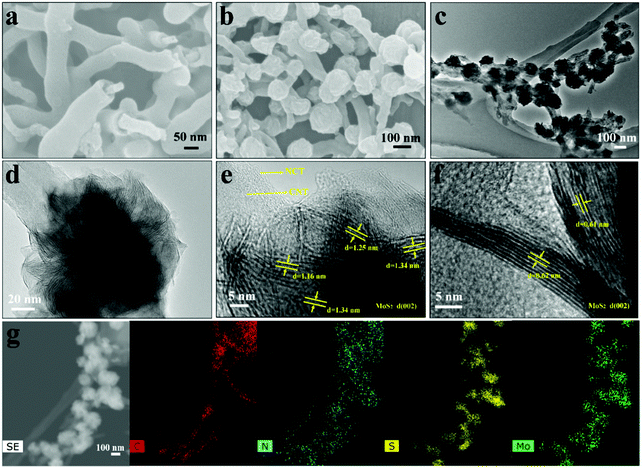
Fig. 1 illustrates the synthetic process of the CNT@NCT@W-MoS2/C. Briefly, the CNT@NCT were fabricated by two steps involving SiO2 and carbon layer coating on CNTs and the subsequent SiO2 layer removal. Then, the CNT@NCT@W-MoS2/C composites were obtained through the in situ nucleation and growth of MoS2 monolayers on polyvinyl pyrrolidone molecules and CNT@NCT.For morphological analysis of CNT@NCT@W-MoS2/C, scanning electron microscopy (SEM) and transmission electron microscopy (TEM) coupled high-resolution transmission electron microscopy (HRTEM) were carried out. Fig. 2a and b show the SEM images of CNT@NCT and CNT@NCT@W-MoS2/C, respectively. The free space between CNT and NCT can be clearly seen (Fig. 2a), which proves the successful synthesis of CNT@NCT. After the growth of MoS2 on the CNT@NCT surface (Fig. 2b), we can see that many nanospheres are uniformly distributed on the CNT@NCT surface, and the diameter of the nanospheres is about 100 nm. However, through further investigation by TEM (Fig. 2c and d), we found that the morphology of MoS2 is not a nanosphere, but a nanoflower consisting of many MoS2 layers. The bright and dark contrast difference in the MoS2 nanoflowers reflects the varying degrees of overlap between MoS2 nanolayers. At the same time, from Fig. S1b and c (ESI†) we can see that although the morphologies of MoS2 and W-MoS2/C are almost the same from the SEM images, MoS2 is composed of several dense layers from the TEM images. The HRTEM images of the CNT@NCT@W-MoS2/C and CNT@NCT@MoS2 are shown in Fig. 2e and f. By comparing the two pictures, we find that the interlayer spacing of W-MoS2/C nanoflowers measured from Fig. 2e is about 1.25 nm while the MoS2 nanoflowers have a conventional structure with d(002) = 0.64 nm (Fig. 2f). These results demonstrate that by adding polymer molecules, we have successfully prepared MoS2, which has an enlarged interlayer spacing. The expanded interlayer spacing can offer abundant active sites for faradaic redox reactions and reduce the Na+ diffusion resistance. In addition, the conductivity of the MoS2 is also improved by the presence of interlayer derived carbon, which means that the electron transport rate in electrochemical reactions will be improved. Furthermore, we investigated the elemental distribution of CNT@NCT@W-MoS2/C, as shown in Fig. 2g.
The crystalline structures of the CNT@NCT@W-MoS2/C, CNT@NCT@MoS2 and pristine CNT were characterized by XRD. From Fig. 3a, a sharp diffraction peak at 26.1° was found, which should be attributed to the (002) plane of CNTs. As shown in Fig. 3a, the diffraction peaks of CNT@NCT@MoS2 can be readily indexed to the hexagonal MoS2 (JCPDS card No. 37-1492), and the d(002)-spacing of MoS2 is calculated to be 0.62 nm. For the CNT@NCT@W-MoS2/C, the 14.378° peak of MoS2 cannot be found, and two new peaks at 6.438° (*1) and 12.98° (*2) are observed. The disappearance of the 14.378° peak means that the structure of the MoS2 in the CNT@NCT@W-MoS2/C composites is single or few layers.27 The d-spacings of peak *1 and *2 were calculated using the Bragg equation, and are approximately 13.52 Å and 6.68 Å. The d-spacing of peak *1 is attributed to the diffraction from the adjacent MoS2 layers, which indicates that the PVP-derived carbon causes the expansion of the MoS2 sheets.28,29 The d-spacing of peak *2 is about 6.68 Å, which is related to the spacing between the MoS2 layer and PVP-derived carbon layer, and it is exactly half of the spacing of the two MoS2 layers. This result is in accordance with the TEM image.
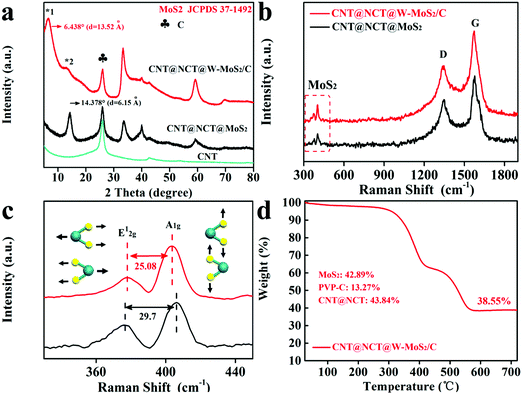 | ||
| Fig. 3 (a) XRD patterns of the CNT, CNT@NCT@MoS2 and CNT@NCT@W-MoS2/C. (b and c) Raman spectrum of the CNT@NCT@MoS2 and CNT@NCT@W-MoS2/C. (d) TGA curves of CNT@NCT@W-MoS2/C. | ||
As displayed in Fig. 3b, two peaks appearing at 1346 cm−1 (the D band) and 1581 cm−1 (the G band) correspond to carbon. The characteristic peaks at 378 cm−1 and 403 cm−1 correspond to the in-plane vibration of Mo and S atoms (E12g) and the out-of-plane vibration of S atoms (A1g), respectively. In addition, it can be seen from Fig. 3c that the differences (Δk) between the E12g and A1g peaks of the CNT@NCT@W-MoS2/C and CNT@NCT@MoS2 are 25.08 cm−1 and 29.70 cm−1, respectively. The Δk is closely related to the layer number and the thickness of MoS2, and it increases as the layer number increases.30,31 Therefore, we can conclude that W-MoS2/C not only has a larger interlayer spacing but also a lower number of layers than conventional MoS2. To further prove that PVP-derived carbon exists between the layer of MoS2 nanosheets, we performed Raman testing for W-MoS2/C and pure MoS2. As displayed in Fig. S2 (ESI†), both W-MoS2/C and pure MoS2 have characteristic peaks of MoS2, and only W-MoS2/C has characteristic peaks of carbon. Thus, we can conclude that there is PVP-derived carbon in W-MoS2/C. To check the MoS2 content in the CNT@NCT@W-MoS2/C composites, the CNT@NCT@W-MoS2/C, W-MoS2/C and pure MoS2 were characterized by thermogravimetric (TG) analysis in an oxygen atmosphere. From the TG analysis (Fig. 3d), it can be calculated that the MoS2 content is 42.89% (Please check the calculation details in the ESI†). The typical XPS survey spectrum reveals that the CNT@NCT@W-MoS2/C mainly consists of Mo, S, C, and N elements (Fig. S3a, ESI†). The corresponding elemental compositions are given in Table S1 (ESI†). As observed in Fig. S3c (ESI†), the N 1s XPS peaks can be deconvoluted into four peaks at 394.8, 398.2, 400.3, and 401.5 eV, indexing to Mo 2p3/2, pyridinic-N, pyrrolic-N, and graphitic-N, respectively.30 In the Mo 3d spectrum (Fig. S3d, ESI†), the peaks located at 228.9, 232.1, and 235.3 eV correspond with Mo 3d5/2, Mo 3d3/2, and Mo6+, respectively, while the peak at 226.1 eV is indexed to S 2s.32
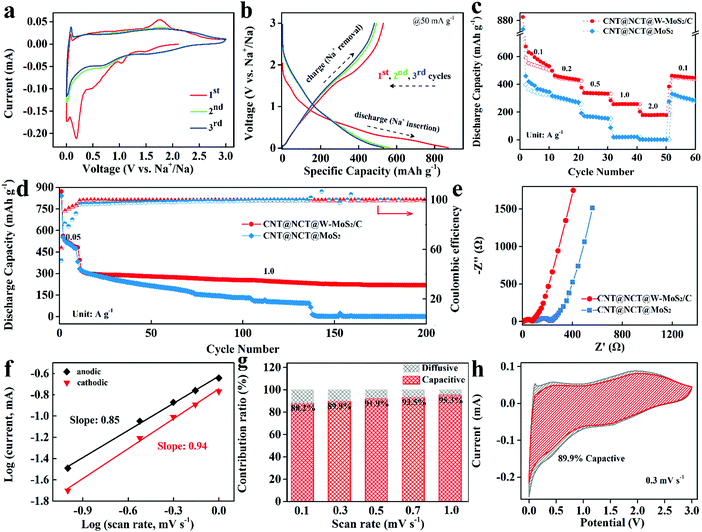
To explore the potential of the 3D CNT@NCT@W-MoS2/C composites as anode materials for SIBs, the electrochemical properties were evaluated by using coin-type cells in a voltage range of 0.01–3.0 V. Fig. 4a shows the first, second, and third cyclic voltammetry (CV) cycles of the 3D CNT@NCT@W-MoS2/C composites at a scan rate of 0.1 mV s−1 between 0.01 V and 3.0 V versus Na/Na+. For the initial cathodic scan, a sharp peak and three small peaks can be observed around 0.02, 0.23, 0.5 and 1.2 V, respectively. The peaks around 0.5 and 1.2 V correspond to the Na+ insertion into MoS2 (eqn (1)) and the formation of solid–electrolyte interface (SEI), respectively. The sharp peak around 0.23 V was ascribed to the conversion-type reaction accompanied by the formation of metallic (Mo) and Na2S (eqn (2)).33 The last small cathodic peak at around 0.02 V can be associated with the intercalation of Na+ into the carbon.34 In the anodic scan, a small peak at 0.1 V was ascribed to the Na+ extraction from carbon and a broad oxidation peak was observed at 1.79 V attributed to the oxidation of metallic Mo to MoS2. Compared to the next two cycles, the irreversible peaks correspond to the decomposition of electrolyte to form SEI films, resulting in irreversible capacity loss. The electrochemical performance of the CNT@NCT@W-MoS2/C electrode was further investigated by galvanostatic charge/discharge measurements. As shown in Fig. 4b, the CNT@NCT@W-MoS2/C exhibits initial discharge and charge capacities of 872 mA h g−1 and 530 mA h g−1, corresponding to a coulombic efficiency of 60.8%. The irreversible capacity in the first cycle can be mainly attributed to the formation of the SEI layer.
| MoS2 + xNa+ + xe− → NaxMoS2 | (1) |
| NaxMoS2 + (4 − x)Na+ + (4 − x)e− → Mo + 2Na2S | (2) |
To further demonstrate the role of the derived carbon layer in the MoS2 layer, the electrochemical impedance spectra (EIS) measurements of the CNT@NCT@W-MoS2/C and CNT@NCT@MoS2 were performed at open-circuit voltage in a frequency range from 100 kHz to 0.01 Hz at 5 mV amplitude (Fig. 4e). The diameter of the semicircle in the high-middle frequency region corresponds to the charge transfer resistance (Rct) at the electrode–electrolyte interface. The CNT@NCT@W-MoS2/C electrode shows a smaller diameter, reflecting faster charge transfer and higher conductivity than the CNT@NCT@MoS2 electrode.35 This is due to the insertion of the PVP-derived carbon expanding the interlayer spacing of MoS2, thereby increasing the contact area between the electrode material and the electrolyte, and providing a large number of active sites for charge transfer. In the low-frequency region of the Nyquist plots, the CNT@NCT@W-MoS2/C electrode also shows a larger slope than the CNT@NCT@MoS2, relating to smaller Warburg impedance (Zw). Small Zw means that the CNT@NCT@W-MoS2/C electrode has a faster Na+ diffusion rate, which is due to the expanding interlayer and the 3D nanostructure.
The galvanostatic charge/discharge profiles of the CNT@NCT@W-MoS2/C show a continuous slope without exhibiting a distinct plateau region, which is a feature of charging/discharging of capacitors. To evaluate the contribution of capacitive charge storage, its ratio was calculated based on the CV data. Fig. S5 (ESI†) shows the CV curves of CNT@NCT@W-MoS2/C at scan rates from 0.1 to 1.0 mV s−1. The relationship (i = aυb, where a and b are appropriate parameters) between the peak current (i) and the sweep rate (υ) could be revealed by the power law. The b value approaches 0.5 corresponding to the diffusion-controlled process, whereas 1 suggests a surface-controlled process. As shown in Fig. 4f, the b values for anodic and cathodic peaks were determined as 0.85 and 0.94, respectively. This implies that the surface-controlled process dominates during an electrochemical reaction. More specifically, the ratio of capacitive contribution can be quantitatively analyzed through the method proposed by Dunn:36
| i = k1υ + k1υ1/2 |
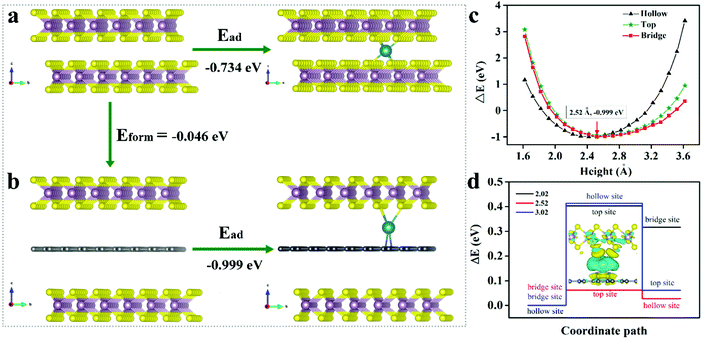
To better understand the positive influences of MoS2 with expanded interlayer spacing and derived carbon for Na+ storage, extensive density functional theory (DFT) calculations were implemented via a periodic slab model. Since the derived carbon layer obtained from PVP is not well defined, it is difficult to construct an appropriate model. Based on previous literature related to TMD/C,28,41–45 we simplified our carbon layer to graphene. We calculated the formation energy of intercalating graphene into the MoS2 layers (Fig. 5a). The energy is calculated to be −0.046 eV, based on Eform = E(MoS2/G/MoS2) − E(MoS2/MoS2) − E(G), indicating the thermodynamic stability of derived carbon in the MoS2 interlayer space. Subsequently, we clarified the adsorption sites of Na on monolayer MoS2, which verified an active hollow site with Ead = E(Na-MoS2) − E(Na) − E(MoS2) = −0.734 eV (Fig. S7 and Table S3, ESI†). The Na adsorption on the graphene has been calculated for three possibilities, respectively, i.e., on the top, bridge and hollow site. Comparing the adsorption energies on the three sites, we identified that Na is more inclined to adsorb on the bridge site with Ead at −0.999 eV relative to the C top (−0.937 eV) and hollow sites (−0.971 eV) (Fig. S7 and Table S3, ESI†). Therefore, we could distinguish that the C atoms exhibited stronger adsorption for Na with a more negative adsorption energy, indicating that the W-MoS2/C may enhance Na intercalation kinetically (Fig. 5b).
In the expanded bilayer-MoS2, the intercalating carbon atoms were simply simulated as a graphene layer. We derived that carbon atoms may grasp the Na which signified a positive synthetic-effect on the adsorption of Na. We investigated the Na adsorption energy dependence on the distance between MoS2 and the carbon layer (Fig. 5c). Referring to the carbon layer, we considered three adsorption sites, i.e., the top, bridge and hollow site. The bridge site was confirmed as an energy optimum location with h = 2.52 Å. The energy difference between the three sites constructed an energy barrier for Na transport. Once the Na moved close to the MoS2 or graphene, the energy barrier was promoted. Evidently, the strong interaction near the layer impeded Na transport. Nevertheless, at the energy optimum site, the energy barrier reached the minimum value (ΔE = 0.062 eV), which means the Na could transport without noticeable hindrance at this height (Fig. 5d). Furthermore, we determined the difference charge density to analyze the chemical bonding. In the bridge configuration, it is easy to find that the charges are mainly lost from the Na and accumulate in the Na–S and Na–C bonds. Then, Na forms σ bonds with the top S atoms and π bonds with the bottom C atoms (inset of Fig. 5d). These chemical bonds are critical for the charge transporting from the Na to MoS2 layers and carbon layers. Thus, the intercalated carbon atoms (graphene in this model) could create a channel for the Na+ transport, simultaneously, with an energy transferring process through the chemical bonding (Fig. 6).
4. Conclusions
In summary, we have designed and synthesized a special 3D hybrid nanostructure consisting of 2D ultra-wide spacing MoS2/C inter-overlapped layers and 1D double-layer carbon tubes as the substrate. The 2D MoS2/C inter-overlapped layer spacing is about twice that of the common MoS2 layer, and there is a layer of derived carbon between the layers. The wide interlayer spacing and the presence of the derived carbon layer provide a rapid diffusion channel for the diffusion of ions, as well as sufficient ion adsorption sites. At the same time, a good contact can be formed between the carbon nanosheet and the MoS2 layer, which improves the conductivity of the MoS2. As a result, the CNT@NCT@W-MoS2/C electrode delivered a discharge capacity of 530 mA h g−1 at 0.05 A g−1. After 200 cycles at a high current density of 1 A g−1, it can still maintain a capacity of 256 mA h g−1. The DFT calculations of sodium storage on the W-MoS2/C inter-overlapped layers further reveals that this structure has significantly improved the adsorption and diffusion of sodium ions, compared with the normal MoS2. This work reveals the importance of increasing the interlayer spacing and the presence of interlayer carbon layers to improve the sodium storage performance of the MoS2 electrode, which provides new insights into the structural design of 2D materials for battery electrode materials.Conflicts of interest
The authors declare no conflict of interest.Acknowledgements
This work was financially supported by the National Natural Science Foundation of China (No. 61574122 and 61874093), Zhongyuan Thousand Talents Plan-Science & Technology Innovation Leading Talents Project (No. 194200510009), and Xinyang Normal University Analysis & Testing Center.References
- A. Eftekhari, ACS Sustainable Chem. Eng., 2019, 7, 5602–5613 CrossRef CAS.
- A. Eftekhari, ACS Sustainable Chem. Eng., 2019, 7, 3684–3687 CrossRef CAS.
- Y. J. Fang, D. Y. Luan, Y. Chen, S. Y. Gao and X. W. Lou, Angew. Chem., Int. Ed., 2020, 132, 2666–2670 CrossRef.
- Y. J. Fang, D. Y. Luan, Y. Chen, S. Y. Gao and X. W. Lou, Angew. Chem., Int. Ed., 2020, 59, 7178–7183 CrossRef CAS PubMed.
- D. W. Cao, W. P. Kang, S. L. Wang, Y. Y. Wang, K. A. Sun, L. Z. Yang, X. Zhou, D. F. Sun and Y. L. Cao, J. Mater. Chem. A, 2019, 7, 8268–8276 RSC.
- S. H. Yang, S. K. Park, J. K. Kim and Y. C. Kang, J. Mater. Chem. A, 2019, 7, 13751–13761 RSC.
- D. L. Chao, C. R. Zhu, P. H. Yang, X. H. Xia, J. L. Liu, J. Wang, X. F. Fan, S. V. Savilov, J. Y. Lin, H. J. Fan and Z. X. Sheng, Nat. Commun., 2016, 7, 12122 CrossRef CAS PubMed.
- A. Anto Jeffery, C. Nethravathi and M. Rajamathi, J. Phys. Chem. C, 2014, 118, 1386–1396 CrossRef CAS.
- F. Wang, Y. Liu, Y. F. Zhao, Y. Wang, Z. J. Wang, W. H. Zhang and F. Z. Ren, Appl. Sci., 2018, 8, 22 CrossRef.
- K. F. Mak, C. Lee, J. Hone, J. Shan and T. F. Heinz, Phys. Rev. Lett., 2010, 105, 136805 CrossRef PubMed.
- X. Q. Xie, Z. M. Ao, D. W. Su, J. Q. Zhang and G. X. Wang, Adv. Funct. Mater., 2015, 25, 1393–1403 CrossRef CAS.
- D. Sun, D. L. Ye, P. Liu, Y. G. Tang, J. Guo, L. Z. Wang and H. Y. Wang, Adv. Energy Mater., 2018, 8, 1702383 CrossRef.
- N. Feng, R. J. Meng, L. H. Zu, Y. T. Feng, C. X. Peng, J. M. Huang, G. L. Liu, B. J. Chen and J. H. Yang, Nat. Commun., 2019, 10, 1372 CrossRef PubMed.
- B. R. Jia, Q. Y. Yu, Y. Z. Zhao, M. L. Qin, W. Wang, Z. W. Liu, C. Y. Lao, Y. Liu, H. W. Wu, Z. L. Zhang and X. H. Qu, Adv. Funct. Mater., 2018, 28, 1803409 CrossRef.
- G. Wang, J. Zhang, S. Yang, F. X. Wang, X. D. Zhuang, K. Müllen and X. L. Feng, Adv. Energy Mater., 2018, 8, 1702254 CrossRef.
- Y. Liu, X. Z. Wang, X. D. Song, Y. F. Dong, L. Yang, L. X. Wang, D. Z. Jia, Z. B. Zhao and J. S. Qiu, Carbon, 2016, 109, 461–471 CrossRef CAS.
- B. Chen, H. H. Lu, J. W. Zhou, C. Ye, C. S. Shi, N. Q. Zhao and S. Z. Qiao, Adv. Energy Mater., 2018, 8, 1702909 CrossRef.
- T. S. Sahu, Q. Li, J. Wu, V. P. Dravid and S. Mitra, J. Mater. Chem. A, 2017, 5, 355–363 RSC.
- Q. C. Pan, Q. B. Zhang, F. H. Zheng, Y. Z. Liu, Y. P. Li, X. Ou, X. H. Xiong, C. H. Yang and M. L. Liu, ACS Nano, 2018, 12, 12578–12586 CrossRef CAS PubMed.
- W. J. Tang, X. L. Wang, Y. Zhong, D. Xie, X. Q. Zhang, X. H. Xia, J. B. Wu, C. D. Gu and J. P. Tu, Chem. – Eur. J., 2018, 24, 11220–11226 CrossRef CAS PubMed.
- C. T. Zhao, C. Yu, B. Qiu, S. Zhou, M. D. Zhang, H. W. Huang, B. Q. Wang, J. J. Zhao, X. L. Sun and J. S. Qiu, Adv. Mater., 2018, 30, 1702486 CrossRef PubMed.
- C. T. Zhao, C. Yu, M. D. Zhang, Q. Sun, S. F. Li, M. N. Banis, X. T. Han, Q. Dong, J. Yang, G. Wang, X. L. Sun and J. S. Qiu, Nano Energy, 2017, 41, 66–74 CrossRef CAS.
- Y. L. Ding, P. Kopold, K. Hahn, P. A. van Aken, J. Maier and Y. Yu, Adv. Mater., 2016, 28, 7774–7782 CrossRef CAS PubMed.
- T. S. Sahu and S. Mitra, Sci. Rep., 2015, 5, 12571 CrossRef CAS PubMed.
- Y. F. Li, Y. L. Liang, F. C. R. Hernandez, H. D. Yoo, Q. Y. An and Y. Yao, Nano Energy, 2015, 15, 453–461 CrossRef CAS.
- D. W. Su, S. X. Dou and G. X. Wang, Adv. Energy Mater., 2015, 5, 1401205 CrossRef.
- R. T. Wang, S. J. Wang, X. Peng, Y. B. Zhang, D. D. Jin, P. K. Chu and L. Zhang, ACS Appl. Mater. Interfaces, 2017, 9, 32745–32755 CrossRef CAS.
- H. Jiang, D. Y. Ren, H. F. Wang, Y. J. Hu, S. J. Guo, H. Y. Yuan, P. J. Hu, L. Zhang and C. Z. Li, Adv. Mater., 2015, 27, 3687–3695 CrossRef CAS.
- K. Chang, W. X. Chen, L. Ma, H. Li, H. Li, F. H. Huang, Z. D. Xu, Q. B. Zhang and J.-Y. Lee, J. Mater. Chem., 2011, 21, 6251–6257 RSC.
- W. N. Ren, H. F. Zhang, C. Guan and C. W. Cheng, Adv. Funct. Mater., 2017, 27, 1702116 CrossRef.
- Y. F. Yu, C. Li, Y. Liu, L. Q. Su, Y. Zhang and L. Y. Cao, Sci. Rep., 2013, 3, 1866 CrossRef PubMed.
- W. Li, R. Bi, G. X. Liu, Y. X. Tian and L. Zhang, ACS Appl. Mater. Interfaces, 2018, 10, 26982–26989 CrossRef CAS PubMed.
- J. J. Wang, C. Luo, T. Gao, A. Langrock, A. C. Mignerey and C. S. Wang, Small, 2015, 11, 473–481 CrossRef CAS PubMed.
- Y. Wang, Q. T. Qu, G. C. Li, T. Gao, F. Qian, J. Shao, W. J. Liu, Q. Shi and H. H. Zheng, Small, 2016, 12, 6033–6041 CrossRef CAS PubMed.
- Y. H. Wang, D. Y. Zhang, Y. B. Wang, Y. G. Zhang, X. M. Liu, W. W. Zhou, J.-K. Kim and Y. S. Luo, Nanoscale, 2019, 11, 11025–11032 RSC.
- J. Wang, J. Polleux, J. Lim and B. Dunn, J. Phys. Chem. C, 2007, 111, 14925–14931 CrossRef CAS.
- Y. J. Fang, X. Y. Yu and X. D. Lou, Adv. Mater., 2018, 30, 1706661 Search PubMed.
- Y. J. Fang, B. Y. Guan, D. Y. Luan and X. D. Lou, Angew. Chem., Int. Ed., 2019, 131, 7821–7825 CrossRef.
- D. L. Chao, B. Ouyang, P. Liang, T. T. T. Huong, G. C. Jia, H. Huang, X. H. Xia, R. S. Rawat and H. J. Fan, Adv. Mater., 2018, 30, 1804833 CrossRef PubMed.
- A. Eftekhari and M. Mohamedi, Mater. Today Energy, 2017, 6, 211–229 CrossRef.
- H. L. Li, K. Yu, H. Fu, B. J. Guo, X. Lei and Z. Q. Zhu, J. Phys. Chem. C, 2015, 119, 7959–7968 CrossRef CAS.
- H. L. Li, K. Yu, H. Fu, B. J. Guo, X. Lei and Z. Q. Zhu, Phys. Chem. Chem. Phys., 2015, 17, 29824–29833 RSC.
- B. Chen, H. Li, H. X. Liu, X. Q. Wang, F. X. Xie, Y. D. Deng, W. B. Hu, K. Davey, N. Q. Zhao and S. Z. Qiao, Adv. Energy Mater., 2019, 9, 1901146 CrossRef.
- T. T. Debela, Y. R. Lim, H. W. Seo, I. S. Kwon, I. H. Kwak, J. Park, W. I. Cho and H. S. Kang, ACS Appl. Mater. Interfaces, 2018, 10, 37928–37936 CrossRef CAS PubMed.
- L. C. Guo, J. J. Li, H. Y. Wang, N. Q. Zhao, C. S. Shi, L. Y. Ma, C. N. He, F. He and E. Z. Liu, Phys. Rev. Appl., 2018, 9, 024010 CrossRef CAS.
Footnote |
| † Electronic supplementary information (ESI) available. See DOI: 10.1039/d0nh00152j |
| This journal is © The Royal Society of Chemistry 2020 |

