Structural evolution from layered Na2Ti3O7 to Na2Ti6O13 nanowires enabling a highly reversible anode for Mg-ion batteries†
Lan
Luo‡
ab,
Yichao
Zhen‡
a,
Yanzhong
Lu
a,
Kaiqiang
Zhou
a,
Jinxian
Huang
a,
Zhigao
Huang
 ab,
Sanjay
Mathur
 c and
Zhensheng
Hong
 *ac
*ac
aFujian Provincial Key Laboratory of Quantum Manipulation and New Energy Materials, College of Physics and Energy, Fujian Normal University, Fuzhou, Fujian 350117, China
bFujian Provincial Collaborative Innovation Center for Optoelectronic Semiconductors and Efficient Devices, Xiamen, 361005, China
cInstitute of Inorganic Chemistry, University of Cologne, Greinstr. 6, 50939 Cologne, Germany. E-mail: winter0514@163.com
First published on 25th November 2019
Abstract
The development of suitable host materials for the reversible storage of divalent ions such as Mg2+ is still a big challenge and its progress to date has been slow compared to that of monovalent Li+ or Na+. Herein, we present the study of layered sodium trititanate (Na2Ti3O7) and sodium hexatitanate (Na2Ti6O13) nanowires as anode materials for rechargeable Mg-ion batteries. It is found for the first time that the structural evolution from layered Na2Ti3O7 to Na2Ti6O13 with a more condensate three-dimensional microporous structure enables remarkably enhanced Mg-ion storage performance. The Na2Ti6O13 electrode can achieve a large initial discharge and charge capacity of 165.8 and 147.7 mA h g−1 at 10 mA g−1 with a record high initial coulombic efficiency up to 89.1%. Ex situ XRD, Raman measurements and EDX mapping were used to investigate the electrochemical reaction mechanism. It is suggested that the irreversible structure change and the formation of insoluble NaCl with high yield and large particles when Na+ is replaced by inserted Mg2+ for the Na2Ti3O7 electrode could be ascribed to the rapid decline in capacity. By contrast, the Na2Ti6O13 electrode exhibits good structure stability during the Mg-ion insertion/extraction process, leading to good rate performance and cycling stability.
1. Introduction
Modern society is facing an unprecedented energy challenge as a result of the fast depletion of fossil fuels and the accompanying environmental pollution. To address this urgent issue, lots of research efforts have been devoted to exploring efficient and sustainable conversion and energy storage systems.1 Although lithium-ion batteries (LIBs) have been a mature secondary battery technology and widely applied, the geographically constrained Li resources in the earth may not be sufficient to satisfy increased mobile power and large-scale storage systems. Magnesium (Mg) batteries are capturing increasing attention owing to the high volumetric specific capacity (3833 mA h cm−3), dendrite-free deposition during cycling and natural abundance of Mg metal.2–4 However, the commercialization of Mg batteries is still a great challenge because it is hindered by two issues. One is the lack of suitable electrolytes allowing reversible Mg plating/stripping.3,5 The other major barrier is kinetically sluggish Mg-ion intercalation/insertion and diffusion in host materials due to the strong electrostatic interactions of divalent Mg2+.6,7 One innovative strategy is developing Mg-ion batteries (MIBs) realized by insertion-type electrode materials. Therefore, the development of host materials for the cathode and anode for MIBs with satisfactory electrochemical performance is urgently needed.Up to now, some host materials, such as layered transition-metal sulfides (TiS2,8 VS4,4 MoS2,9etc.) and transition-metal oxides (V2O5,10,11 MnO2,12etc.) have been studied as cathode materials for Mg-ion storage due to a relatively high voltage. Nevertheless, a few materials, Bi,13,14 Sn,15,16 P17 and their alloys (SnSb,18 BiSn,14etc.) have been reported as MIB anodes with high specific capacity, leading to the construction of Mg-ion batteries (MIBs). However, the large volume change during the discharge/charge process and sluggish Mg2+ diffusion of these materials result in poor rate performance. Interestingly, recently titanium-based materials have shown potential applications in MIBs.19–23 For example, TiO2-B nanowires delivered initial discharge and charge capacities of 142 and 79 mA h g−1 at 0.1 C rate.20 Spinel Li4Ti5O12 exhibited reversible capacity around 70 mA h g−1 after activation.24 Compared to titanium oxides, sodium titanate with a layered structure may be a promising host for fast Mg-ion storage due to the large interlayer spacing. Chen et al. reported that layered Na2Ti3O7 nanoribbons displayed initial discharge and charge capacities of 135 and 91 mA h g−1 after the activation of Mg doping (NaMgTi3O7).19 Nevertheless, the Mg-ion storage performance of the above materials is far from satisfactory.
In this paper, we report for the first time the structural evolution from layered Na2Ti3O7 to Na2Ti6O13 nanowires toward significantly improved Mg-ion storage performance. Two kinds of sodium titanates with different structures were fabricated by the heat treatment of the titanate precursor under different washing conditions. Na2Ti6O13 nanowires are used as a new anode for MIBs and exhibited much enhanced performance compared with Na2Ti3O7 nanowires. They displays a high discharge capacity of 165.8 mA h g−1 with a very high initial coulombic efficiency of 89.1%. Moreover, the improved Mg-ion storage behavior of Na2Ti6O13 and the comparative study with Na2Ti3O7 are also investigated and revealed by comprehensive structure characterization and composition analysis.
2. Experimental section
Material synthesis
Synthesis of layered Na2Ti6O13 and Na2Ti3O7 nanowires: 1 g of commercial TiOSO4 was dissolved in a mixture of 50 ml of 15 M NaOH and 30 ml of H2O by magnetic stirring and ultrasonic treatment. Afterward, the mixture was put into a 100 mL Teflon-lined autoclave and heated at 140 °C for 48 h. After cooling to room temperature, the white titanate precursor was treated in two ways. One was by washing with deionized water only two times to remove the extra alkali. The other way was by washing thoroughly (more than five times) with deionized water until neutral pH to partly achieve the ion-exchange reaction. Both products were dried at 60 °C in air overnight. The Na2Ti3O7 nanowires were obtained by sintering the titanate precursor treated by using the first way at different temperatures (300 °C and 400 °C) for 1 h at the rate of 2 °C min−1 in air, and the products are denoted as NT3-300 and NT3-400, respectively. The Na2Ti6O13 nanowires were prepared by the same way through the second precursor, and the products are denoted as NT6-300 and NT6-400, respectively.3. Results and discussion
Firstly, the sodium titanate precursor was prepared by a hydrothermal method. The Na/Ti ratio would decrease due to the cation exchange of Na+ by H+ after washing with deionized water, and the composition is appropriately described by Na2−XHXTi3O7 (0 ≤ X ≤ 2).25 It is found that such a compound obtained after thorough washing with water can be transformed into sodium hexatitanate (Na2Ti6O13, denoted as NT6) through sintering. It is observed that the direct formation of sodium trititanate (Na2Ti3O7, denoted as NT3) occurs without the ion exchange process. Firstly, various measurements were used to investigate and identify the structure of the two kinds of sodium titanates obtained at 300 °C. Fig. 1a shows the X-ray diffraction (XRD) pattern of NT3, which is similar to that of the Na2Ti3O7 nanomaterials as depicted in the previous study.19,26 It should be noted such a nanomaterial may not completely match with the bulk structure and the XRD pattern needs to be refined as in the previous study. The crystal structure parameters of bulk Na2Ti3O7 (JCPDS 31-1329) with the monoclinic C2/m space group are a = 9.1279 Å, b = 3.8032 Å, c = 8.5621 Å, α = γ = 90°, β = 101.6°. The refinement parameters of NT3 are a = 9.146 Å, b = 3.807 Å, c = 8.581 Å, α = γ = 90°, β = 101.63° with an acceptable deviation of 7.04%, suggesting the formation of the sodium trititanate structure. The layer spacing is around 0.84 nm calculated from the (001) peak (2Theta = 11.2°). The crystal structure of NT3 is shown in Fig. 1b, and is composed of typical zigzag layers of TiO6 with a typical layered structure and large interlayer spacing. The ICP analysis further confirms the Na/Ti ratio to be equal to around 2/3. Fig. 1c displays the XRD patterns of NT6 and could be approximately indexed to Na2Ti6O13 [JCPDS No. 01-073-1398]. The crystal structure parameters of bulk Na2Ti6O13 are a = 15.12 Å, b = 3.738 Å, c = 9.16 Å, α = γ = 90°, β = 99.3°. Refinement results reveal lattice parameters of NT6 (a = 15.143 Å, b = 3.752 Å, c = 9.178 Å, α = γ = 90°, β = 99.21°) with an acceptable deviation of 9.76%, indicating the formation of the sodium hexatitanate structure. It should be mentioned that the layer spacing of the present NT6 is up to 0.78 nm which is a bit larger than that of the pure sodium hexatitanate structure. This is due to the presence of residual interlayer water as revealed from the TG (Fig. S1†) and XRD (Fig. S2†), which will be discussed further. However, the ICP test indeed reveals that Na/Ti = 2/3 agrees well with the composition of Na2Ti6O13. Although the presented material does not display an intensive enough and perfect XRD diffraction peak owing to the tiny crystalline size, the refinement results possess a trustworthy matched-degree and acceptable deviation with the standard structure. This way is often used to identify similar materials along with composition analysis,19 and such a structure is the most proximate structure and will be further confirmed by the following characterization. As depicted in Fig. 1d, NT6 also possesses a layered structure, but itis somewhat different from that of NT3 having a condensate structure.26 All O atoms belong to at least two TiO6 octahedra, while there are some O terminal atoms belonging to only one octahedra. Moreover, the structural evolution from Na2Ti3O7 to Na2Ti6O13 is achieved through sharing and rearranging these one coordinated O atoms, leading to a compact three-dimensional microporous structure in which Na-ions are located. As a result, TiO6 octahedra in NT6 are more regular with close Ti–O distances, due to the absence of very short Ti–O (1.7 Å) distances as presented in NT3.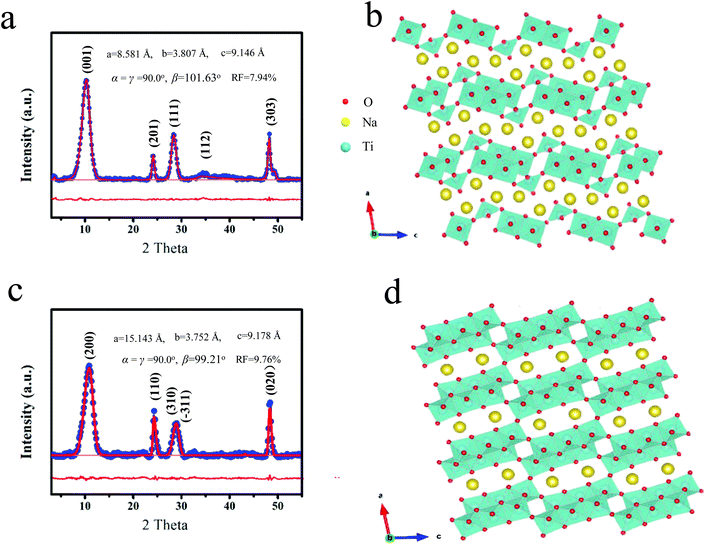 | ||
| Fig. 1 (a) Rietveld refined XRD patterns of NT3 and (b) the corresponding crystal structure, (c) Rietveld refined XRD patterns of NT6 and (d) the corresponding crystal structure. | ||
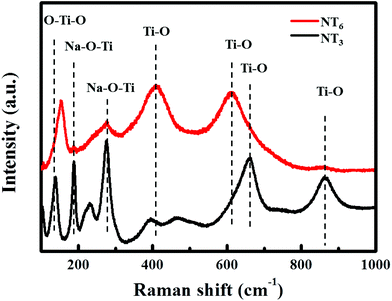
TGA curves (Fig. S1†) reveal the weight loss of different titanate precursors during the thermal treatment. The weight loss before 200 °C can be associated with the releasing of absorbed water. Only a small weight loss of about 4% for the NT3-precursor between 200–400 °C is ascribed to the release of interlayer water. In contrast, a mass loss of 7% is observed for the NT6-precursor, indicating the presence of more interlayer water. This can be understood from the synthesis process and is in agreement with the XRD results (Fig. S2†). The layered diffraction peak in the XRD patterns of NT6-400 is shifted toward higher angle values, thus generating a decrease of the interlayer distance equal to that of standard Na2Ti6O13. This peak is nearly unchanged after sintering of NT3, suggesting a stable and different layered structure. Raman spectra for NT3 and NT6 are shown in Fig. 2. It should be noted that the difference in Raman spectra provides strong evidence that the NT6 has a different structure from that of NT3. The bands of NT3 between 100–1000 cm−1 are well coincident with the scattering modes of Na2Ti3O7 as demonstrated in the previous literature.26 The bands located at 188, 229 and 280 cm−1 are assigned to Na–O–Ti, however, two (188 and 229 cm−1) of them are absent for NT6. Moreover, the band at around 870 cm−1 for NT3 assigned to the short bond of Ti–O stretching vibration is also not found in NT6.27 These results well correspond to the structure characteristics of the two different sodium titanates as illustrated by their crystal structures (Fig. 1b and d). The apparently different and nonoverlapping Raman spectra also demonstrate the pure phase structure of these two materials.
The morphology and microstructure of NT3 and NT6 obtained after sintering at 300 °C were characterized by the SEM and TEM images, as shown in Fig. 3a–d. Both of them exhibit a nanowire morphology, intertwined with each other with a length of about 50–80 nm. NT3 and NT6 also possess the same morphology prepared at 400 °C (Fig. S2c and S2d†). The corresponding energy dispersive X-ray spectroscopy (EDS) elemental mappings of the two sodium titanates demonstrate that the three elements Na, Ti, and O are uniformly distributed (Fig. S3a and S3b†). Itis worth noting that such a nanowire possesses an ultra-tiny diameter of 4–6 nm. The SAED pattern in the inset of Fig. 3d can be indexed to the structure of Na2Ti6O13. The high resolution TEM (HRTEM) image of NT3 clearly displays a large interlayer spacing of 0.84 nm (Fig. 3e). As shown in Fig. 3f, the average interlayer spacing of NT6 is 0.75 nm. Thus, both of them have a relatively large interlayer distance, and this result agrees well with the XRD results. It is demonstrated that layered structure materials such as MoS2![[thin space (1/6-em)]](https://www.rsc.org/images/entities/char_2009.gif) 7,28 (layer spacing, 0.62 nm) and TiS2
7,28 (layer spacing, 0.62 nm) and TiS2![[thin space (1/6-em)]](https://www.rsc.org/images/entities/char_2009.gif) 29 (layer spacing, 0.57 nm) have been certified as efficient Mg storage materials with highly reversibility.30,31 Therefore, we believe that NT3 and NT6 have enough space for Mg-ion storage, and expect good performance for Mg-ion diffusion.
29 (layer spacing, 0.57 nm) have been certified as efficient Mg storage materials with highly reversibility.30,31 Therefore, we believe that NT3 and NT6 have enough space for Mg-ion storage, and expect good performance for Mg-ion diffusion.
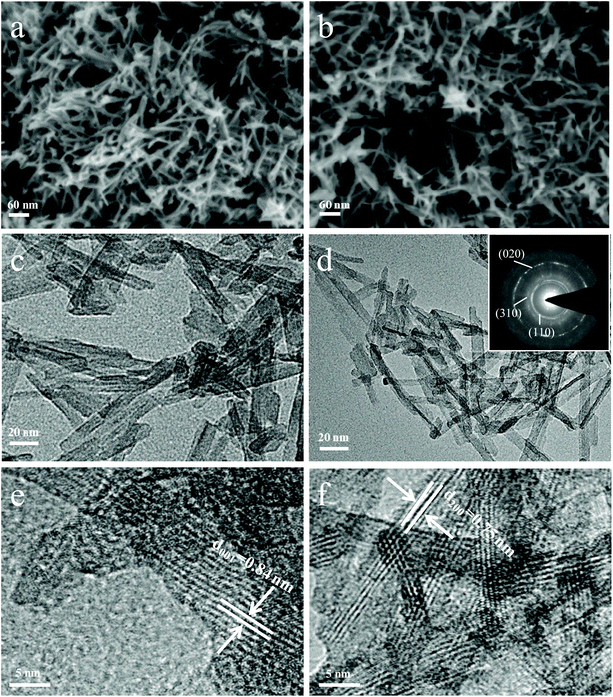 | ||
| Fig. 3 SEM images of (a) NT3 and (b) NT6 obtained at 300 °C. TEM images of (c) NT3 and (d) NT6. HRTEM images of (e) NT3 and (f) NT6. The inset is the corresponding SAED pattern. | ||
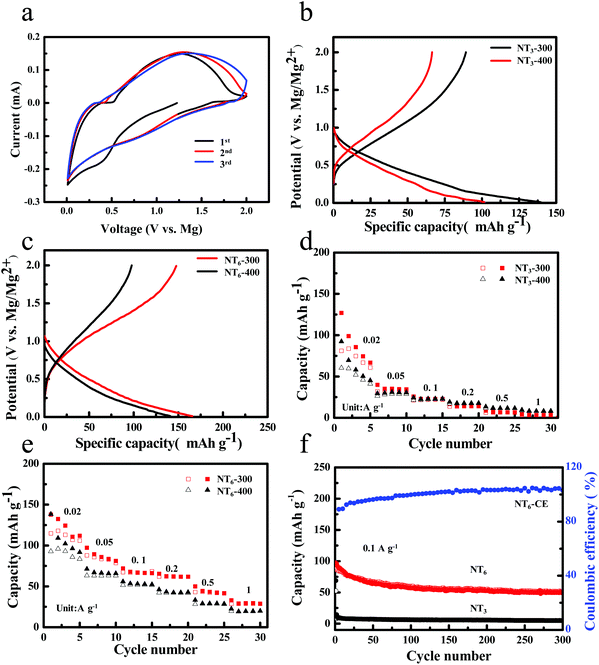
To examine the Mg storage performance of layered sodium titanates, coin cell half cells were assembled by using Mg foil as the counter electrode. Fig. 4a shows the cyclic voltammetry (CV) curves of NT6-300 at a scan rate of 0.5 mV s−1 in the voltage range of 0.01–2.0 V. A broad peak at ∼0.5 V is observed in the first discharge process and disappears in the subsequent cycles, suggesting some irreversible reaction in the first cycle. This phenomenon is more apparent for NT3-300 (Fig. S4a†). It is found that a pair of redox peaks between 0.5–1.3 V can be observed during the following cycles, which could be due to the reversible insertion/extraction reactions of Mg2+. Fig. 4b shows the discharge–charge curves of NT3 obtained at different temperatures in the voltage window of 0.01–2.0 V at a current density of 0.01 A g−1. NT3-300 delivers the first discharge and charge capacity of 139.6 mA h g−1 and 89.2 mA h g−1, and possesses an initial coulombic efficiency (ICE) of 63.9%. However, NT3-400 displays a lower discharge capacity (102 mA h g−1) and charge capacity (63 mA h g−1). Fig. 4c shows the first discharge–charge curves of NT6-300 and NT6-400 at a current density of 0.01 A g−1. It is worth noting that NT6-300 exhibits a large discharge and charge capacity of 165.8 and 147.7 mA h g−1, respectively. A much higher ICE of 89.1% and a larger capacity than that of NT3 are obtained. As far as we know, this is considered as the highest value among the related anodes. A comparison of ICE and the capacity of the anodes is given in Table S1.† Meanwhile, the NT6-400 only exhibits a lower discharge capacity and charge capacity, which is the same as that of NT3-400. One reason is that NT6-300 has a larger layer spacing, and the other is the existence of water in the layer. It has been proposed that H2O molecules located in the layer of vanadium oxides facilitate Mg intercalation because it could coordinate with Mg2+ to create a “shield” for the positive charge, thereby alleviating the host–guest interaction and increasing ion diffusivity.9,32,33 Therefore, it is proposed that the residual H2O of sodium titanates obtained after thermal treatment at a low temperature may also be favorable for the Mg2+ ion insertion. The content of residual H2O is revealed from the TG curve (Fig. S5†). Fig. 4d shows the rate capability of NT3-300 and NT3-400, and both of them display poor rate performance. The NT3-300 electrode only maintains a reversible capacity of 56.7, 22.1, 13.7, 42, 6.4 and 3.4 mA h g−1 at 0.02, 0.05, 0.1, 0.2, 0.5 and 1 A g−1, respectively. By contrast, NT6 exhibits much improved rate capability, as shown in Fig. 4e. The NT6-300 electrode delivers a much higher capacity of 111.8, 83.6, 67.1, 62.2, 42.6 and 28.9 mA h g−1 at the current density of 0.02, 0.05, 0.1, 0.2, 0.5 and 1 A g−1, respectively. Fig. 4f shows the cycling performance and CE of NT6-300 and NT3-300 at a current density of 0.1 A g−1. We found that NT3-300 delivers an initial charge capacity of 52.4 mA h g−1, but it quickly drops to 8.1 mA h g−1 in the second cycle. NT6-300 displays a reversible capacity of 87 mA h g−1 in the first cycle and a stable capacity of 51.2 mA h g−1 can be retained after 300 cycles, indicating a remarkably improved capacity retention. In a word, the phase structure of Na2Ti6O13 exhibits much enhanced Mg-ion storage performance compared with layered Na2Ti3O7.
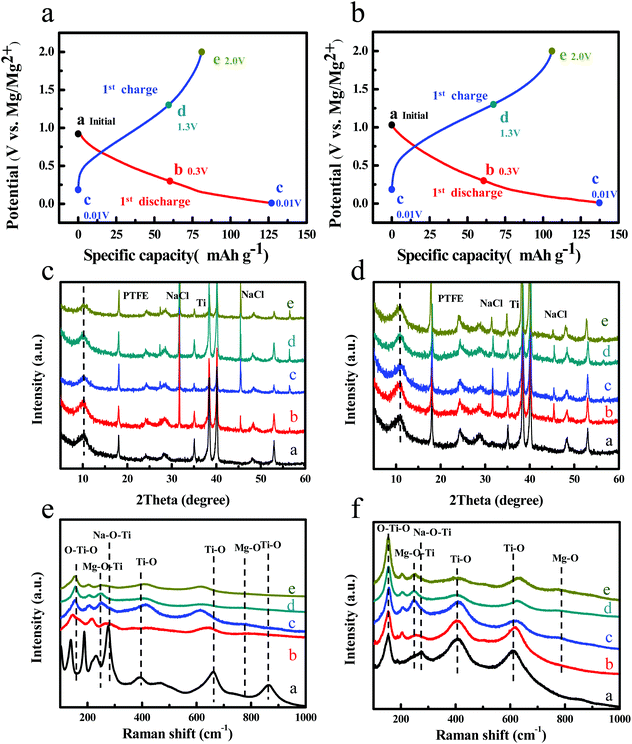
In order to investigate the magnesium storage behavior of NT3-300 and NT6-300, ex situ XRD and Raman measurements were carried out. Fig. 5a and b display the first discharge–charge curves of NT3-300 and NT6-300 at a rate of 0.02 A g−1, and five representative states (points) were selected for use in ex situ XRD and Raman tests. The batteries were opened up in an argon-filled glovebox and then the electordes were rapidly subjected to testing. Fig. 5c and d show the XRD patterns at corresponding discharging and charging states. The two kinds of sodium titanates maintain a stable phase structure during the Mg-ion insertion/extraction process. However, the diffraction peak for the layered structure of NT3 is weakened and becomes broader after the first cycle; this may suggest some irreversible structure change. It is worth noting that the layered peaks of NT6 slightly shift toward a higher angle after Mg-ion insertion, and it can recover entirely after Mg-ion extraction. This is ascribed to the substitution of Mg2+ (radius of 0.72 Å) for Na+ (radius of 1.02 Å).19,34,35 A new peak at 18° corresponding to PTFE is observed.36 Meanwhile, two new peaks at 31.7°and 45.5° are found for both NT3-300 and NT6-300, which can be well indexed to the NaCl structure. This manifests that the insertion of Mg2+ accompanies the extraction of Na+ from the structure of the two sodium titanates. Subsequently, Na+ could not reinsert into the host because of the formation of insoluble NaCl in THF solution. This result was also reported by Chen et al. in the study of Mg-ion insertion into Na2Ti3O7 nanoribbons, where the presence of a large amount of NaCl was observed.19 Nevertheless, the crystallinity and content of insoluble NaCl in the NT3-300 electrode is much higher than that in NT6-300.
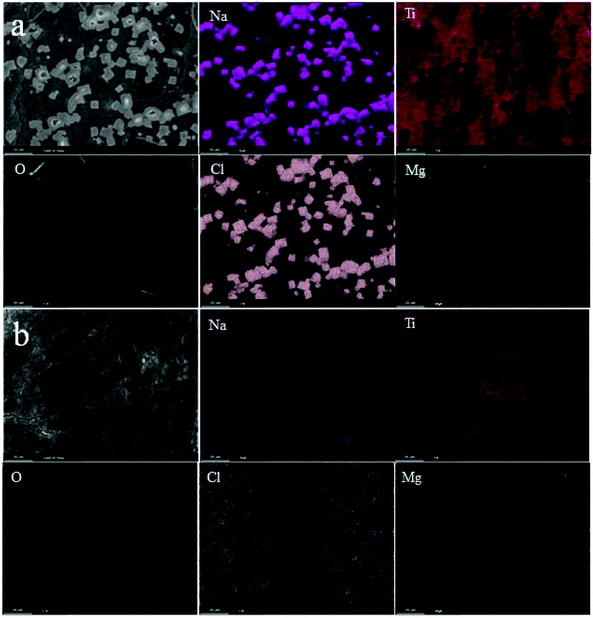
To further study the local structure of the samples, ex situ Raman of NT3-300 and NT6-300 electrodes at different stages was carried out, as shown in Fig. 5e and f. When the NT3-300 electrode discharged to 0.3 V, the band at 278 cm−1 attributed to the Na–O–Ti stretching vibration gradually weakened. This band shifts to a low wavenumber at around 247 cm−1 after the first discharge, suggesting that inserted divalent Mg2+ replaces the sites of univalent Na+ to form Mg–O–Ti. Meanwhile, another band at 188 cm−1 for Na–O–Ti disappears, which further certifies the substitution process. As shown in Fig. 5f, the NT6-300 electrode also undergoes the same substitution process based on the band change from Na–O–Ti to Mg–O–Ti. It should be noted that the bands for O–Ti–O and Ti–O of NT3-300 are remarkably weakened and shift during the Mg-ion insertion/extraction process, while NT6-300 exhibited a relatively stable structure. This result agrees with the ex situ XRD measurement. At the same time, a new small band at about 785 cm−1 is found in both electrodes, which can be attributed to the Mg–O bond.37,38 Furthermore, the morphology and composition of the electrodes after the first cycle were investigated. As shown from the SEM images in Fig. S6,† a lot of cubic particles are found for the NT3-300 electrode, while the NT6-300 electrode possesses a smooth surface. Their compositions were verified by EDX elemental mapping, as depicted in Fig. 6. We can clearly observe the presence of cubic NaCl particles and the inhomogeneous distribution of other elements for the NT3-300 electrode. By contrast, the NT6-300 electrode exhibits a homogeneous element (Na, Ti, O, Cl, Mg) distribution. The contents of the elements (Table S2†) also reveal that the sodium trititanate electrode has a higher content of Na and Cl than the sodium hexatitanate electrode. Therefore, the irreversible structure change in the trititanate electrode and the formation of a large amount of insoluble and nonconducting NaCl with large particles could be ascribed to the rapid decline in capacity.
4. Conclusions
In summary, two sodium titanates, layered sodium trititanate and sodium hexatitanate nanowires were successfully synthesized through the thermal treatment of the sodium titanate precursor under different washing conditions. Na2Ti6O13 nanowires are used as a new anode for MIBs for the first time and exhibit much improved reversible capacity, initial coulombic efficiency and cycling performance compared with layered Na2Ti3O7 nanowires. It is revealed that inserted divalent Mg2+ would replace the sites of univalent Na+ to form Mg–Ti–O. Na+ could not reinsert into the structure because of the formation of insoluble NaCl in THF solution. The irreversible structure change and inhomogeneous formation of large NaCl particles may cause a rapid decline in capacity for the layered Na2Ti3O7 electrode. The Na2Ti6O13 electrode with more regular structural unit TiO6 octahedra and a three-dimensional microporous structure exhibits better structure stability during the Mg-ion insertion and extraction process. This study presents a new anode material for MIBs with high performance and provides an insight into developing electrode materials for rechargeable MIBs.Conflicts of interest
There are no conflicts to declare.Acknowledgements
National Natural Science Foundation of China (NSFC 51874099 and 51502038) and National Science Foundation of Fujian Province (2018J06012), and Opening Foundation of Fujian Provincial Key Laboratory of Quantum Manipulation and New Energy Materials (QMNEM1906) provided financial support for this study. Z. Hong would like to thank the support from Alexander von Humboldt-Stiftung/Foundation.References
- A. S. Aricò, P. Bruce, B. Scrosati, J.-M. Tarascon and W. van Schalkwijk, Nat. Mater., 2005, 4, 366–377 CrossRef PubMed.
- F. Xiong, Y. Fan, S. Tan, L. Zhou, Y. Xu, C. Pei, Q. An and L. Mai, Nano Energy, 2018, 47, 210–216 CrossRef CAS.
- C. Kuang, W. Zeng and Y. Li, J. Nanosci. Nanotechnol., 2019, 19, 12–25 CrossRef CAS PubMed.
- Y. Wang, Z. Liu, C. Wang, X. Yi, R. Chen, L. Ma, Y. Hu, G. Zhu, T. Chen and Z. Tie, Adv. Mater., 2018, 30, 1802563 CrossRef PubMed.
- M. S. Park, J. G. Kim, Y. J. Kim, N. S. Choi and J. S. Kim, Isr. J. Chem., 2015, 55, 570–585 CrossRef CAS.
- I. A. Rodríguez-Pérez, Y. Yuan, C. Bommier, X. Wang, L. Ma, D. P. Leonard, M. M. Lerner, R. G. Carter, T. Wu and P. A. Greaney, J. Am. Chem. Soc., 2017, 139, 13031–13037 CrossRef PubMed.
- Y. Liang, R. Feng, S. Yang, H. Ma, J. Liang and J. Chen, Adv. Mater., 2011, 23, 640–643 CrossRef CAS PubMed.
- H. D. Yoo, Y. Liang, H. Dong, J. Lin, H. Wang, Y. Liu, L. Ma, T. Wu, Y. Li and Q. Ru, Nat. Commun., 2017, 8, 339 CrossRef PubMed.
- Y. Liang, H. D. Yoo, Y. Li, J. Shuai, H. A. Calderon, F. C. Robles Hernandez, L. C. Grabow and Y. Yao, Nano Lett., 2015, 15, 2194–2202 CrossRef CAS PubMed.
- C. Drosos, C. Jia, S. Mathew, R. G. Palgrave, B. Moss, A. Kafizas and D. Vernardou, J. Power Sources, 2018, 384, 355–359 CrossRef CAS.
- Q. Fu, A. Sarapulova, V. Trouillet, L. Zhu, F. Fauth, S. Mangold, E. Welter, S. Indris, M. Knapp and S. Dsoke, J. Am. Chem. Soc., 2019, 141, 2305–2315 CrossRef CAS PubMed.
- J.-S. Kim, W.-S. Chang, R.-H. Kim, D.-Y. Kim, D.-W. Han, K.-H. Lee, S.-S. Lee and S.-G. Doo, J. Power Sources, 2015, 273, 210–215 CrossRef CAS.
- Y. Shao, M. Gu, X. Li, Z. Nie, P. Zuo, G. Li, T. Liu, J. Xiao, Y. Cheng and C. Wang, Nano Lett., 2013, 14, 255–260 CrossRef PubMed.
- T. S. Arthur, N. Singh and M. Matsui, Electrochem. Commun., 2012, 16, 103–106 CrossRef CAS.
- L. R. Parent, Y. Cheng, P. V. Sushko, Y. Shao, J. Liu, C.-M. Wang and N. D. Browning, Nano Lett., 2015, 15, 1177–1182 CrossRef CAS PubMed.
- N. Singh, T. S. Arthur, C. Ling, M. Matsui and F. Mizuno, Chem. Commun., 2013, 49, 149–151 RSC.
- S. Banerjee and S. K. Pati, Chem. Commun., 2016, 52, 8381–8384 RSC.
- Y. Cheng, Y. Shao, L. R. Parent, M. L. Sushko, G. Li, P. V. Sushko, N. D. Browning, C. Wang and J. Liu, Adv. Mater., 2015, 27, 6598–6605 CrossRef CAS PubMed.
- C. Chen, J. Wang, Q. Zhao, Y. Wang and J. Chen, ACS Energy Lett., 2016, 1, 1165–1172 CrossRef CAS.
- Y. Meng, D. Wang, Y. Zhao, R. Lian, Y. Wei, X. Bian, Y. Gao, F. Du, B. Liu and G. Chen, Nanoscale, 2017, 9, 12934–12940 RSC.
- N. Wu, Z. Z. Yang, H. R. Yao, Y. X. Yin, L. Gu and Y. G. Guo, Angew. Chem., 2015, 127, 5849–5853 CrossRef.
- T. Koketsu, J. Ma, B. J. Morgan, M. Body, C. Legein, W. Dachraoui, M. Giannini, A. Demortière, M. Salanne and F. Dardoize, Nat. Mater., 2017, 16, 1142 CrossRef CAS.
- Y. Wang, X. Xue, P. Liu, C. Wang, X. Yi, Y. Hu, L. Ma, G. Zhu, R. Chen and T. Chen, ACS Nano, 2018, 12, 12492–12502 CrossRef CAS.
- N. Wu, Z. Z. Yang, H. R. Yao, Y. X. Yin, L. Gu and Y. G. Guo, Angew. Chem., Int. Ed, 2015, 54, 5757–5761 CrossRef CAS PubMed.
- X. Sun and Y. Li, Chem. – Eur. J., 2003, 9, 2229–2238 CrossRef CAS PubMed.
- H. Liu, D. Yang, Z. Zheng, X. Ke, E. Waclawik, H. Zhu and R. L. Frost, J. Raman Spectrosc., 2010, 41, 1331–1337 CrossRef CAS.
- M. Ocaña, J. V. Garcia-Ramos and C. J. Serna, J. Am. Ceram. Soc., 2010, 75, 2010–2012 CrossRef.
- C. Zhu, X. Mu, P. A. van Aken, Y. Yu and J. Maier, Angew. Chem., Int. Ed., 2014, 53, 2152–2156 CrossRef CAS PubMed.
- Z.-L. Tao, L.-N. Xu, X.-L. Gou, J. Chen and H.-T. Yuan, Chem. Commun., 2004, 2080–2081 RSC.
- X. Sun, P. Bonnick and L. F. Nazar, ACS Energy Lett., 2016, 1, 297–301 CrossRef CAS.
- Q. An, Y. Li, H. D. Yoo, S. Chen, Q. Ru, L. Mai and Y. Yao, Nano Energy, 2015, 18, 265–272 CrossRef CAS.
- P. Novak and J. Desilvestro, J. Electrochem. Soc., 1993, 140, 140–144 CrossRef CAS.
- P. Novák, W. Scheifele, F. Joho and O. Haas, J. Electrochem. Soc., 1995, 142, 2544–2550 CrossRef.
- J. Muldoon, C. B. Bucur and T. Gregory, Chem. Rev., 2014, 114, 11683–11720 CrossRef CAS PubMed.
- H.-R. Yao, Y. You, Y.-X. Yin, L.-J. Wan and Y.-G. Guo, Phys. Chem. Chem. Phys., 2016, 18, 9326–9333 RSC.
- R. M. Kumar, N. Rajini, T. S. M. Kumar, K. Mayandi, S. Siengchin and S. O. Ismail, Mater. Res. Express, 2019, 6, 085330 CrossRef CAS.
- C. R. Tewell, F. Malizia, J. W. Ager and G. A. Somorjai, J. Phys. Chem. B, 2002, 106, 2946–2949 CrossRef CAS.
- P. Bunker, M. Kolbuszewski, P. Jensen, M. Anderson, W. Barclay Jr., L. M. Ziurys, Y. Ni and D. O. Harris, Chem. Phys. Lett., 1995, 239, 217–222 CrossRef CAS.
Footnotes |
| † Electronic supplementary information (ESI) available. See DOI: 10.1039/c9nr08003a |
| ‡ These authors contributed equally to this work. |
| This journal is © The Royal Society of Chemistry 2020 |

