 Open Access Article
Creative Commons Attribution 3.0 Unported Licence
Connectivity dependent thermopower of bridged biphenyl molecules in single-molecule junctions†
Iain M.
Grace
 *a,
Gunnar
Olsen
 b,
Juan
Hurtado-Gallego
 c,
Laura
Rincón-García
 cd,
Gabino
Rubio-Bollinger
ce,
Martin R.
Bryce
 b,
Nicolás
Agraït
cde and
Colin J.
Lambert
 a
a
aDepartment of Physics, Lancaster University, Lancaster, LA1 4YB, UK. E-mail: i.grace@lancaster.ac.uk
bDepartment of Chemistry, Durham University, Durham, UK
cDepartamento de Física de la Materia Condensada, Universidad Autónoma de Madrid, E-28049 Madrid, Spain
dInstituto Madrileño de Estudios Avanzados en Nanociencia IMDEA-Nanociencia, E-28049 Madrid, Spain
eCondensed Matter Physics Center (IFIMAC) and Instituto Universitario de Ciencia de Materiales “Nicolás Cabrera” (INC), Universidad Autónoma de Madrid, E-28049 Madrid, Spain
First published on 27th June 2020
Abstract
We report measurements on gold|single-molecule|gold junctions, using a modified scanning tunneling microscope-break junction (STM-BJ) technique, of the Seebeck coefficient and electrical conductance of a series of bridged biphenyl molecules, with meta connectivities to pyridyl anchor groups. These data are compared with a previously reported study of para-connected analogues. In agreement with a tight binding model, the electrical conductance of the meta series is relatively low and is sensitive to the nature of the bridging groups, whereas in the para case the conductance is higher and relatively insensitive to the presence of the bridging groups. This difference in sensitivity arises from the presence of destructive quantum interference in the π system of the unbridged aromatic core, which is alleviated to different degrees by the presence of bridging groups. More precisely, the Seebeck coefficient of meta-connected molecules was found to vary between −6.1 μV K−1 and −14.1 μV K−1, whereas that of the para-connected molecules varied from −5.5 μV K−1 and −9.0 μV K−1.
Introduction
Progress in molecular-scale electronics requires understanding of the fundamental structure-functionality relationships of molecular junctions that are formed by bridging two metallic electrodes by a single molecule or by assemblies of molecules.1–5 In this context the ability to control heat transport, dissipation, and conversion into electricity in molecular junctions is central to the design and operation of high-performance energy conversion and cooling devices.6–9 Identifying mechanisms to control the Seebeck coefficient of single molecules is an important step towards producing highly efficient thin-film thermoelectric materials. Previous work10 has shown that room-temperature quantum interference (QI) is an important ingredient in determining electron transport through single molecules and furthermore, QI can be controlled by varying the connectivity of aromatic cores to external electrodes.11–19 Crucially, QI effects have been shown to persist when molecules form a self-assembled monolayer (SAM) leading to the possibility of utilizing QI in the design of thin film materials for large-scale practical applications.20 One example of QI can be found in meta- and para-connected molecules, where destructive quantum interference (DQI) in the meta-connected compounds lowers the conductance compared to the constructive quantum interference (CQI) in the para isomers. DQI has also been shown to enhance the Seebeck coefficient21 due to the appearance of an anti-resonance in the HOMO–LUMO gap.Here we investigate the sensitivity of QI to the bridging atom X connecting the two phenyl rings (Fig. 1) in a series of bridged biphenyl-based molecules and in particular, how QI is affected by their meta (molecules 1–7) versus para (molecules 8–10)22 connectivity to terminal pyridyl rings, which link to the external electrodes. Molecules 1–7 were chosen based on synthetic accessibility and to provide a wide range of electronic properties by introducing heteroatom substitution at the bridging position (2, 4, 5 and 7). In order to provide adequate comparisons in this new meta series with the previous study of para analogues22 three direct analogues (1, 3 and 6) were included, two of which (meta1 and 6) correspond to the extremes in that series (para8 and 12). Given the clear trends in the experimental measurements between the three directly comparable meta and para isomers (X = CH21/8; X = CMe23/10; X = C![[double bond, length as m-dash]](https://www.rsc.org/images/entities/char_e001.gif) O 6/12–see below) additional meta derivatives were not synthesised. The tricyclic core and pyridyl anchors in 1–10 are distinctly different from the two oligophenyleneethynylene (OPE3) molecules with thiolate anchors reported by Reddy et al. where meta connectivity was shown to enhance the thermopower by a factor of approximately 2 with respect to the para-connected compound.21
O 6/12–see below) additional meta derivatives were not synthesised. The tricyclic core and pyridyl anchors in 1–10 are distinctly different from the two oligophenyleneethynylene (OPE3) molecules with thiolate anchors reported by Reddy et al. where meta connectivity was shown to enhance the thermopower by a factor of approximately 2 with respect to the para-connected compound.21
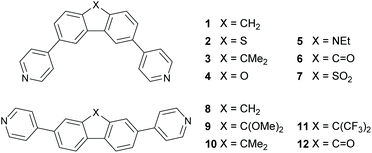 | ||
| Fig. 1 Structures of the molecules discussed in this work and their nomenclature. The structures represent the meta-linked series 1–7 (top) and the previously reported22para-linked series 8–12 (bottom). | ||
Molecule synthesis
The compounds 1–7 (Fig. 1) were synthesized in 52–93% yields from the corresponding dibromide precursors by two-fold Suzuki–Miyaura reactions with 4-pyridylboronic acid (Fig. 2). Full details of the synthesis, spectroscopic, and analytical characterization are given in the ESI (S4.2†). The dibromo precursors (2a,234a,245a25 and 7a26) were synthesized as reported previously. 1a was synthesised by reduction of 3,6-dibromo-9H-fluoren-9-one (6a) using Wolff–Kishner conditions; 3a was synthesised by methylation of 1a with methyl iodide. | ||
Fig. 2 Synthesis of 1–7 under Suzuki conditions (a) 4-pyridylboronic acid, Na2CO3, Pd(PPh3)4, DME 2![[thin space (1/6-em)]](https://www.rsc.org/images/entities/char_2009.gif) : :![[thin space (1/6-em)]](https://www.rsc.org/images/entities/char_2009.gif) 1 H2O, reflux, 16–24 h. 1 H2O, reflux, 16–24 h. | ||
Theoretical model
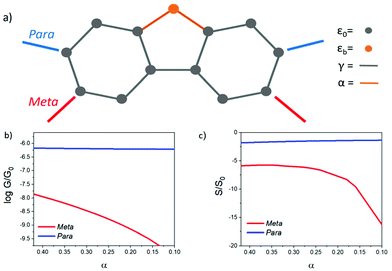
To understand the role of QI in controlling the electrical conductance, G and the Seebeck coefficient, S of 1–10, a tight binding model of the π system of the core unit was constructed, as shown in Fig. 3a. This model has previously been used to investigate the transmission coefficient27 in similar bridged biphenyl based molecules and associates a πz orbital of energy ε0 to each carbon atom and a hopping integral of −γ between neighbouring πz orbitals. Such a model contains information about connectivity alone, since ε0 simply defines the energy origin and γ sets the energy scale. For convenience, we choose ε0 = 0 and express all other energies in units of γ. The effect of the bridging group X is modelled by assigning an orbital of energy εbγ to this group and a hopping integral −αγ between X and the neighbouring carbons. Finally, two one-dimensional leads are connected to the phenyl rings with either meta or para connectivities, as shown in Fig. 3a. The leads are represented by semi-infinite chains of π orbitals, with site energies ε0 and hopping integrals −γ, whose terminal sites are connected to carbon atoms of the phenyl rings (as indicated in Fig. 3a) by hopping integrals −Γγ. To obtain an estimate of the Seebeck coefficient, S, and electrical conductance, G, the transmission coefficient T(E) was first computed for electrons of energy E passing through this structure from one lead to the other and then S and G were obtained from the formulae4| G = G0T(EF) | (1) |
 | (2) |
To reveal the evolution of transport properties with increasing coupling to the bridging groups, Fig. S1 in the ESI† shows the transmission coefficients obtained for values of the dimensionless parameter α varying between 0 (no coupling) and the strong coupling limit α = 1 (i.e. coupling equal to that between π orbitals of neighbouring carbon atoms of the phenyl rings). These coefficients show that for a Fermi energy near the middle of the HOMO–LUMO gap, in the para case, T(EF) (and therefore the electrical conductance) is relatively insensitive to the presence of the bridging group, whereas in the meta case the conductance is much more sensitive to the details of the interaction with the bridging group.
When α = 0, the orbital of the bridging group is decoupled from the central core, and the π system lies on a bipartite lattice. Consequently, in the meta case, DQI occurs at the centre of the HOMO–LUMO gap (i.e. E = 0 eV), signalled by the presence of a sharp dip in T(E),27 whereas in the para case, CQI occurs. In the meta case, the slope of T(E) near E = 0 is high, leading to potentially high values of S, whereas in the para case, the slope is low leading to low values of S. As an example, Fig. S3† shows the room-temperature Seebeck coefficient S/S0 evaluated at EF/γ = 0.1. In the absence of a bridging group (i.e. when α = 0), a high value for S/S0 (≈37) is obtained in the meta case, whereas in the para case, S/S0 has a low value (≈1) due to CQI and the absence of a DQI dip. As shown in Fig. S2 of the ESI,† these values depend on the coupling strength Γ to the electrodes, but the Seebeck coefficient of the meta-connected bridged biphenyl core always exceeds that of the para-connected core. Since all the experimentally measured molecules of Fig. 1 contain bridging groups with non-zero coupling to the core, the α = 0 case is not experimentally accessible. Therefore, in Fig. 3 results for S and G are shown for intermediate values of α.
In the presence of the bridging atom (i.e. when α is non-zero), a new conductance pathway is introduced, which alleviates DQI in the meta case, leading to a decrease in S, whereas in the para case, the non-zero coupling to the bridging group has a less significant effect within the HOMO–LUMO gap. This simple model predicts that while the bridging group removes the DQI feature, the enhancement of S in the meta case persists.
Quantum transport measurements
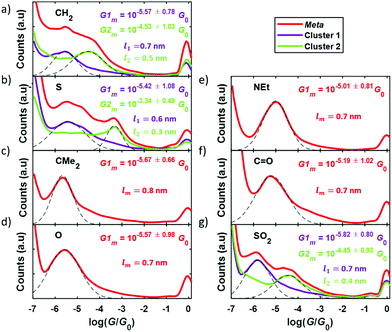
Experimental conductance and thermopower measurements were performed at room temperature and ambient conditions using a home-built scanning tunneling microscope (STM) and the STM-Break Junction technique to form single-molecule junctions. Mechanically cut Au tips (0.25 mm diameter, 99.99% purity, Goodfellow) and pre-annealed Au (111) samples (11 × 11 mm2, Arrandee) were used as electrodes and each compound was deposited onto the sample by drop casting technique from a 1 mM solution. Further details on the experimental procedure can be found in the experimental methods section in the ESI (S5).†Conductance measurements were performed by measuring thousands of IZ curves for each compound, where I is the current through the junction and Z is the tip displacement. In these IZ curves, the tip is indented into the surface and then withdrawn and, in the presence of molecules on the surface, there is a certain probability to connect one of them and form a single-molecule junction. In this case the so-called junction-characteristic plateau can be observed in the IZ curve. Using a non-supervised clustering technique (k-means in Matlab)28–30 through which we can identify and separate individual IZ curves with similar behaviors, we could easily separate curves with a molecular junction from others that presented just a tunneling behavior. With all the resulting curves, those with a signature of a molecular junction being formed, the corresponding conductance was calculated dividing by the bias voltage applied (Vbias = 200 mV) and conductance 1D histograms were built, shown in Fig. 4 for all the compounds. Junction-characteristic conductance peaks can be observed in these histograms between the well-known peak for Au–Au contact (log10 (G/G0) = 0) and the noise level of the experimental setup (log10 (G/G0) = −6.5).
A single peak is typically observed in each complete histogram (plotted in red in Fig. 4), although, as can be seen in Fig. 4a, b and g three of them (1, 2, and 7) present two conductance peaks, reflecting the possibility to obtain two different plateaus when forming these molecular junctions. This is possibly due to two different junction configurations: connection of the electrodes to both anchor groups or connection to one anchor group and to the central moiety. The above-mentioned clustering technique allowed to separate both configurations in two different clusters (cluster 1 and cluster 2) and to get the corresponding 1D histograms, plotted in purple and green in Fig. 4. Gaussian fits applied to the conductance peak(s) obtained for all the compounds (dashed lines in Fig. 4) are used to get the most probable conductance value of each of them, as well as its standard deviation. These values are given in Fig. 4 as Gm or as G1m and G2m when having two peaks. Complementary, a more detailed examination of the difference between conductance peaks in the case of compounds 1, 2, and 7 was performed by addressing the analysis of the length of the plateaus in each cluster. This was performed by calculating the separation between G1m ± Gstd and between G2m ± Gstd and the result was that the high-conductance plateaus (giving rise to G2m) are in average shorter than the low-conductance ones (corresponding to G1m) by approximately a difference of 0.2 nm (0.3 nm in the case of compound 2). The mean plateau lengths l1 and l2 are given in Fig. 4a, b and g for the low- and high-conductance plateaus, respectively (in purple for cluster 1 and in green for cluster 2). The fact that the longer plateaus show lower conductance suggests that they correspond to the junction configuration where both electrode-molecule connections are through the anchor groups of the compounds. The main goal of this study is the analysis of the effect of the meta-para connectivity on the thermoelectrical properties, so in the case of molecules showing two conductance peaks we focus in what follows on the low-conductance plateaus for direct comparison with the rest of the compounds and with the para series.
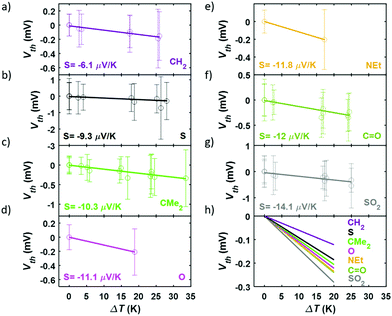
In order to perform the experimental thermoelectric characterization, a temperature difference, ΔT, was established between both electrodes and small voltage ramps were applied during the formation of the molecular junctions with the STM-BJ technique, as detailed in the Experimental Methods section in the ESI (S5†). The voltage ramps (or IV curves) allowed to measure simultaneously the conductance, G, and the thermovoltage, Vth, at different points of each single-molecule junction. Additionally, the thermovoltage response of all the compounds was measured for different ΔT between 0 and 34 K, depending on the molecule. The different sets of thermovoltage values were then fitted with Gaussian distributions obtaining for each of them the mean thermovoltage and the standard deviation. These values are plotted in Fig. 5 as empty circles and error bars, respectively, as a function of the temperature difference between tip and sample. The Seebeck coefficient, described by S = −Vth/ΔT, was obtained from the slope of linear fits to all the Vthvs. ΔT data points and the values are also shown in Fig. 5. All the compounds show a negative Seebeck coefficient indicating transport mainly through the LUMO, which is a characteristic feature of pyridyl anchored systems.31 The values range from S = −6.1 μV K−1 for the bare fluorene (compound 1) to S = −14.1 μV K−1 for compound 7 junctions. The relative error of S values is smaller than 3% for all the molecules.
Summarizing the experimental results obtained, the measured conductance and thermopower values for different bridging groups X are shown in Fig. 6. Direct comparison with the para-connected compounds is also shown in this figure, where the previously reported values of G and S of this family have been included. Considering the conductance, the meta-connected molecules have a most probable conductance value between 10−5.01G0 and 10−5.82G0, that is, around 0.5–1.5 orders of magnitude smaller than the conductance of the para-connected counterparts. This is in agreement with the tight binding model results, confirming that for the meta series the conductance values are lower and sensitive to the nature of the bridging groups (with a conductance variation ΔG = 0.81![[thin space (1/6-em)]](https://www.rsc.org/images/entities/char_2009.gif) log10(G/G0)), whereas in the para case the conductance is higher and is rather insensitive to the different bridging groups (showing a conductance variation ΔG = 0.21
log10(G/G0)), whereas in the para case the conductance is higher and is rather insensitive to the different bridging groups (showing a conductance variation ΔG = 0.21![[thin space (1/6-em)]](https://www.rsc.org/images/entities/char_2009.gif) log10(G/G0)). In Fig. S80† the results are presented in order of increasing meta-connected conductance, with X = SO2 giving the lowest conductance and X = NEt, the highest. With respect to the thermopower, the measured values are again in agreement with the tight binding model and the meta-connected molecules present a larger thermopower than the para-connected counterparts (Fig. 6). Values range from −6.1 to −14.1 μV K−1 for compounds 1–7, which is a factor 1.1–2.6 larger than in the para series and which means a total thermopower variation ΔS = 8 μV K−1 within the series while for the para case it is just ΔS = 3.5 μV K−1. Although the values of |S| do not simply increase with decreasing G, as predicted by the tight binding model, we note that the highest measured value of |S| corresponds to the lowest value of G (i.e. for X = SO2). All in all, the data shown in Fig. 6 confirms that the meta configuration reduces the conductance and enhances the Seebeck coefficient, as predicted by quantum interference theory.4 Additionally, the investigation of different bridging groups highlights the fact that they have a stronger influence both in G and S of meta-connected compounds compared to para analogues.
log10(G/G0)). In Fig. S80† the results are presented in order of increasing meta-connected conductance, with X = SO2 giving the lowest conductance and X = NEt, the highest. With respect to the thermopower, the measured values are again in agreement with the tight binding model and the meta-connected molecules present a larger thermopower than the para-connected counterparts (Fig. 6). Values range from −6.1 to −14.1 μV K−1 for compounds 1–7, which is a factor 1.1–2.6 larger than in the para series and which means a total thermopower variation ΔS = 8 μV K−1 within the series while for the para case it is just ΔS = 3.5 μV K−1. Although the values of |S| do not simply increase with decreasing G, as predicted by the tight binding model, we note that the highest measured value of |S| corresponds to the lowest value of G (i.e. for X = SO2). All in all, the data shown in Fig. 6 confirms that the meta configuration reduces the conductance and enhances the Seebeck coefficient, as predicted by quantum interference theory.4 Additionally, the investigation of different bridging groups highlights the fact that they have a stronger influence both in G and S of meta-connected compounds compared to para analogues.
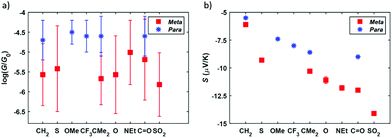 | ||
| Fig. 6 Measured conductance G (a) and Seebeck coefficient S (b) for the meta-connected compounds 1–7 (red squares) and comparison with the values of the para-connected systems (blue stars).22 The error bars of G are the standard deviation obtained from Gaussian fits applied to the conductance peaks observed in the corresponding 1D histogram. The error bars of S are the relative error of the thermopower obtained from the linear regression fitted to the corresponding Vthvs. ΔT data. These error bars are also included in (b), although most of them are not visible given its reduced value (less than 3% of the Seebeck coefficient for all the compounds). | ||
The mean plateau lengths in Fig. 4 for the meta series varies between 0.6 and 0.8 nm, therefore we assume that their contact behaviour in the junction is similar meaning that the variation in the Seebeck coefficient is due to the changing chemical structure. To further understand the observed experimental trends in the Seebeck coefficient data we have attempted to find a correlation between Seebeck coefficient and other parameters (conductance, HOMO–LUMO-gap, EA, IP, UV-vis and 1H-NMR data). However, none of these adequately correlates to the observed trend for the Seebeck coefficient. This is further discussed in section S6 of the ESI.† When examining the trends, it is observed that for both para and meta series the lowest |S| is for the bare core (X = CH2) and any modification results in a significant increase of |S|. Furthermore, in both series the highest |S| is observed for substitutions with carbonyl (X = C![[double bond, length as m-dash]](https://www.rsc.org/images/entities/char_e001.gif) O) or sulfonyl (X = SO2) groups, both of which introduce a polarised bond. A possible explanation for the trend is based on vibrational modes. Considering a molecule trapped in a junction, the primary way it will respond to a change in thermal energy will be through vibrations. If we consider the structural effect of these vibrations, for the rigid cores only small structural perturbations can be achieved. For the bare core (X = CH2), C–H vibrations are the only available vibrations, whereas the substituents in all the other compounds can achieve larger structural perturbations though stretching or bending vibrations. Introduction of heteroatoms can increase the electronic effect of these perturbations because the bonds become polarised, especially for carbonyl (X = C
O) or sulfonyl (X = SO2) groups, both of which introduce a polarised bond. A possible explanation for the trend is based on vibrational modes. Considering a molecule trapped in a junction, the primary way it will respond to a change in thermal energy will be through vibrations. If we consider the structural effect of these vibrations, for the rigid cores only small structural perturbations can be achieved. For the bare core (X = CH2), C–H vibrations are the only available vibrations, whereas the substituents in all the other compounds can achieve larger structural perturbations though stretching or bending vibrations. Introduction of heteroatoms can increase the electronic effect of these perturbations because the bonds become polarised, especially for carbonyl (X = C![[double bond, length as m-dash]](https://www.rsc.org/images/entities/char_e001.gif) O) or sulfonyl (X = SO2) groups. This is a possible explanation to the observed trend that any substitution, relative to X = CH2, provides a significant increase in structural perturbation caused by vibrations, and the more polarised bond further increases this effect. Based on this rationale the reason for 7 having a higher |S| than 6 could be a result of the asymmetry in the vibrational modes of 7 resulting in an increased electronic effect of the vibration. This is a hypothesis that seems to fit the current data but verification requires further studies that are beyond the scope of the present work. In between these extremes, compounds with a certain degree of structural perturbations with respect to the bare core have been ordered by increasing thermopower in Fig. 6.
O) or sulfonyl (X = SO2) groups. This is a possible explanation to the observed trend that any substitution, relative to X = CH2, provides a significant increase in structural perturbation caused by vibrations, and the more polarised bond further increases this effect. Based on this rationale the reason for 7 having a higher |S| than 6 could be a result of the asymmetry in the vibrational modes of 7 resulting in an increased electronic effect of the vibration. This is a hypothesis that seems to fit the current data but verification requires further studies that are beyond the scope of the present work. In between these extremes, compounds with a certain degree of structural perturbations with respect to the bare core have been ordered by increasing thermopower in Fig. 6.
Quantum transport simulations
The above discussion demonstrates that a tight binding model can explain the qualitative trends in the conductance and Seebeck measurements. These results are now compared with quantum transport calculations using the density functional code SIESTA32 and the transport code Gollum33 to model in detail the STM measurements.After first calculating the optimum geometry using SIESTA, the ionization potential (IP) and electron affinity (EA) of each molecule was then evaluated (see Table 1). These results reveal that the HOMO–LUMO gap of molecules with pyridyl in the para position is significantly smaller than their meta-connected counterparts, because electron affinity is higher in the case of para coupling. This differs from the tight binding model, where the gap is almost independent of connectivity. This behaviour is also present in the Kohn–Sham HOMO and LUMO eigenvalues (ESI Table S1†). These values reveal no obvious correlation with the measured transport coefficients. For example, X = CMe2 and X = CH2 have almost identical EAs and IPs, but their measured conductance and Seebeck coefficient (Fig. 6) are very different. On the other hand, the meta-connected X = SO2 and X = NEt have the highest and lowest IPs, respectively, which inversely correlates with the lowest and highest measured conductance.
| X | para | meta | ||
|---|---|---|---|---|
| IP (eV) | EA (eV) | IP (eV) | EA (eV) | |
| CH2 | 6.75 | 0.22 | 6.85 | −0.10 |
| S | 6.76 | 0.29 | 6.71 | −0.12 |
| CMe2 | 6.78 | 0.25 | 6.81 | −0.07 |
| O | 6.86 | 0.27 | 6.91 | −0.16 |
| Net | 6.56 | 0.14 | 6.47 | −0.28 |
C![[double bond, length as m-dash]](https://www.rsc.org/images/entities/char_e001.gif) O O |
6.93 | 0.81 | 7.03 | 0.88 |
| SO2 | 7.08 | 0.69 | 7.18 | 0.55 |
With this geometry, the transmission coefficient T(E) was calculated for each of the molecules (Fig. S22†) and their corresponding values of S and G were obtained. For this contact geometry the results do not follow the trends in experimental measurements (Fig. S23–29†) with the theoretical Seebeck coefficients of the para molecules being larger than those of the equivalent meta-connected molecules. These results point to the importance of the electrode shape and binding geometry in determining transport coefficients. To further investigate this feature, the effect of changing the coupling strength between the electrodes and molecules was investigated by varying the distance d (Fig. 7a and b) between the terminal nitrogen atom and the tip gold atom. We find (Fig. 7c and d) that the trends in the conductance and Seebeck coefficient only match the experimental behaviour if different contact strengths (obtained from the nitrogen-tip distances shown in Table 2) are chosen, depending on the connectivity and bridging group. The data show that generally choosing the stronger coupling for the meta series compared to the para series results in a larger Seebeck coefficient for the meta-connected molecules.
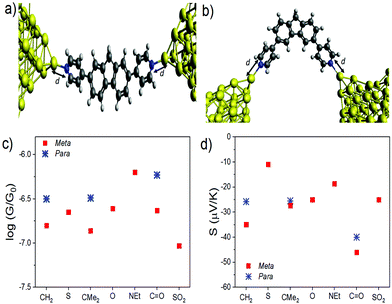 | ||
| Fig. 7 Junction geometry for (a) the meta series and (b) para series, represented by molecules 8 and 1, respectively (c) Conductance, G, and (d) thermopower, S, evaluated at E−EF = 0 eV for varying bridging groups X using the values of d given in Table 2. | ||
| X | d (para) (Å) | d (meta) (Å) |
|---|---|---|
| CH2 | 2.6 | 2.15 |
| S | 2.4 | |
| CMe2 | 2.6 | 2.2 |
| O | 2.4 | |
| NEt | 2.4 | |
C![[double bond, length as m-dash]](https://www.rsc.org/images/entities/char_e001.gif) O O |
2.6 | 2.6 |
| SO2 | 2.5 |
This sensitivity to the contact geometry has been noted previously34,35 where it was shown that the thermopower of a junction can be controlled by changing the contact strength between molecule and electrode. Since the para-connected molecules 8, 10 & 12 are much more linear than the meta-connected molecules 1–7 it is not surprising that their contacting behaviour is significantly different. In an experiment, these are random quantities, which vary from measurement to measurement and their distributions are unknown. Here, in the calculations the effect of varying only one parameter (the coupling strength via the distance d) is changed to give good agreement with experiment. In the ESI,† the effect of varying the relative orientation of the electrode tips and varying the location of the Fermi energy relative to the HOMO and LUMO are also explored. In an experiment, the distribution of these quantities is not known.
Conclusions
In summary, we have synthesized a series of seven bridged biphenyl derivatives with meta connectivities to pyridyl anchor groups. Their single-molecule Seebeck coefficient and electrical conductance have been measured by STM-BJ techniques and the values compared with isomeric structures with para connectivities to the anchor groups. In agreement with a tight binding model, the electrical conductance of the meta series is relatively low and is sensitive to the nature of the bridging group, whereas in the para case the conductance is higher and relatively insensitive to the presence of the bridging group. This difference in sensitivity arises from the presence of destructive quantum interference in the π system of the unbridged biphenyl core, which is alleviated to different degrees by the presence of bridging groups. More precisely, the Seebeck coefficients of meta-connected molecules were found to vary between −6.1 μV K−1 and −14.1 μV K−1, whereas those of the para-connected molecules varied from −5.5 μV K−1 and −9.0 μV K−1. These trends in the measured Seebeck coefficient are also in qualitative agreement with the tight binding model, which predicts that the meta-connected values of |S| should be larger than the para-connected values. Detailed simulations based on density functional theory reveal that measured Seebeck coefficients are rather sensitive to the geometry of the electrode-molecule contact and to the shape of the electrodes. Our results demonstrate that meta molecular connectivity and associated quantum interference phenomena in bridged biphenyl derivatives can be harnessed to achieve enhanced thermoelectric performance in molecular junctions.Conflicts of interest
There are no conflicts to declare.Acknowledgements
This work was supported by EC H2020 FET Open projects: grant agreement numbers 767187 ‘QuIET’ and 766853 ‘EFINED’. N. A. and G. R.-B. acknowledge funding from the Comunidad de Madrid NANOMAGCOST-CM (P2018/NMT-4321) and Spanish Ministry of Science and Innovation through grants MAT2017-88693-R and the María de Maeztu Programme for Units of Excellence in R&D (CEX2018-000805-M). N. A. and L. R.-G. acknowledge funding from the Education and Research Council of the Comunidad de Madrid and the European Social Fund (Ref. PEJD-2019-POST/IND-16353). M. R. B. thanks EPSRC grant EP/K0394/23/1 for funding. G. O. thanks the Danish Council for Independent Research, Technology and Production Sciences for funding (grant FTP, 8027-00005B).Notes and references
- D. Xiang, X. Wang, C. Jia, T. Lee and X. Guo, Chem. Rev., 2016, 116, 4318–4440 CrossRef CAS PubMed.
- T. A. Su, M. Neupane, M. L. Steigerwald, L. Venkataraman and C. Nuckolls, Nat. Rev. Mater., 2016, 1, 16002 CrossRef CAS.
- J. Cuevas and E. Scheer, Molecular Electronics: An Introduction to Theory and Experiment, 2nd edn, World Scientific, 2017 Search PubMed.
- C. J. Lambert, Chem. Soc. Rev., 2015, 44, 875–888 RSC.
- W. Lee, K. Kim, W. Jeong, L. A. Zotti, F. Pauly, J. C. Cuevas and P. Reddy, Nature, 2013, 498, 209–212 CrossRef CAS PubMed.
- C. J. Lambert, H. Sadeghi and Q. H. Al-Galiby, C. R. Phys., 2016, 17, 1084–1095 CrossRef CAS.
- L. Rincón-García, C. Evangeli, G. Rubio-Bollinger and N. Agraït, Chem. Soc. Rev., 2016, 45, 4285–4306 RSC.
- Q. Zhang, Y. Sun, W. Xu and D. Zhu, Adv. Mater., 2014, 26, 6829–6851 CrossRef CAS PubMed.
- W. B. Chang, C.-K. Mai, M. Kotiuga, J. B. Neaton, G. C. Bazan and R. A. Segalman, Chem. Mater., 2014, 26, 7229–7235 CrossRef CAS.
- C. M. Finch, V. M. García-Suárez and C. J. Lambert, Phys. Rev. B: Condens. Matter Mater. Phys., 2009, 79, 033405 CrossRef.
- Y. Geng, S. Sangtarash, C. Huang, H. Sadeghi, Y. Fu, W. Hong, T. Wandlowski, S. Decurtins, C. J. Lambert and S.-X. Liu, J. Am. Chem. Soc., 2015, 137, 4469–4476 CrossRef CAS PubMed.
- M. H. Garner, G. C. Solomon and M. Strange, J. Phys. Chem. C, 2016, 120, 9097–9103 CrossRef CAS.
- S. Sangtarash, C. Huang, H. Sadeghi, G. Sorohhov, J. Hauser, T. Wandlowski, W. Hong, S. Decurtins, S.-X. Liu and C. J. Lambert, J. Am. Chem. Soc., 2015, 137, 11425–11431 CrossRef CAS PubMed.
- S. Sangtarash, H. Sadeghi and C. J. Lambert, Phys. Chem. Chem. Phys., 2018, 20, 9630–9637 RSC.
- C. R. Arroyo, S. Tarkuc, R. Frisenda, J. S. Seldenthuis, C. H. M. Woerde, R. Eelkema, F. C. Grozema and H. S. J. van der Zant, Angew. Chem., Int. Ed., 2013, 52, 3152–3155 CrossRef CAS PubMed.
- D. Z. Manrique, C. Huang, M. Baghernejad, X. Zhao, O. A. Al-Owaedi, H. Sadeghi, V. Kaliginedi, W. Hong, M. Gulcur, T. Wandlowski, M. R. Bryce and C. J. Lambert, Nat. Commun., 2015, 6, 6389 CrossRef CAS PubMed.
- H. Vazquez, R. Skouta, S. Schneebeli, M. Kamenetska, R. Breslow, L. Venkataraman and M. S. Hybertsen, Nat. Nanotechnol., 2012, 7, 663–667 CrossRef CAS PubMed.
- G. C. Solomon, D. Q. Andrews, T. Hansen, R. H. Goldsmith, M. R. Wasielewski, R. P. Van Duyne and M. A. Ratner, J. Chem. Phys., 2008, 129, 054701 CrossRef PubMed.
- S. Naghibi, A. K. Ismael, A. Vezzoli, M. K. Al-Khaykanee, X. Zheng, I. M. Grace, D. Bethell, S. J. Higgins, C. J. Lambert and R. J. Nichols, J. Phys. Chem. Lett., 2019, 10, 6419–6424 CrossRef CAS PubMed.
- M. Famili, C. Jia, X. Liu, P. Wang, I. M. Grace, J. Guo, Y. Liu, Z. Feng, Y. Wang, Z. Zhao, S. Decurtins, R. Häner, Y. Huang, S.-X. Liu, C. J. Lambert and X. Duan, Chem, 2019, 5, 474–484 CAS.
- R. Miao, H. Xu, M. Skripnik, L. Cui, K. Wang, K. G. L. Pedersen, M. Leijnse, F. Pauly, K. Wärnmark, E. Meyhofer, P. Reddy and H. Linke, Nano Lett., 2018, 18, 5666–5672 CrossRef CAS PubMed.
- G. Yzambart, L. Rincón-García, A. A. Al-Jobory, A. K. Ismael, G. Rubio-Bollinger, C. J. Lambert, N. Agraït and M. R. Bryce, J. Phys. Chem. C, 2018, 122, 27198–27204 CrossRef CAS PubMed.
- W. R. Turner and L. M. Werbel, J. Med. Chem., 1985, 28, 1728–1740 CrossRef CAS PubMed.
- J. B. Bremner, P. A. Keller, S. G. Pyne, A. D. Robertson, B. W. Skelton, A. H. White and H. M. Witchard, Aust. J. Chem., 2000, 53, 535–540 CrossRef CAS.
- S. H. Kim, I. Cho, M. K. Sim, S. Park and S. Y. Park, J. Mater. Chem., 2011, 21, 9139–9148 RSC.
- J. Ye, C.-J. Zheng, X.-M. Ou, X.-H. Zhang, M.-K. Fung and C.-S. Lee, Adv. Mater., 2012, 24, 3410–3414 CrossRef CAS PubMed.
- M. Gantenbein, L. Wang, A. A. Al-jobory, A. K. Ismael, C. J. Lambert, W. Hong and M. R. Bryce, Sci. Rep., 2017, 7, 1794 CrossRef PubMed.
- M. Lemmer, M. S. Inkpen, K. Kornysheva, N. J. Long and T. Albrecht, Nat. Commun., 2016, 7, 12922 CrossRef CAS PubMed.
- D. Cabosart, M. El Abbassi, D. Stefani, R. Frisenda, M. Calame, H. S. J. van der Zant and M. L. Perrin, Appl. Phys. Lett., 2019, 114, 143102 CrossRef.
- L. A. Zotti, B. Bednarz, J. Hurtado-Gallego, D. Cabosart, G. Rubio-Bollinger, N. Agrait and H. S. van der Zant, Biomolecules, 2019, 9, 580 CrossRef CAS PubMed.
- J. R. Widawsky, P. Darancet, J. B. Neaton and L. Venkataraman, Nano Lett., 2012, 12, 354–358 CrossRef CAS PubMed.
- J. M. Soler, E. Artacho, J. D. Gale, A. García, J. Junquera, P. Ordejón and D. Sánchez-Portal, J. Phys.: Condens. Matter, 2002, 14, 2745–2779 CrossRef CAS.
- J. Ferrer, C. J. Lambert, V. M. García-Suárez, D. Z. Manrique, D. Visontai, L. Oroszlany, R. Rodríguez-Ferradás, I. Grace, S. W. D. Bailey, K. Gillemot, H. Sadeghi and L. A. Algharagholy, New J. Phys., 2014, 16, 093029 CrossRef.
- L. Rincón-García, A. K. Ismael, C. Evangeli, I. Grace, G. Rubio-Bollinger, K. Porfyrakis, N. Agraït and C. J. Lambert, Nat. Mater., 2016, 15, 289–293 CrossRef PubMed.
- J. Vacek, J. V. Chocholoušová, I. G. Stará, I. Starý and Y. Dubi, Nanoscale, 2015, 7, 8793–8802 RSC.
Footnote |
| † Electronic supplementary information (ESI) available: Synthesis of 1–7; experimental details of conductance and thermopower measurements; further details of theoretical methods; correlation study of Seebeck coefficient with other parameters. See DOI: 10.1039/d0nr04001k |
| This journal is © The Royal Society of Chemistry 2020 |

