 Open Access Article
A [Pd2L4]4+ cage complex for n-octyl-β-D-glycoside recognition†
Xander
Schaapkens
,
Eduard O.
Bobylev
,
Joost N. H.
Reek
 and
Tiddo J.
Mooibroek
 *
*
Van ‘t Hoff Institute for Molecular Sciences, University of Amsterdam, Science Park 904, 1098 XH, Amsterdam, The Netherlands. E-mail: t.j.mooibroek@uva.nl
First published on 9th June 2020
Abstract
The cage complex [Pd294]4+ (3′) binds n-octyl glycosides in DCM/DMSO (9![[thin space (1/6-em)]](https://www.rsc.org/images/entities/char_2009.gif) :
:![[thin space (1/6-em)]](https://www.rsc.org/images/entities/char_2009.gif) 1) solution with Ka ≈ 51 M−1 for n-Oct-β-D-Glc and Ka ≈ 29 M−1 for n-Oct-β-D-Gal.
1) solution with Ka ≈ 51 M−1 for n-Oct-β-D-Glc and Ka ≈ 29 M−1 for n-Oct-β-D-Gal.
Carbohydrates are Nature's most abundant and versatile molecules.1 Several diseases have been linked to processes involving carbohydrates (e.g. diabetes, infection, and cancer metastasis).2 Many other regular processes are also mediated by carbohydrate molecules, including fertilization,3 neuronal development,4 hormonal activities,5 immune surveillance6 and inflammatory responses.7 Understanding and intervening in these processes are therefore exploited in medicinal therapies, glycobiology, and biomedical research in general.8 Such research efforts require strategies to selectively bind carbohydrates. In Nature carbohydrates are bound by using lectins, which generally have relatively low affinities for their target monosaccharides (Ka ∼ 102–103 M−1)9 and are often rather non-selective. An inspirational exception is the affinity of E. coli galactose chemoreceptor protein for glucose (Ka = 106–107 M−1).10 The structure of the binding site of this complex is shown in Fig. 1a (2GBP)11 and reveals a high degree of interaction complementarity. Two aromatic residues (Trp and Phe) sandwich the flat glucose molecule with hydrophobic CH⋯π interactions12 and an array of polar residues complement the hydroxyl exterior of glucose by hydrogen bonding. This interaction complementarity has been mimicked by artificial carbohydrate binding molecules.13 One example is the macrocyle 1 shown in Fig. 1b, which comprises pyrenyl surfaces for CH⋯π interactions and polar isophthalamide spacers for hydrogen bonding.13a One drawback of such covalent constructs, however, is that their synthetic routes culminate in one (or more) macrocyclization step(s) that rarely exceed ∼20%.13a,c,14 This drawback can in principle be remedied if the cyclization is accomplished by use of dynamic bonds, such as coordination bonds between a ligand (L) and a transition metal (M). Interestingly, [M2L4]4+ complexes in which M is a square planar d8 metal (e.g. Pd2+ or Pt2+) and L is a dipyridyl ligand have been known for more than 20 years and generally have a fairly small cavity.15 While such [M2L4]4+ complexes are typically filled with counter anions,16 complex 2 shown in Fig. 1c was recently reported to bind D-sucrose using CH⋯π interactions.17
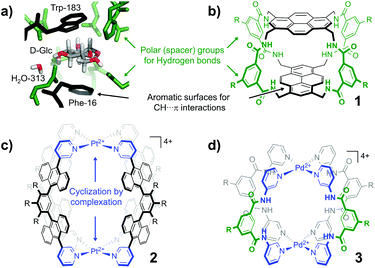 | ||
| Fig. 1 Cage design for binding carbohydrates: (a) Galactose lectin (2GBP) with D-glucose.11 (b) Covalent macrocycle 1.13a (c) Coordination cage 2 with aromatic (hydrophobic) spacers.17 (d) Coordination cage 3 with polar spacers (also used in this work). R = a group that can be used to control solubility. | ||
We envisioned that the polar isophthalamide spacers employed in 1 could be combined with the easy synthesis of [M2L4]4+ type complexes such as 2. Indeed, structures like 3 shown in Fig. 1d have been reported, although they were mainly studied in the solid state and are reportedly only sparingly soluble in solvents such as N,N-dimethylformamide (DMF) and dimethyl sulfoxide (DMSO).18 Herein, we report a version of cage 3 (cage 3′) that is soluble in apolar media and show that the cavity of 3′ binds to n-octyl glycosides. This facile solubilisation was realized by installation of an aliphatic dendritic side group (R′), as is shown in Scheme 1.
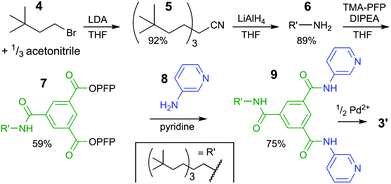 | ||
| Scheme 1 Synthetic pathway to bis-pyridyl ligand 9. See ESI† for experimental details and full charachterizations. LDA = lithium diisopropylamide, THF = tetrahydrofuran, TMA-PFP = the pentafluoro-phenyl(PFP) ester of trimesic acid, DIPEA = N,N-diisopropylethylamine. | ||
The synthesis of the solubilizing group started with triple alkylation of acetonitrile with 3,3-dimethyl-1-bromobutane (4), which was obtained by bromination of the commercial available alcohol. The resulting nitrile 5 was reduced to amine 6, which was used to displaced one pentafluorophenyl (PFP) on 1,3,5-benzenetricarboxylic acid tris-PFP ester to form intermediate 7. The resulting compound was treated with a six-fold excess of 3-aminopyridine (8) forming the desired ligand 9 in 75% isolated yield (see section S2† for full details).
The intended [Pd294]2+ caging complex was readily prepared in DMSO-d6 as is detailed on pages 22–30 of the ESI.†‡ To study this cage and its binding properties in a less competitive matrix, we probed if complex synthesis was also possible in a CD2Cl2/DMSO-d6 (9![[thin space (1/6-em)]](https://www.rsc.org/images/entities/char_2009.gif) :
:![[thin space (1/6-em)]](https://www.rsc.org/images/entities/char_2009.gif) 1) solvent mixture.
1) solvent mixture.
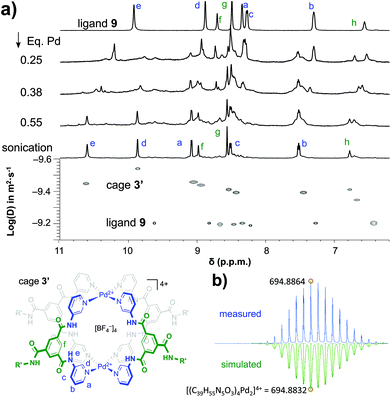
As is shown in Fig. 2a, the stepwise addition of [Pd(MeCN)4](BF4)2 to ligand 9 in this mixture resulted in significant downfield shifts and signal broadening of the 1H-NMR signals in the aromatic region of 9 (∼7–10 ppm). No more changes were observed after addition of 0.55 equivalents of Pd. Sonication of this sample resulted in a well-defined spectrum of a major species in which all protons originating from 9 can be identified and are consistent with cage structure[Pd294]4+ (i.e.3′). The large downfield shifts of protons such as a (8.35 → 9.09 ppm) and d (8.89 → 9.87 ppm) are highly indicative of pyridyl-Pd coordination.18a,c The DOSY NMR of this sample is shown in the bottom of Fig. 2a, and reveals that the diffusion constant (D) of the major species is substantially smaller than that of ligand 9 alone (log(D) = −9.42 vs. −9.21 for 9). Applying the Stokes–Einstein equation§ to the measured log(D) of −9.42 predicts a radius of about 13.9 Å. This radius is in line with an estimated mean radius of 17.5 Å of a model 3′, assuming the complex has an overall oblate spheroid shape (see Fig. S65†). Moreover, as is depicted in Fig. 2b, the isotope distribution and highest intensity isotopic mass of the major species measured in the final solution is in agreement with a 2![[thin space (1/6-em)]](https://www.rsc.org/images/entities/char_2009.gif) :
:![[thin space (1/6-em)]](https://www.rsc.org/images/entities/char_2009.gif) 4 Pd
4 Pd![[thin space (1/6-em)]](https://www.rsc.org/images/entities/char_2009.gif) :
:![[thin space (1/6-em)]](https://www.rsc.org/images/entities/char_2009.gif) 9 ratio expected for [Pd294]4+ (m/z = 694.8864, highlighted in yellow).
9 ratio expected for [Pd294]4+ (m/z = 694.8864, highlighted in yellow).
The binding of cage 3′ for n-oct-β-D-Glc (10) and n-oct-β-D-Gal (11) was investigated by 1H-NMR titration experiments in CD2Cl2/DMSO-d6 (9![[thin space (1/6-em)]](https://www.rsc.org/images/entities/char_2009.gif) :
:![[thin space (1/6-em)]](https://www.rsc.org/images/entities/char_2009.gif) 1). Selected spectra of such a titration with 10 are shown in the left-hand side of Fig. 3 (see Fig. S51 and S59† for complete spectra of titrations with 10 and 11). With increasing concentration of glucoside 10, all resonances of 3′ in the aromatic region (∼7–11 ppm) broadened and shifted. The resonances for the inwards oriented H-atoms labelled d (9.9), e (10.7) and f (9.0) broaden to an extend that they could barely be detected at 115 mM concentration of 10. In contrast, the signals of H-atoms a (9.1) and g (8.6) remain much sharper throughout the titration and these data can be fitted to a 1
1). Selected spectra of such a titration with 10 are shown in the left-hand side of Fig. 3 (see Fig. S51 and S59† for complete spectra of titrations with 10 and 11). With increasing concentration of glucoside 10, all resonances of 3′ in the aromatic region (∼7–11 ppm) broadened and shifted. The resonances for the inwards oriented H-atoms labelled d (9.9), e (10.7) and f (9.0) broaden to an extend that they could barely be detected at 115 mM concentration of 10. In contrast, the signals of H-atoms a (9.1) and g (8.6) remain much sharper throughout the titration and these data can be fitted to a 1![[thin space (1/6-em)]](https://www.rsc.org/images/entities/char_2009.gif) :
:![[thin space (1/6-em)]](https://www.rsc.org/images/entities/char_2009.gif) 1 model of 3′
1 model of 3′![[thin space (1/6-em)]](https://www.rsc.org/images/entities/char_2009.gif) :
:![[thin space (1/6-em)]](https://www.rsc.org/images/entities/char_2009.gif) 10. As is shown in the right-hand side of Fig. 3, both fits are consistent with an association constant (Ka) of 51.1 ± 1.8 M−1.
10. As is shown in the right-hand side of Fig. 3, both fits are consistent with an association constant (Ka) of 51.1 ± 1.8 M−1.
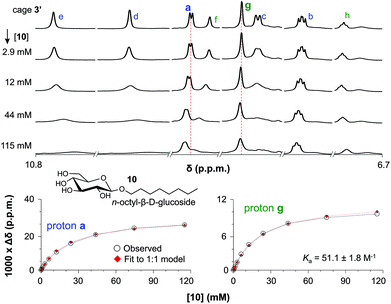 | ||
Fig. 3 (a) Titration with OctGlc. (b) Plot experimental vs. calculated data for 1![[thin space (1/6-em)]](https://www.rsc.org/images/entities/char_2009.gif) : :![[thin space (1/6-em)]](https://www.rsc.org/images/entities/char_2009.gif) 1 binding for proton a. (c) Plot experimental vs. calculated data for 1 1 binding for proton a. (c) Plot experimental vs. calculated data for 1![[thin space (1/6-em)]](https://www.rsc.org/images/entities/char_2009.gif) : :![[thin space (1/6-em)]](https://www.rsc.org/images/entities/char_2009.gif) 1 binding for proton g. 1 binding for proton g. | ||
A similar titration with n-oct-β-D-Gal (11) gave comparable observations, leading to a Ka of 29.1 ± 4.8 M−1 (Fig. S59 and S61†). This lower binding affinity of 3′ for 11 can be rationalized by the axial hydroxyl group in the galactoside, presumably leading to a worse fit of 11 inside 3′.
To probe if, as these data suggest, a simple 1![[thin space (1/6-em)]](https://www.rsc.org/images/entities/char_2009.gif) :
:![[thin space (1/6-em)]](https://www.rsc.org/images/entities/char_2009.gif) 1 [3′⊂10]4+ complex had formed, this sample was investigated further. The DOSY-NMR spectrum of the sample (see Fig. S56†) gave a similar diffusion constant as pure cage 3′ (Fig. 2a), indicating that the cage is still intact. Moreover, as can be seen in Fig. 4a, a cold spray ionisation high resolution mass spectroscopic analysis (CRS-HRMS) revealed a species with a mass and isotope distribution consistent with the anticipated 1
1 [3′⊂10]4+ complex had formed, this sample was investigated further. The DOSY-NMR spectrum of the sample (see Fig. S56†) gave a similar diffusion constant as pure cage 3′ (Fig. 2a), indicating that the cage is still intact. Moreover, as can be seen in Fig. 4a, a cold spray ionisation high resolution mass spectroscopic analysis (CRS-HRMS) revealed a species with a mass and isotope distribution consistent with the anticipated 1![[thin space (1/6-em)]](https://www.rsc.org/images/entities/char_2009.gif) :
:![[thin space (1/6-em)]](https://www.rsc.org/images/entities/char_2009.gif) 1 molar ratio of [3′⊂10]4+ (m/z = 767.9344). Shown in Fig. 4b is the full 1H-NMR spectrum of the sample (top), together with several of 1D nuclear Overhauser effect (nOe) spectra. As can be seen in this figure, irradiation of the outwards pointing CH b did not result in an nOe signal in the carbohydrate region (grey background), while irradiation of the inwards pointing CH d clearly did. Irradiation of the amidic NH e gave a much smaller nOe with 10, presumably because H's e are further away from the CH protons of 10. Interestingly, the {1H–19F}-HOESY spectrum of pure 3′(BF4−)4 shows clear nOes between BF4− and the inwards pointing e, d and f (see Fig. S66a†). These {1H–19F}-HOESY signals could not be observed in the solution after addition of 10 (see Fig. S66b†).
1 molar ratio of [3′⊂10]4+ (m/z = 767.9344). Shown in Fig. 4b is the full 1H-NMR spectrum of the sample (top), together with several of 1D nuclear Overhauser effect (nOe) spectra. As can be seen in this figure, irradiation of the outwards pointing CH b did not result in an nOe signal in the carbohydrate region (grey background), while irradiation of the inwards pointing CH d clearly did. Irradiation of the amidic NH e gave a much smaller nOe with 10, presumably because H's e are further away from the CH protons of 10. Interestingly, the {1H–19F}-HOESY spectrum of pure 3′(BF4−)4 shows clear nOes between BF4− and the inwards pointing e, d and f (see Fig. S66a†). These {1H–19F}-HOESY signals could not be observed in the solution after addition of 10 (see Fig. S66b†).
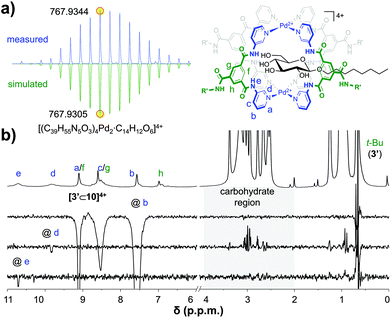 | ||
| Fig. 4 CSI HRMS isotope distribution of [3′⊂10]4+with indicated monoisotopic mass (measured, top and simulated, bottom) (a) and 1D selective nOes of [3′⊂10]4+ with tm = 500 ms (b). See Fig. S60† for full mass spectrum, Fig. S58† for more nOe spectra, and see Fig. S59† for a plot with linear fit of peak intensity vs. tm in the region 50–700 ms. | ||
All the above data indicate the formation of a 1![[thin space (1/6-em)]](https://www.rsc.org/images/entities/char_2009.gif) :
:![[thin space (1/6-em)]](https://www.rsc.org/images/entities/char_2009.gif) 1 [3′⊂10]4+ complex where glucoside 10 resides within the cavity of 3′ after replacing the BF4− counter anions. The binding motif of [3′⊂10]4+ was modelled starting from a crystal structures of 3
1 [3′⊂10]4+ complex where glucoside 10 resides within the cavity of 3′ after replacing the BF4− counter anions. The binding motif of [3′⊂10]4+ was modelled starting from a crystal structures of 3![[thin space (1/6-em)]](https://www.rsc.org/images/entities/char_2009.gif) 18a,b and our nOe data that show that the CH protons of 10 are closest to the inwards pointing pyridyl protons d.¶
18a,b and our nOe data that show that the CH protons of 10 are closest to the inwards pointing pyridyl protons d.¶
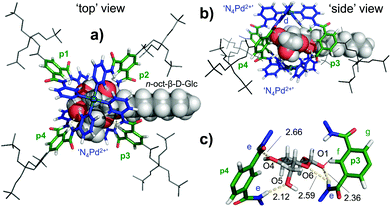 | ||
| Fig. 5 Molecular model of [3′⊂10]4+obtained by a combined conformational search (MMFF) and DFT geometry optimization of the core structure with (ωB97X-D/6-31G*) as seen from the ‘top’ (a) or the ‘side’ (b) of the complex (see note || in text). In (c) a zoom-in of the hydrogen bonding pattern is presented. The average of the eight shortest d-CH⋯HC(10) distances is 2.59 Å, while this is 3.65 Å for the eight shortest e-NH⋯HC(10) distances. See Table S3† for atomic coordinates. | ||
As can be seen in the ‘top’ and ‘side’ views of the model depicted in Fig. 5, 10 is positioned between the two N4Pd2+ centres (blue) and is surrounded by the four polar spacer groups of 3′ (p1–p4, green). From these views, it is also clear that the CH protons of 10 are closest to the pyridyl protons d, which is consistent with the strongest nOes observed with d (Fig. 4b).
Indeed, the average of the eight shortest d-CH⋯HC(10) distances is 2.59 Å, while this is 3.65 Å for the eight shortest e-NH⋯HC(10) distances (only very weak nOe observes, see Fig. 4b). As can be seen from Fig. 5c, glucoside 10 establishes a total of four hydrogen bonds in this model, but only involving two out of four polar spacers; p3 (e⋯O1 and e⋯O6) and p4 (e⋯O4 and e⋯O5). The model thus suggests that the cavity in 3′ is somewhat too large to fully encapsulate a glucoside such as 10 by hydrogen bonding. This in turn might rationalize the moderate binding affinity of 3′ for glucoside 10 (Ka ≈ 51 M−1). There are also several weaker interactions between the inwards pointing pyridyl hydrogens d, and some hydroxyl O-atom which likely further stabilize the complex (shortest is 2.46 Å with O4). Such interactions have been observed as the major binding interaction in similar M2L4 complexes that do not have the much more acidic amide NH protons present in 3′.19
In conclusion, a new building block (9) is reported that forms a self-assembled molecular cage (3′) in the presence of Pd2+. The cage has the proper size and functional groups to bind n-oct-β-D-Glc (10) with a Ka of 51 M−1 or n-oct-β-D-Gal (11) with 29 M−1. We consider these relatively low affinities as a promising first step in establishing the principle that M2L4-like cages with a H-bonding interior such as 3′ can bind carbohydrates in very competitive media. As such, one can actually consider these affinities as significant in the CD2Cl2/DMSO-d6 (9![[thin space (1/6-em)]](https://www.rsc.org/images/entities/char_2009.gif) :
:![[thin space (1/6-em)]](https://www.rsc.org/images/entities/char_2009.gif) 1) solvent used. It is known that DMSO is one of the most competitive solvents for carbohydrate recognition9 and the first reported covalently-assembled cage for carbohydrate binding in a competitive medium (a biphenyl analogue of 1) has an affinity (Ka) of merely 4.6 M−1 for D-glucose in water.20 The ease with which carbohydrate binders such as 3′ can be prepared bodes well for their further development. We thus anticipate that future studies will unveil structures with improved affinities and selectivity.
1) solvent used. It is known that DMSO is one of the most competitive solvents for carbohydrate recognition9 and the first reported covalently-assembled cage for carbohydrate binding in a competitive medium (a biphenyl analogue of 1) has an affinity (Ka) of merely 4.6 M−1 for D-glucose in water.20 The ease with which carbohydrate binders such as 3′ can be prepared bodes well for their further development. We thus anticipate that future studies will unveil structures with improved affinities and selectivity.
Conflicts of interest
There are no conflicts to declare.Acknowledgements
This research was financially supported by the Netherlands Organisation for Scientific Research (NWO) with VIDI grant number 723.015.006.Notes and references
- D. Voet and J. G. Voet, Biochemistry, John Wiley and Sons, New York, 4th edn, 2011 Search PubMed.
- (a) H. J. Gabius, H. C. Siebert, S. Andre, J. Jimenez-Barbero and H. Rudiger, Chem. Biochem., 2004, 5, 740–764 CrossRef CAS PubMed; (b) C. A. Aarnoudse, J. J. G. Vallejo, E. Saeland and Y. van Kooyk, Curr. Opin. Immunol, 2006, 18, 105–111 CrossRef CAS PubMed; (c) C. R. Bertozzi and L. L. Kiessling, Science, 2001, 291, 2357–2364 CrossRef CAS PubMed; (d) B. Wang and G. J. Boons, Carbohydrate Recognition: Biological Problems, Methods, and Applications, John Wiley & Sons Ltd., New Jersey, 2011 CrossRef; (e) H. J. Gabius, The Sugar Code: Fundamentals of Glycosciences, Wiley-VCH, Weinheim, 2009 Search PubMed; (f) K. S. Lau and J. W. Dennis, Glycobiology, 2008, 18, 750–760 CrossRef CAS PubMed; (g) D. Solis, N. V. Bovin, A. P. Davis, J. Jimenez-Barbero, A. Romero, R. Roy, K. Smetana and H. J. Gabius, Biochim. Biophys. Acta, Gen. Subj., 2015, 1850, 186–235 CrossRef CAS.
- (a) D. J. Miller, M. B. Macek and B. D. Shur, Nature, 1992, 357, 589–593 CrossRef CAS PubMed; (b) W. J. Snell and J. M. White, Cell, 1996, 85, 629–637 CrossRef CAS.
- H. E. Murrey and L. C. Hsieh-Wilson, Chem. Rev., 2008, 108, 1708–1731 CrossRef CAS PubMed.
- G. Caltabiano, M. Campillo, A. De Leener, G. Smits, G. Vassart, S. Costagliola and L. Pardo, Cell. Mol. Life Sci., 2008, 65, 2484–2492 CrossRef CAS PubMed.
- E. I. Buzas, B. Gyorgy, M. Pasztoi, I. Jelinek, A. Falus and H.-J. Gabius, Autoimmunity, 2006, 39, 691–704 CrossRef CAS PubMed.
- D. A. Calarese, C. N. Scanlan, M. B. Zwick, S. Deechongkit, Y. Mimura, R. Kunert, P. Zhu, M. R. Wormald, R. L. Stanfield, K. H. Roux, J. W. Kelly, P. M. Rudd, R. A. Dwek, H. Katinger, D. R. Burton and I. A. Wilson, Science, 2003, 300, 2065–2071 CrossRef CAS PubMed.
- (a) R. D. Astronomo and D. R. Burton, Nat. Rev. Drug Discovery, 2010, 9, 308–324 CrossRef CAS PubMed; (b) S. Jin, Y. Cheng, S. Reid, M. Li and B. Wang, Med. Res. Rev., 2010, 30, 171–257 CAS; (c) J. Balzarini, Nat. Rev. Microbiol., 2007, 5, 583–597 CrossRef CAS PubMed; (d) Y. Nakagawa, T. Doi, T. Taketani, K. Takegoshi, Y. Igarashi and Y. Ito, Chem. – Eur. J., 2013, 19, 10516–10525 CrossRef CAS; (e) B. Ernst and J. L. Magnani, Nat. Rev. Drug Discovery, 2009, 8, 661–677 CrossRef CAS PubMed; (f) T. J. Boltje, T. Buskas and G.-J. Boons, Nat. Chem., 2009, 1, 611–622 CrossRef CAS PubMed; (g) P. H. Seeberger and D. B. Werz, Nat. Rev. Drug Discovery, 2005, 4, 751–763 CrossRef CAS.
- E. J. Toone, Curr. Opin. Struct. Biol., 1994, 4, 719–728 CrossRef CAS.
- (a) N. K. Vyas, M. N. Vyas and F. A. Quiocho, Science, 1988, 242, 1290–1295 CrossRef CAS PubMed; (b) F. A. Quiocho, Pure Appl. Chem., 1989, 61, 1293–1306 CAS.
- A. R. Kolatkar and W. I. Weis, J. Biol. Chem., 1996, 271, 6679–6685 CrossRef CAS PubMed.
- K. L. Hudson, G. J. Bartlett, R. C. Diehl, J. Agirre, T. Gallagher, L. L. Kiessling and D. N. Woolfson, J. Am. Chem. Soc., 2015, 137, 15152–15160 CrossRef CAS PubMed.
- (a) P. Rios, T. S. Carter, T. J. Mooibroek, M. P. Crump, M. Lisbjerg, M. Pittelkow, N. T. Supekar, G.-J. Boons and A. P. Davis, Angew. Chem., Int. Ed., 2016, 55, 3387–3392 CrossRef CAS PubMed; (b) P. Stewart, C. M. Renney, T. J. Mooibroek, S. Ferheen and A. P. Davis, Chem. Commun., 2018, 54, 8649–8652 RSC; (c) R. A. Tromans, T. S. Carter, L. Chabanne, M. P. Crump, H. Y. Li, J. V. Matlock, M. G. Orchard and A. P. Davis, Nat. Chem., 2019, 11, 52–56 CrossRef CAS PubMed; (d) N. Chandramouli, Y. Ferrand, G. Lautrette, B. Kauffmann, C. D. Mackereth, M. Laguerre, D. Dubreuil and I. Huc, Nat. Chem., 2015, 7, 334–341 CrossRef CAS PubMed; (e) P. Mateus, B. Wicher, Y. Ferrand and I. Huc, Chem. Commun., 2018, 54, 5078–5081 RSC; (f) O. Francesconi, F. Cicero, C. Nativi and S. Roelens, ChemPhysChem, 2020, 21, 257–262 CrossRef CAS PubMed; (g) O. Francesconi, M. Martinucci, L. Badii, C. Nativi and S. Roelens, Chem. – Eur. J., 2018, 24, 6828–6836 CrossRef CAS PubMed.
- (a) A. P. Davis and R. S. Wareham, Angew. Chem., Int. Ed., 1998, 37, 2270–2273 CrossRef; (b) T. J. Mooibroek, J. M. Casas-Solvas, R. L. Harniman, C. M. Renney, T. S. Carter, M. P. Crump and A. P. Davis, Nat. Chem., 2015, 8, 69–74 CrossRef PubMed; (c) C. Ke, H. Destecroix, M. P. Crump and A. P. Davis, Nat. Chem., 2012, 4, 718–723 CrossRef CAS PubMed.
- (a) D. A. McMorran and P. J. Steel, Angew. Chem., Int. Ed., 1998, 37, 3295–3297 CrossRef CAS; (b) M. Han, D. M. Engelhard and G. H. Clever, Chem. Soc. Rev., 2014, 43, 1848–1860 RSC.
- (a) S. Freye, J. Hey, A. Torras-Galan, D. Stalke, R. Herbst-Irmer, M. John and G. H. Clever, Angew. Chem., Int. Ed., 2012, 51, 2191–2194 CrossRef CAS; (b) A. V. Zhukhovitskiy, M. Z. Zhong, E. G. Keeler, V. K. Michaelis, J. E. P. Sun, M. J. A. Hore, D. J. Pochan, R. G. Griffin, A. P. Willard and J. A. Johnson, Nat. Chem., 2016, 8, 33–41 CrossRef CAS.
- M. Yamashina, M. Akita, T. Hasegawa, S. Hayashi and M. Yoshizawa, Sci. Adv., 2017, 3, 6 Search PubMed.
- (a) N. L. S. Yue, D. J. Eisler, M. C. Jennings and R. J. Puddephatt, Inorg. Chem., 2004, 43, 7671–7681 CrossRef CAS PubMed; (b) N. Yue, Z. Q. Qin, M. C. Jennings, D. J. Eisler and R. J. Puddephatt, Inorg. Chem. Commun., 2003, 6, 1269–1271 CrossRef CAS; (c) N. L. S. Yue, M. C. Jennings and R. J. Puddephatt, Inorg. Chim. Acta, 2016, 445, 37–45 CrossRef CAS.
- (a) T. A. Young, V. Marti-Centelles, J. Z. Wang, P. J. Lusby and F. Duarte, J. Am. Chem. Soc., 2020, 142, 1300–1310 CrossRef; (b) D. Preston, K. F. White, J. E. M. Lewis, R. A. S. Vasdev, B. F. Abrahams and J. D. Crowley, Chem. – Eur. J., 2017, 23, 10559–10567 CrossRef CAS; (c) D. P. August, G. S. Nichol and P. J. Lusby, Angew. Chem., Int. Ed., 2016, 55, 15022–15026 CrossRef CAS PubMed; (d) L. S. Lisboa, J. A. Findlay, L. J. Wright, C. G. Hartinger and J. D. Crowley, Angew. Chem., Int. Ed., 2020, 59, 2–9 CrossRef.
- E. Klein, M. P. Crump and A. P. Davis, Angew. Chem., Int. Ed., 2005, 44, 298–302 CrossRef CAS PubMed.
Footnotes |
| † Electronic supplementary information (ESI) available: Synthetic procedures, details of NMR and mass measurements, spectra and binding analysis curves. See DOI: 10.1039/d0ob01081b |
| ‡ Complex formation in DMSO-d6 also led to a major species, although many other smaller peaks were also clearly visible (Fig. S27†). These peaks reversibly disappeared when the sample was heated to 80 °C (see Fig. S29† for a VT study), indicating that the additional peaks originate from conformational flexibility in 3′. |
| § Stokes –Einstein equation: wherein D is the molar diffusion coefficient (assuming a spherical size of the molecule), k is the Boltzman constant, T is the temperature in Kelvin, μ the viscosity of the liquid and rs the hydrodynamic radius of the molecule. See section S1 of ESI for further details |
| ¶ An initial model of [3′⊂10]4+ was subjected to a conformational search with the Merck Molecular Force Field MMFF (including the dendrimers), leading to one major binding conformer. The binding pocket of this structure was optimized with DFT/ωB97X-D/6-31G* leading to the core structure depicted in Fig. 5 (i.e., as depicted in Fig. 2 with R′ = CH3). All the atoms in this structure were frozen, the dendrimers were drawn again and the geometry of the resulting [3′⊂10]4+ structure was allowed optimize with MMFF to yield the final model used (while keeping the DFT optimized core-structure frozen). Calculations were done with Spartan 2016. |
| || An initial model of [3′⊂10]4+ was subjected to a conformational search with the Merck Molecular Force Field MMFF (including the dendrimers), leading to one major binding conformer. The binding pocket of this structure was optimized with DFT/ωB97X-D/6-31G* leading to the core structure depicted in Fig. 5 (i.e., as depicted in Fig. 2 with R′ = CH3). All the atoms in this structure were frozen, the dendrimers were drawn again and the geometry of the resulting [3′⊂10]4+ structure was allowed optimize with MMFF to yield the final model used (while keeping the DFT optimized core-structure frozen). Calculations were done with Spartan 2016. |
| This journal is © The Royal Society of Chemistry 2020 |

