Highly effective and fast removal of anionic carcinogenic dyes via an In3-cluster-based cationic metal–organic framework with nitrogen-rich ligand†
Xinyao
Liu
 a,
Bing
Liu
a,
Jarrod F.
Eubank
a,
Bing
Liu
a,
Jarrod F.
Eubank
 *b and
Yunling
Liu
 *a
*a
aState Key Laboratory of Inorganic Synthesis and Preparative Chemistry, College of Chemistry, Jilin University, Changchun 130012, P. R. China. E-mail: yunling@jlu.edu.cn; Fax: +86-431-85168624; Tel: +86-431-85168614
bDepartment of Chemistry, Biochemistry, & Physics, Florida Southern College, 111 Lake Hollingsworth Dr, Lakeland, FL 33801, USA. E-mail: jfeubank@mail.usf.edu; Tel: +1-863-680-4199
First published on 13th November 2019
Abstract
In this work, highly effective and rapid removal of anionic carcinogenic organic dye molecules is achieved through the use of a novel cationic metal–organic framework (MOF). The MOF is constructed using a nitrogen-rich triangular organic ligand, 4,4′,4′′-s-triazine-1,3,5-triyltri-p-aminobenzoate (H3TATAB), and trinuclear 6-connected In3-cluster secondary building units (SBUs), [In3O(TATAB)2(H2O)3](NO3)·(DMA)15 (In-TATAB), which gives a structure exhibiting a new topology. As the formula indicates, In-TATAB is inherently cationic due to the [In3O(COO−)6]+ units, which thus favors interaction with anionic guests. Several organic dye molecules of varying charge and size, such as acid chrome blue K, acid red 26, congo red, direct black 38 and, orange II, were used to test the sequestration potential of the MOF material. In addition to electrostatic attraction, it is shown that hydrogen-bonding originating from the highly functional bridging ligand and terminal H2O ligands enhance the interactions between the framework and guest dye molecules, suggesting its potential use for the removal of anionic organic pollutants.
Introduction
Organic dye molecules are widely used in industrial manufacturing, including printing, textiles, cosmetics, and plastics. With the rapid development and historically lax environmental oversight, the discharge of dyes has critically affected various ecosystems globally. It has been estimated that hundreds of thousands of tons of textile dyes are discharged each year.1 Aside from water contamination, many dye molecules are toxic and harmful to humans and animals.2 Some organic dyes are even carcinogenic. At least nine dyes, including acid red 26, basic red 9, basic violet 14, direct black 38, direct blue 6, direct red 28 (congo red), disperse blue 1, disperse orange 11 and disperse yellow 3, are classified as carcinogenic in the European textile ecology standard (OEKO-TEX, 2013).3 Thus, abuse and over-discharge of toxic dyes could be an extreme threat to public health if left unchecked. As such, numerous adsorption processes are widely explored to remove organic contaminants. However, traditional absorbents, such as active carbon, have shown weak adsorptive capacities toward many dye molecules.4 Therefore, the development of highly efficient adsorbents for the removal of toxic dyes is urgent and necessary.In addition to carbon, there are a variety of other porous materials that might serve as excellent candidates for dye removal. One class of porous inorganic–organic hybrid crystalline materials, metal–organic frameworks (MOFs), already known for outstanding performance in gas storage,5 separation,6 catalysis,7 sensing,8 therapy,9 optical properties,10 and energy science,11 is of particular interest. Specifically, their characteristic high porosity and surface area can enhance the adsorptive capabilities toward dyes with large molecular size and high molecular mass.12 Since MOFs consist of multiple functional/functionalizable components (i.e., individual metals or metal clusters and functional ligands), they can provide a high degree of interaction between guest molecules and adsorbent. Thus, MOFs portend promise as a platform for the removal of toxic organic dye molecules.
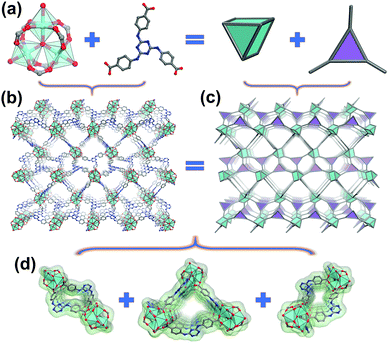
In addition to possessing a wide variety of functional groups, a large proportion of organic dyes are charged. In order to adsorb dyes with specific charges, frameworks with opposite charges will be excellent candidates.13 The fabrication of MOFs with charged frameworks requires the generation of excess charge from the misbalance between inorganic and organic components. Metal ions are naturally positively charged, but some traditional clusters (e.g., tetrameric [Zn4O(COO−)6] and dimeric [Cu2(COO−)4(X)2] cluster (X = neutral terminal ligand)) are inherently neutral and form neutral frameworks.14 In comparison, trigonal planar trimers such as [M3O(COO−)6(X)3] with M3+ are positive, [M3O(COO−)6(X)3]+ and offer potential to construct a positive framework.15 Thus, MOFs from [M3O(COO−)6(X)3]+ should be favorable for the adsorption of anionic dye molecules. This cationic cluster can be simplified as a 6-connected, trigonal prismatic node (Fig. 1) using the molecular building block (MBB) strategy and is known for several metal ions, including iron and indium, which readily form in simple and mild solvothermal conditions.16 MOFs built with the In3-cluster and an array of organic ligands have been synthesized and possess outstanding performances in gas storage,17 catalysis,18 proton conduction,19 ion exchange,20 and sensing.21
Aside from the metal clusters in MOFs, the organic ligands can also enhance adsorptive performance for organic guests. Most organic dyes consist of functional groups like –OH, –NH2, –COOH and –SO3H, which are all known to provide hydrogen-bond sites. If the organic ligand contains functional groups which can provide higher hydrogen bond potential, the interaction between dye and framework will be increased and promote the adsorptive capacities.22
Based on these premises, this work demonstrates the design of two cationic MOFs [In3O(TATAB)2(H2O)3](NO3)·(DMA)15 (In-TATAB) and [Fe3O(TATAB)2(H2O)3](NO3)·(guest)x (Fe-TATAB) from the [M3O(COO−)6(X)3]+ cluster and a highly functional, nitrogen-rich ligand, 4,4′,4′′-s-triazine-1,3,5-triyltri-p-aminobenzoate (H3TATAB). The crystalline materials were synthesized by the solvothermal reaction of H3TATAB with In(NO3)·4H2O and Fe(NO3)3·9H2O, respectively. In-TATAB consisted of cationic [In3O(COO−)6]+ SBUs and possessed high porosity. As expected, it also exhibited highly effective adsorption towards anionic carcinogenic dyes such as acid chrome blue K (ACBK), direct red 28 (congo red, CR), acid red 26 (AR-26), direct black 38 (DB-38) and orange II (OII). In-TATAB exhibited high adsorptive rates and capacities due to the strong charge interaction between the cationic framework and anionic dyes. In addition to electrostatic interactions, hydrogen bonds originating from the nitrogen-rich ligands and terminal H2O molecules in the In3-cluster also enhance the interaction in the adsorption processes.
Experimental
Materials and methods
The H3TATAB ligand and other chemicals were purchased from commercial sources and used without any further purification. Powder X-ray diffraction (PXRD) data were collected on a Rigaku D/max-2550 diffractometer with Cu Ka radiation (λ = 1.5418 Å). The elemental analyses were performed on a vario MICRO elementary analyzer. Thermogravimetric analyses (TGA) were performed on a TGA Q500 thermogravimetric analyzer in the temperature range of 30–800 °C under an air flow with a heating rate of 10 °C min−1. The liquid-state UV-vis spectra were recorded on a PerkinElmer Lambda 265 PDA UV-Vis spectrophotometer.Synthesis of In-TATAB
In(NO3)3·4H2O (20 mg, 0.054 mmol), H3TATAB (10 mg, 0.021 mmol) and N,N-dimethylacetamide (DMA) (2 mL) were placed into a sealed 20 mL glass vial, and the mixture was heated at 100 °C for 24 hours. The transparent octahedral crystals were gathered and washed with DMA and dried in air (61% yield based on In(NO3)3·4H2O). Elemental analysis for In-TATAB. Found (wt%): C, 44.85; H, 5.88; N, 13.18. Calcd (wt%): C, 47.16; H, 6.22; N, 14.26. The agreement between experimental and simulated PXRD patterns indicated the phase purity of the products (Fig. S1a, ESI†).Synthesis of Fe-TATAB
Fe(NO3)3·9H2O (20 mg, 0.049 mmol), H3TATAB (10 mg, 0.021 mmol), benzoic acid (BA) (70 mg, 0.574 mmol) and N,N-dimethylformamide (DMF) (2 mL) were placed into a sealed 20 mL glass vial, and the mixture was heated at 120 °C for 72 hours. The red octahedral crystals were gathered and washed with DMF and dried in air (18% yield based on Fe(NO3)3·9H2O). The agreement between experimental and simulated PXRD patterns indicated the phase purity of the products (Fig. S1b, ESI†).X-ray crystallography
Crystallographic data for In-TATAB were collected on a Bruker Apex II CCD diffractometer using graphite-monochromated Mo-Kα (λ = 0.71073 Å) radiation at room temperature. The structures were solved by direct methods and refined by full-matrix least-squares on F2 using SHELEX-97 and SHELEX-2014.23 All the indium atoms were located first, and then the oxygen, carbon and nitrogen atoms of In-TATAB were subsequently found in difference Fourier maps. The hydrogen atoms of the TATAB ligands were generated theoretically onto the specific atoms and refined isotropically with fixed thermal factors. All non-hydrogen atoms were refined anisotropically. The final formula was derived from crystallographic data combined with thermogravimetric analysis data. The detailed crystallographic data for In-TATAB and Fe-TATAB are listed in Tables S1 and S2 (ESI†), respectively.N2 adsorption measurements
The N2 adsorption of In-TATAB was carried out on a Micrometritics ASAP 2420. Samples of In-TATAB were soaked in absolute ethanol to exchange guest molecules, the ethanol was refreshed 3 times daily. Then the sample was treated by supercritical CO2 activation using a Tousimis™ Samdri® PVT-3D critical point dryer (Tousimis, Rockville, MD, USA). The liquid CO2 was used to exchange the ethanol, the system was vented eight times over the course of 12 hours. The system was then bled for 24 hours. Subsequently the samples were transferred into a sorption tube and dried again by using the “outgas” function of the surface area analyzer at 30 °C for 10 hours.Dye adsorption measurements
The dye adsorption of In-TATAB was carried out by the removal of ACBK, CR, AR-26, DB-38 and OII in ethanol at room temperature. Before the dye adsorption, the sample of In-TATAB was soaked in ethanol to exchange guest molecules as in the N2 adsorption measurements process. For the maximum adsorption amount measurements, 10 mg of In-TATAB were put into 10 mL of dye–ethanol solution with different concentrations (50–600 ppm, intervals of 50 ppm) under magnetic stirring for 24 h and In-TATAB was separated by centrifugation. For the adsorption rate measurements, 20 mg of In-TATAB were put into 40 mL of 20 ppm dye–ethanol solution. 2 mL of liquid were withdrawn at regular intervals of 1 minute and In-TATAB was separated by a filter membrane immediately. The concentrations of dye molecules were monitored by UV-Vis spectrophotometer.After the adsorption equilibriums were reached, the maximum adsorption amounts were calculated from the plots according to the Langmuir equation shown below. In which Ce (mg L−1) is equilibrium concentration, Qe (mg L−1) is adsorbed dye amount, QM is maximum adsorption amount (mg L−1), and b is Langmuir constant (L mg−1).
The desorption of dyes was carried out by soaking the dye-absorbed In-TATAB in 10 mL of NaNO3–DMF (1 mmol) solution. After the desorption was completed, In-TATAB were washed with ethanol for three times. Then, the cycle experiments were carried out by soaking the desorbed In-TATAB in 10 mL of dye–ethanol solution again.
Results and discussion
Structural design, description and characterizations
Triangular shaped organic ligands are a kind of popular ligand for the construction of MOFs materials. In order to enhance the dye absorptive capability, a nitrogen-rich ligand, H3TATAB, was selected. To build a cationic framework environment, In3+ was chosen for the expected formation of cationic inorganic [In3O(COO−)6]+ SBUs. The solvothermal reaction between H3TATAB and In(NO3)3·4H2O in DMA yielded transparent octahedral crystals of In-TATAB. In addition, Fe3+ was also used to fabricate the analogous structure, as it is known to form the same cationic cluster; the solvothermal reaction between Fe(NO3)3·9H2O and H3TATAB in DMF (in the presence of benzoic acid as a modulator) yielded the red octahedral crystals of Fe-TATAB. Though Fe-TATAB has the same structure as In-TATAB, the low yield and poor reproducibility hindered the further characterization of Fe-TATAB. Thus, only In-TATAB will be discussed in this case.The single-crystal X-ray diffraction (SCXRD) confirms that In-TATAB crystallizes in the tetragonal space group P41212. Each In3+ ion is coordinated by one μ3-O and four oxygen atoms from distinct carboxyl groups from four independent TATAB3− ligands; the sixth coordination site is occupied by a terminal H2O molecule. Three In3+ are bridged by μ3-O and six carboxyl groups to form [In3(μ3-O)(COO−)6]+, a 6-connected (trigonal prismatic) SBU (Fig. 1a). Each In3-cluster is linked by six TATAB ligands, and each ligand is connected by three isolated In3-SBUs (Fig. S2, ESI†), to form the final 3D framework (Fig. 1b). There are three kinds of channels through both the [100] and [010] directions. These three kinds of channels are adjacent and connected with each other by sharing TATAB ligands as co-walls (Fig. 1c). The big channel is an approximately triangular shape with a side length of 8.9 Å. The middle and small channels are rectangular shaped with sizes of 4.9 Å × 2.8 Å and 6.6 Å × 0.8 Å, respectively (Fig. S3, ESI†). It should be noted that the middle and small channels consist of a pair of racemic chiral helices (Fig. 2). The middle channel can be viewed as a left-handed helix and, correspondingly, the small channel would be viewed as a right-handed helix. These chains act as part of the wall of two channels.
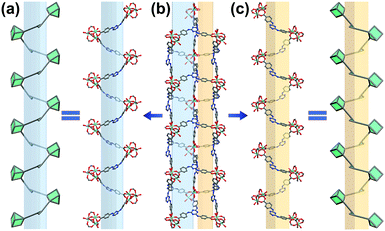 | ||
| Fig. 2 Schematic representation of chiral helices in In-TATAB: (a) right-handed helix, (b) small and middle channels, (c) left-handed helix. Color scheme: In (cyan), C (gray), O (red) and N (blue). | ||
This structure is unique and conflicts with the typical structure for triangular ligands and the M3O-cluster. For example, the assembly of 1,3,5-benzenetricarboxylic acid (BTC) and the M3O-cluster (M = Cr, Fe, Al, V) will form the MIL-100 series with mtn topology.24 The framework of MIL-100 is built from supertetrahedra which consists of four M3O-SBUs and four BTC ligands. The formation of supertetrahedra requires the D3h symmetrical M3O-SBUs and a regular triangular organic ligand. In addition to the BTC ligand, mtn topological MOFs from elongated triangular ligands were reported recently, such as PCN-332, PCN-33325 and MOF-919.26 It might be expected that a similar structure would occur for the TATAB ligand; however, in this case, the three carboxylic groups and triazine are not oriented in the same plane (Fig. S4a, ESI†). As a result, the distances and angles between three carboxylic groups and the center of triazine are different (Fig. S4b and c, ESI†), which lowers the symmetry. Though the trinuclear SBUs are the same, the TATAB ligands exhibit irregular shape. Thus, the final framework of In-TATAB is neither mtn, spn, nor other regular 3,6-connected topologies. In fact, topological analysis reveals that In-TATAB exhibits a new (3,6)-c topology with the point symbol {611·84}{63}2 (Fig. 1c).
As shown in Fig. S5 (ESI†), In-TATAB can maintain the structure in common organic solvents. However, the irregularity of the TATAB ligand causes a slight warping, which results in not only slight fragility of the frameworks upon the removal of guest molecules, but also instability in water (Fig. S6, ESI†). Nonetheless, TGA data (Fig. S7, ESI†) reveals that In-TATAB is thermally stable up to 300 °C. In addition, the N2 isotherm of In-TATAB was tested after careful supercritical CO2 treatment, and the BET surface area was calculated to be 623 m2 g−1 (Fig. S8, ESI†).
Dye adsorption and separation
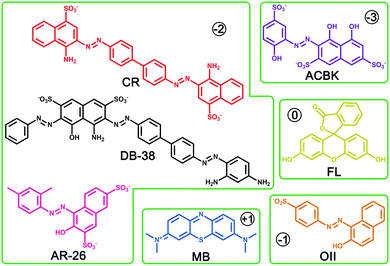
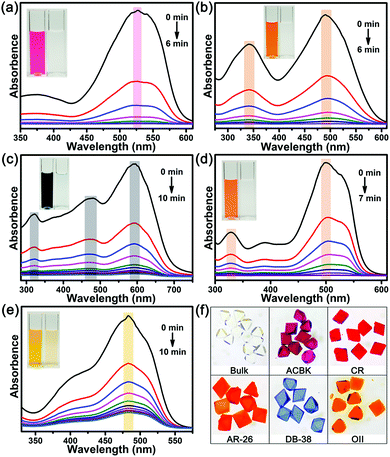
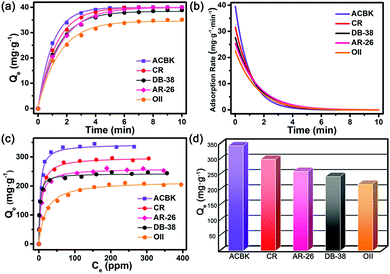
Beyond N2 and solvent uptake, In-TATAB was investigated for the adsorptive capability of, different kinds of dye molecules with various charges, as well as sizes and shapes (Fig. 3). Specifically, acid chrome blue K (ACBK) exhibits −3 charge. Acid red 26 (AR-26), congo red (CR) and direct black 38 (DB-38) exhibit −2 charge. Orange II (OII) exhibits −1 charge. Fluorescein (FL) and methylene blue (MB) exhibit 0 and +1 charge, respectively. In addition, AC-26, CR, and DB-38 are explicit carcinogenic confirmed by European Textile Ecological Standards.The results reveal that In-TATAB can adsorb dyes with negative charge effectively and fast, including ACBK, AR-26, CR, DB-38, and OII. The adsorption processes can be observed by the color changes of the solutions (Fig. 4 inset) and crystals (Fig. 4f). The UV-Vis spectra shown in Fig. 4 indicated that the dye molecules can be effectively adsorbed in less than 10 min. It only takes 6 min for full removal of ACBK and CR from the solution. The adsorption rates can be calculated by the first-order derivative of the plot of Qeversus time (Fig. 5a and b). The initial adsorption rate of ACBK, CR, DB-38, AR-26, and OII are 39.5, 31.6, 27.7, 25.4 and 22.7 mg g−1 min−1, respectively.
The adsorption capacity of dyes is related to the concentration of the solutions. Thus, the maximum adsorption capacities were found by testing the Qe of different initial concentrations of dye solutions. The data fit the Langmuir curve well, which indicated the adsorption processes can be described using the Langmuir isotherm model (Fig. 5c). The maximum adsorption capacity of ACBK, CR, AR-26, DB-38, and OII were calculated to be 343, 299, 259, 242 and 217 mg g−1, respectively (Fig. 5d). These results indicated that In-TATAB exhibits much higher adsorption rates and better adsorption capacities of these pollutants than previously reported works.27 In addition, the PXRD patterns of dye-adsorbed In-TATAB prove that the structure of the frameworks is well maintained (Fig. S9, ESI†).
Based on the experimental results, a plausible mechanism of dye adsorption is proposed. First, the adsorption processes of In-TATAB are dominated by charge interaction. The frameworks are built by In3-cluster SBUs which exhibit +1 charges, there are nitrate ions in the frameworks to balance the charge. Since the NO3− are free in the channels, they can be easily exchanged by other anions. Thus, organic dye molecules with negative charge can be adsorbed by the frameworks through ion exchange of NO3−. For ACBK3−, AR-262− and OII1−, they have similar molecular shape and size, but different negative charges. The maximum adsorption capacities and adsorption rate of these three dyes follow the order of ACBK > AR-26 > OII, which is the same as the order of negative charges on the dyes. It proves that molecules with higher charges have stronger charge interaction with the framework of In-TATAB, thus can be absorbed more effectively. Second, hydrogen bond forces also influence the adsorption process. For every In3-cluster, three terminal water molecules are attached. For every TATAB ligand, there are three nitrogen atoms in the triazine ring plus three secondary amines. These molecules can act as functional groups that provide hydrogen bond sites for the interaction between dye molecules and frameworks. The dyes used contain characteristic groups like sulfonic groups (–SO3−), amino groups (–NH2) and hydroxy groups (–OH), which are all known to readily form hydrogen bonds, here with the functional groups of the framework.
For AR-262− and CR2−, both exhibit −2 charges, but CR has more functional groups than AR-26. Though the molecular size of CR is nearly twice of AR-26, the adsorption rate and maximum capacity of CR are higher than AR-26. It reveals that when the charge forces are similar, more hydrogen bonds will enhance the adsorptive ability. As for infrared spectroscopy, the vibration peak of –OH and –NH2 groups in the raw dye molecules settle at 3460 and 3250 cm−1, respectively, and the characteristic absorption peak of –SO3− settle at 1068 cm−1. As shown in Fig. S10 (ESI†), the peak of –SO3− only appeared in dye-adsorbed patterns and shifted to 1100 cm−1. Moreover, the broad peak from 3000–3750 cm−1 assigned to the vibration of O–H and N–H, which were differed from both In-TATAB and raw dye molecules. These phenomena indicated that dyes were adsorbed into In-TATAB and performed hydrogen-bond interaction with frameworks.28
Third, π–π interactions take place between dyes and frameworks. The dye molecules and organic ligand both consist of aromatic rings, and the π–π interaction will benefit the adsorption capabilities. Even though the mentioned interaction can enhance the adsorption, the pore size still primarily determines the adsorptive ability. This can be demonstrated with a comparison between DB-38 and CR. Though DB-38 has more functional groups than CR (to provide hydrogen bond interactions), DB-38 still exhibits less adsorption capacity and a lower rate than CR. The molecular size of DB-38 is much larger than CR. That means when the molecular size is too large, more interaction forces will not necessarily enhance the adsorptive ability.
Since the charge force dominated the adsorptive processes, charge-dependent selective adsorptions were investigated. FL with 0 charges and MB with +1 charge were used. As shown in Fig. 6, In-TATAB selectively adsorbs the anionic dye molecule, ACBK, instead of neutral FL or cationic MB. Even if the concentration of neutral or cationic dyes is much higher than the anionic dye, there was only minor adsorption of the neutral or cationic dyes. These phenomena also prove that charge interaction between dye molecules and frameworks dominate the adsorption processes. Moreover, the adsorbed dye molecules can be released by the addition of excess NO3− anions. By soaking the dye-adsorbed In-TATAB into the NaNO3-DMF solution, the dye molecules can be almost completely exchanged by NO3− (Fig. S11a, ESI†). Then, In-TATAB can be reused for dye adsorption again. There was a minor reduction in the removal efficiency after three cycle-tests (Fig. S11b, ESI†).
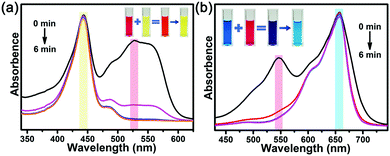 | ||
| Fig. 6 Liquid-state UV-Vis spectra of selective adsorption of (a) ACBK & FL, (b) ACBK & MB (inset: images of solutions). | ||
Conclusions
Two cationic MOFs, In-TATAB and Fe-TATAB, constructed from a nitrogen-rich organic ligand, were designed and synthesized through the MBB method. Both exhibited a new, irregular (3,6)-c topology due to distortion of the would-be triangular organic ligand, TATAB. The framework was targeted to be cationic due to the existence of predesignated cationic M3-cluster SBUs. In-TATAB exhibited highly effective adsorptive ability of some common organic pollutants, specifically anionic dyes such as ACBK, CR, AR-26, DB-38 and OII. Charge interactions dominated the adsorption processes, as the framework provided higher adsorption capacity and rate toward dye molecules with higher negative charges. Beside the charge interaction, the terminal H2O on the In3-cluster and abundant nitrogen moieties in the organic ligand can provide hydrogen bond interactions between dye molecules and In-TATAB, and then enhance the adsorptive ability. In-TATAB also exhibited selective adsorption of anionic dyes over neutral and cationic dyes. This work presents an effective way to design and synthesize MOFs with cationic frameworks and abundant hydrogen-bond sites for effective adsorption of toxic organic pollutants.Conflicts of interest
There are no conflicts to declare.Acknowledgements
The authors gratefully acknowledge the financial support of the National Natural Science Foundation of China (No. 21771078 and 21621001), the 111 Project (B17020), the National Key Research and Development Program of China (2016YFB0701100).References
- A. Ayati, M. N. Shahrak, B. Tanhaei and M. Sillanpää, Chemosphere, 2016, 160, 30–44 CrossRef CAS; C.-C. Wang, J.-R. Li, X.-L. Lv, Y.-Q. Zhang and G. Guo, Energy Environ. Sci., 2014, 7, 2831–2867 RSC; A. A. Adeyemo, I. O. Adeoye and O. S. Bello, Toxicol. Environ. Chem., 2012, 94, 1846–1863 CrossRef.
- J. B. DeCoste and G. W. Peterson, Chem. Rev., 2014, 114, 5695–5727 CrossRef CAS.
- B. Shen, H. C. Liu, W. B. Ou, G. Eilers, S. M. Zhou, F. G. Meng, C. Q. Li and Y. Q. Li, J. Appl. Toxicol., 2015, 35, 1473–1480 CrossRef CAS.
- V. Homem and L. Santos, J. Environ. Manage., 2011, 92, 2304–2347 CrossRef CAS.
- H. Zeng, M. Xie, Y. L. Huang, Y. Zhao, X. J. Xie, J. P. Bai, M. Y. Wan, R. Krishna, W. Lu and D. Li, Angew. Chem., Int. Ed., 2019, 58, 8515–8519 CrossRef CAS; Z. Niu, X. Cui, T. Pham, P. C. Lan, H. Xing, K. A. Forrest, L. Wojtas, B. Space and S. Ma, Angew. Chem., Int. Ed., 2019, 58, 10138–10141 CrossRef; H. Chen, Z. Chen, L. Zhang, P. Li, J. Liu, L. R. Redfern, S. Moribe, Q. Cui, R. Q. Snurr and O. K. Farha, Chem. Mater., 2019, 31, 2702–2706 CrossRef; H. Yang, F. Peng, C. Dang, Y. Wang, D. Hu, X. Zhao, P. Feng and X. Bu, J. Am. Chem. Soc., 2019, 141, 9808–9812 CrossRef.
- W. Liang, P. M. Bhatt, A. Shkurenko, K. Adil, G. Mouchaham, H. Aggarwal, A. Mallick, A. Jamal, Y. Belmabkhout and M. Eddaoudi, Chem, 2019, 5, 950–963 Search PubMed; H. Wang, X. Dong, E. Velasco, D. H. Olson, Y. Han and J. Li, Energy Environ. Sci., 2018, 11, 1226–1231 RSC; Z.-R. Tao, J.-X. Wu, Y.-J. Zhao, M. Xu, W.-Q. Tang, Q.-H. Zhang, L. Gu, D.-H. Liu and Z.-Y. Gu, Nat. Commun., 2019, 10, 2911 CrossRef CAS.
- S. Leubner, H. Zhao, N. Van Velthoven, M. Henrion, H. Reinsch, D. E. De Vos, U. Kolb and N. Stock, Angew. Chem., Int. Ed., 2019, 58, 10995–11000 CrossRef CAS; F. Guo, J.-H. Guo, P. Wang, Y.-S. Kang, Y. Liu, J. Zhao and W.-Y. Sun, Chem. Sci., 2019, 10, 4834–4838 RSC; V. Pascanu, G. González Miera, A. K. Inge and B. Martín-Matute, J. Am. Chem. Soc., 2019, 141, 7223–7234 CrossRef; X. Zhang, Z. Huang, M. Ferrandon, D. Yang, L. Robison, P. Li, T. C. Wang, M. Delferro and O. K. Farha, Nat. Catal., 2018, 1, 356–362 CrossRef.
- I. Stassen, J.-H. Dou, C. Hendon and M. Dincă, ACS Cent. Sci., 2019, 5, 1425–1431 CrossRef CAS; S. Wu, Y. Lin, J. Liu, W. Shi, G. Yang and P. Cheng, Adv. Funct. Mater., 2018, 28, 1707169 CrossRef; V. Chernikova, O. Yassine, O. Shekhah, M. Eddaoudi and K. N. Salama, J. Mater. Chem. A, 2018, 6, 5550–5554 RSC; Y. Wang, X. Liu, X. Li, F. Zhai, S. Yan, N. Liu, Z. Chai, Y. Xu, X. Ouyang and S. Wang, J. Am. Chem. Soc., 2019, 141, 8030–8034 Search PubMed.
- Z. He, X. Huang, C. Wang, X. Li, Y. Liu, Z. Zhou, S. Wang, F. Zhang, Z. Wang, O. Jacobson, J.-J. Zhu, G. Yu, Y. Dai and X. Chen, Angew. Chem., Int. Ed., 2019, 58, 8752–8756 CrossRef CAS; G. Lan, K. Ni, S. S. Veroneau, X. Feng, G. T. Nash, T. Luo, Z. Xu and W. Lin, J. Am. Chem. Soc., 2019, 141, 4204–4208 CrossRef.
- Z. Wang, C. Y. Zhu, J. T. Mo, P. Y. Fu, Y. W. Zhao, S. Y. Yin, J. J. Jiang, M. Pan and C. Y. Su, Angew. Chem., Int. Ed., 2019, 58, 9752–9757 CrossRef CAS; C.-X. Chen, Z.-W. Wei, C.-C. Cao, S.-Y. Yin, Q.-F. Qiu, N.-X. Zhu, Y.-Y. Xiong, J.-J. Jiang, M. Pan and C.-Y. Su, Chem. Mater., 2019, 31, 5550–5557 CrossRef.
- R. Malik, M. J. Loveridge, L. J. Williams, Q. Huang, G. West, P. R. Shearing, R. Bhagat and R. I. Walton, Chem. Mater., 2019, 31, 4156–4165 CrossRef CAS; W. Cheng, X. Zhao, H. Su, F. Tang, W. Che, H. Zhang and Q. Liu, Nat. Energy, 2019, 4, 115–122 CrossRef; A. I. Nguyen, K. M. van Allsburg, M. W. Terban, M. Bajdich, J. Oktawiec, J. Amtawong, M. S. Ziegler, J. P. Dombrowski, K. V. Lakshmi, W. S. Drisdell, J. Yano, S. J. L. Billinge and T. D. Tilley, Proc. Natl. Acad. Sci. U. S. A., 2019, 116, 11630–11639 Search PubMed.
- P. Li, N. A. Vermeulen, X. Gong, C. D. Malliakas, J. F. Stoddart, J. T. Hupp and O. K. Farha, Angew. Chem., Int. Ed., 2016, 55, 10358–10362 CrossRef CAS.
- Y. Zhou, S. Yao, Y. Ma, G. Li, Q. Huo and Y. Liu, Chem. Commun., 2018, 54, 3006–3009 RSC; S. Yao, T. Xu, N. Zhao, L. Zhang, Q. Huo and Y. Liu, Dalton Trans., 2017, 46, 3332–3337 RSC; C. Mao, R. A. Kudla, F. Zuo, X. Zhao, L. J. Mueller, X. Bu and P. Feng, J. Am. Chem. Soc., 2014, 136, 7579–7582 CrossRef CAS; Z. Wang, C.-Y. Zhu, H.-S. Zhao, S.-Y. Yin, S.-J. Wang, J.-H. Zhang, J.-J. Jiang, M. Pan and C.-Y. Su, J. Mater. Chem. A, 2019, 7, 4751–4758 RSC.
- W. Fan, X. Wang, X. Zhang, X. Liu, Y. Wang, Z. Kang, F. Dai, B. Xu, R. Wang and D. Sun, ACS Cent. Sci., 2019, 5, 1261–1268 CrossRef CAS; C. C. Liang, Z. L. Shi, C. T. He, J. Tan, H. D. Zhou, H. L. Zhou, Y. Lee and Y. B. Zhang, J. Am. Chem. Soc., 2017, 139, 13300–13303 CrossRef.
- X. Zhao, C. Mao, K. T. Luong, Q. Lin, Q. G. Zhai, P. Feng and X. Bu, Angew. Chem., Int. Ed., 2016, 55, 2768–2772 CrossRef CAS; S. M. Towsif Abtab, D. Alezi, P. M. Bhatt, A. Shkurenko, Y. Belmabkhout, H. Aggarwal, J. Weseliński, N. Alsadun, U. Samin, M. N. Hedhili and M. Eddaoudi, Chem, 2018, 4, 94–105 Search PubMed; D. Feng, K. Wang, Z. Wei, Y. P. Chen, C. M. Simon, R. K. Arvapally, R. L. Martin, M. Bosch, T. F. Liu, S. Fordham, D. Yuan, M. A. Omary, M. Haranczyk, B. Smit and H. C. Zhou, Nat. Commun., 2014, 5, 5723 CrossRef.
- Y. Liu, J. F. Eubank, A. J. Cairns, J. Eckert, V. Kravtsov, R. Luebke and M. Eddaoudi, Angew. Chem., Int. Ed., 2007, 46, 3278–3283 CrossRef CAS; J. Qian, F. Jiang, K. Su, J. Pan, Z. Xue, L. Liang, P. P. Bag and M. Hong, Chem. Commun., 2014, 50, 15224–15227 RSC; Z. Chen, L. J. Weselinski, K. Adil, Y. Belmabkhout, A. Shkurenko, H. Jiang, P. M. Bhatt, V. Guillerm, E. Dauzon, D. X. Xue, M. O'Keeffe and M. Eddaoudi, J. Am. Chem. Soc., 2017, 139, 3265–3274 CrossRef PubMed.
- H. Yang, F. Wang, Y. Kang, T. H. Li and J. Zhang, Dalton Trans., 2012, 41, 2873–2876 RSC; J. Qian, F. Jiang, K. Su, Q. Li, D. Yuan and M. Hong, Inorg. Chem., 2014, 53, 12228–12230 CrossRef CAS; X. Zhao, X. Bu, E. T. Nguyen, Q. G. Zhai, C. Mao and P. Feng, J. Am. Chem. Soc., 2016, 138, 15102–15105 CrossRef.
- Y. Yuan, J. Li, X. Sun, G. Li, Y. Liu, G. Verma and S. Ma, Chem. Mater., 2019, 31, 1084–1091 CrossRef CAS; D. Reinares-Fisac, L. M. Aguirre-Diaz, M. Iglesias, N. Snejko, E. Gutierrez-Puebla, M. A. Monge and F. Gandara, J. Am. Chem. Soc., 2016, 138, 9089–9092 CrossRef PubMed.
- F. Bu, Q. Lin, Q. G. Zhai, X. Bu and P. Feng, Dalton Trans., 2015, 44, 16671–16674 RSC; X. Du, R. Fan, L. Qiang, Y. Song, K. Xing, W. Chen, P. Wang and Y. Yang, Inorg. Chem., 2017, 56, 3429–3439 CrossRef CAS.
- X. Zhao, X. Bu, T. Wu, S. T. Zheng, L. Wang and P. Feng, Nat. Commun., 2013, 4, 2344 CrossRef.
- X. Liu, B. Liu, G. Li and Y. Liu, J. Mater. Chem. A, 2018, 6, 17177–17185 RSC.
- Q. Chen, Q. He, M. Lv, Y. Xu, H. Yang, X. Liu and F. Wei, Appl. Surf. Sci., 2015, 327, 77–85 CrossRef CAS; Z. Hasan and S. H. Jhung, J. Hazard. Mater., 2015, 283, 329–339 CrossRef; E. Haque, V. Lo, A. I. Minett, A. T. Harris and T. L. Church, J. Mater. Chem. A, 2014, 2, 193–203 RSC; J. Tan, B. Zhou, C. Liang, H. Zinky, H.-L. Zhou and Y.-B. Zhang, Mater. Chem. Front., 2018, 2, 129–135 RSC; Y.-H. Fan, S.-W. Zhang, S.-B. Qin, X.-S. Li and S.-H. Qi, Microporous Mesoporous Mater., 2018, 263, 120–127 CrossRef.
- G. Sheldrick, Acta Crystallogr., Sect. A: Found. Crystallogr., 2008, 64, 112–122 CrossRef CAS; G. Sheldrick, Acta Crystallogr., Sect. C: Struct. Chem., 2015, 71, 3–8 Search PubMed.
- M. Latroche, S. Surble, C. Serre, C. Mellot-Draznieks, P. L. Llewellyn, J. H. Lee, J. S. Chang, S. H. Jhung and G. Ferey, Angew. Chem., Int. Ed., 2006, 45, 8227–8231 CrossRef CAS; A. Vimont, J.-M. Goupil, J.-C. Lavalley, M. Daturi, S. Surblé, C. Serre, F. Millange, G. Férey and N. Audebrand, J. Am. Chem. Soc., 2006, 128, 3218–3227 CrossRef.
- D. Feng, T. F. Liu, J. Su, M. Bosch, Z. Wei, W. Wan, D. Yuan, Y. P. Chen, X. Wang, K. Wang, X. Lian, Z. Y. Gu, J. Park, X. Zou and H. C. Zhou, Nat. Commun., 2015, 6, 5979 CrossRef.
- Q. Liu, Y. Song, Y. Ma, Y. Zhou, H. Cong, C. Wang, J. Wu, G. Hu, M. O'Keeffe and H. Deng, J. Am. Chem. Soc., 2019, 141, 488–496 CrossRef CAS.
- D. M. Chen, W. Shi and P. Cheng, Chem. Commun., 2015, 51, 370–372 RSC; W. He, N. Li, X. Wang, T. Hu and X. Bu, Chin. Chem. Lett., 2018, 29, 857–860 CrossRef CAS; K. Nath, K. Maity and K. Biradha, Cryst. Growth Des., 2017, 17, 4437–4444 CrossRef; Y. Xu, J. Jin, X. Li, Y. Han, H. Meng, T. Wang and X. Zhang, RSC Adv., 2015, 5, 19199–19202 RSC.
- W. Yan, L. J. Han, H. L. Jia, K. Shen, T. Wang and H. G. Zheng, Inorg. Chem., 2016, 55, 8816–8821 CrossRef CAS; S. Duan, J. Li, X. Liu, Y. Wang, S. Zeng, D. Shao and T. Hayat, ACS Sustainable Chem. Eng., 2016, 4, 3368–3378 CrossRef; F. Tan, M. Liu, K. Li, Y. Wang, J. Wang, X. Guo, G. Zhang and C. Song, Chem. Eng. J., 2015, 281, 360–367 CrossRef; J. Qiu, Y. Feng, X. Zhang, M. Jia and J. Yao, J. Colloid Interface Sci., 2017, 499, 151–158 CrossRef.
Footnote |
| † Electronic supplementary information (ESI) available: XRD, TGA, crystal structures and spectra. CCDC 1876347 and 1876393. For ESI and crystallographic data in CIF or other electronic format see DOI: 10.1039/c9qm00644c |
| This journal is © the Partner Organisations 2020 |

