 Open Access Article
Creative Commons Attribution 3.0 Unported Licence
High-viscosity α-starch nanogel particles to enhance oil recovery
Tuo Liang ,
Jirui Hou,
Ming Qu
 *,
Mengdan Zhao and
Infant Raj
China University of Petroleum-Beijing, Changping, 102249, Beijing, P. R. China. E-mail: m.qu@foxmail.com
First published on 26th February 2020
Abstract
The formation of dominant water channels is a serious problem for most oilfields, which results in low sweep efficiency. Recently, gels regarded as materials for the conformance improvement of water have attracted significant attention for increasing the sweep efficiency in many reservoirs suffering from water invasion but no effect on oil displacement efficiency. Nanogel particles possessing synergic properties that increase sweep efficiency and oil displacement efficiency have not been previously reported. Herein, economical high-viscosity α-starch nanogel particles were synthesized through a free radical reaction to play the synergistic role of gel and nanoparticles. The average diameter of the nanogel particles was 30 nm with a dispersion viscosity of 250 mPa s at 90 °C. A linear formula describing the relationship among the nanogel particle dispersion viscosity, temperature and concentration was also perfectly fitted. Core flooding experiments have demonstrated that both light and heavy oil recovery rates reached around 30%. The EOR mechanisms and flow behaviors of the nanogel particles were revealed through 2-D visualized model experiments under different conditions. On the one hand, nanogel particles could displace oil droplets from the rock surface due to the creation of the structural disjoining pressure. On the other hand, nanogel particle dispersion with high viscosity could increase the sweep efficiency and drag oil clusters out of the oil phase. Therefore, nanogel particles could be regarded as a potential candidate for enhancing oil recovery.
1 Introduction
In recent years, there has been a serious issue concerning the dramatically increasing oil demands and decreasing oil production caused by the majority of mature oilfields entering a high water cut period.1–3 Recently, new materials and technologies for controlling water conformance in the oilfields to prevent water from production wells and increase oil production of remaining oil after water flooding were explored.4–6Different kinds of materials have been employed to plug water channels and reduce high water cut to enhance oil recovery. One of the methods, namely gel treatment, has attracted significant attention from researchers for the reduction of water production as a feasible and economical technology.7 The gel treatment not only improved the viscosity of the displacement phase but also increased the microscopic sweep efficiency by plugging highly permeable zones. There are two common kinds of gel: in situ bulk gel and prepared gel.8–11
A mixture of crosslinker and polymer solution is injected into formation first, and then the gel is formed at in situ reservoir conditions to plug water channels. Oil production was achieved by utilizing in situ gel to control water conformance and increase sweep efficiency.12,13 However, several drawbacks restricted in situ bulk gel application in some harsh reservoirs, such as the lack of gel strength control, gelation time control, adsorption water and chromatographic fractionation.1,10,14,15
Some researchers have proposed a new type of gel synthesized before water injection to overcome the disadvantages of in situ bulk gel. This novel gel has better performance in complex reservoir conditions such as high temperature and salinity.4,10 Hence, many researchers have been interested in synthesizing various novel gels including PPGs, microgel particles and pH-sensitive polymer microgels. PPGs are superabsorbent crosslinking polymers with micro- to millimeter-scale sizes.4,16 Microgel particles are studied due to their stability, elastic deformation and size-control. The size of the microgel particles was 1000 nm less than that of PPGs.17,18 The pH-sensitive polymer microgel, as the initiator, was synthesized by altering the pH. It had excellent stability under the maximum pressure gradients of 4000 psi per ft.19,20 The main differences in the above gels were particle size, swelling ratio and gel strength.
However, these gels mentioned above were able to improve the sweep efficiency but had a limited effect on improving the oil displacement efficiency. The nanomaterial technique, as a new technology for further effectively improving oil displacement efficiency, has been widely studied.21–23 There are many published papers concentrated on interfacial tension changes, emulsion stabilization and foams from nanoparticle absorption at interfaces.24–26 Moghadam and Azizian27 investigated the synergistic effect of ZnO nanoparticles and cationic surfactant CTAB on the dynamic and equilibrium interfacial tension. The results showed that nanoparticles in the presence of CTAB decreased the interfacial tension by a synergistic effect, while the nanoparticles solely had no prominent contribution to the reduction of interfacial tension. Experiments regarding the effects of hydrophilic silica nanoparticles in the presence of cationic surfactants on the interfacial tension were also conducted. The results illustrated that the silica nanoparticles increased the interfacial tension.28 Ma et al.29 researched the influence of silica nanoparticles on surface and interfacial tensions in the presence of anionic and non-ionic surfactants; their results showed that interfacial tension decreased with the addition of silica nanoparticles.29 The nanomaterials have excellent potential to improve the efficiency of oil displacement but have limited effects on improving the sweep efficiency. To date, there has been no work on simultaneously utilizing materials possessing both the properties of nanoparticles and gel.
In this study, in order to simultaneously determine the synergistic effects of gel and nanomaterials on enhanced oil recovery, we synthesized novel nanogel particles with a diameter of 30 nm through a free radical reaction using α-starch, acrylamide, N,N′-methylene bisacrylamide, and potassium persulfate. The viscosity of the nanogel particle dispersion was also measured under different conditions using a viscometer. Core flooding experiments were conducted to test the effects of the nanogel particles when used for enhanced oil recovery under different driving conditions. Moreover, several complex 2-D visualized models were also designed and fabricated to study the mechanisms and flow behaviors of the nanogel particles during the process of oil displacement.
2 Methods
2.1 Synthesis of nanogel particles
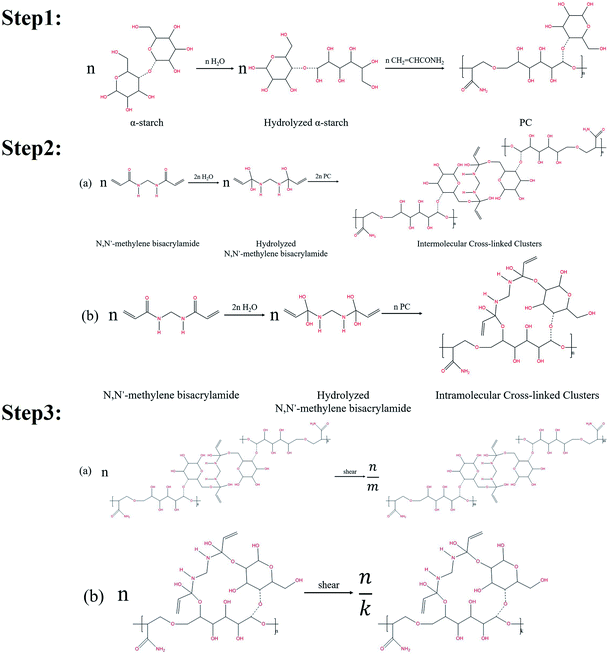
Nanogel particles used in this study were synthesized by a free radical reaction using α-starch, acrylamide, N,N′-methylene bisacrylamide (crosslinking agent), potassium persulfate (initiator), and deionized (DI) water.The organic cross-linking reactions of the in situ α-starch gel systems are related to the hydroxyl groups (–CH2OH). Fig. 1 illustrates the reaction steps in a complete α-starch-based gel system.
 | ||
| Fig. 1 Gelation mechanisms of the cross-linking reaction between the α-starch and N,N′-methylene bisacrylamide. | ||
Firstly, the ether bond of one six-membered ring in the α-starch molecule was opened by hydrolysis to form two hydroxyl groups. Then, with the effect of the initiator, the hydrolyzed α-starch reacted with acrylamide to facilitate the polymer condensation (PC), which is shown in step 1 of Fig. 1. Secondly, the carbonyl of the N,N′-methylene bisacrylamide molecule was converted into hydroxyl groups by hydrolysis. PC was further carried out via the hydroxyl dehydration condensation with hydrolyzed N,N′-methylene bisacrylamide to form intermolecular/intramolecular cross-linked clusters (several different structures, as shown in step 2 of Fig. 1). Thirdly, the chain length of the intermolecular/intramolecular clusters decreased to facilitate macromolecular agglomeration under mechanical shearing (only one of the structures is indicated), which is shown in step 3 of Fig. 1. Notably, there are lots of hydroxyl groups exposed in macromolecular agglomerations, providing more opportunities for cross-linking to form high-viscosity nanogel particles.
Based on the above chemical reactions, the aqueous solution containing 3 wt% α-starch, 3 wt% acrylamide, 0.15 wt% N,N′-methylene bisacrylamide, 0.2 wt% potassium persulfate was allowed to stand for 30 minutes at 50 °C to gel (Fig. 2(a)). Afterwards, the nanogel particle dispersion was obtained by stirring the gel at 2000 rpm for 1 minute (Fig. 2(b)).
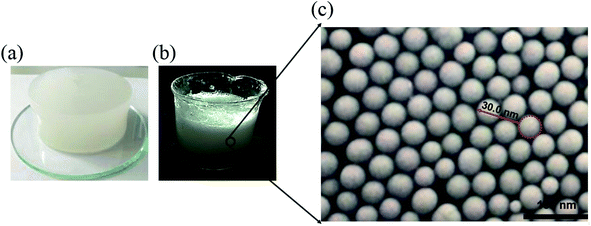 | ||
| Fig. 2 (a–c) α-Starch gel, nanogel particle dispersion, and SEM image of the nanogel particles, respectively. | ||
2.2 Chemicals used
The oil for the 2-D visualized model experiments was a mixture of aqueous kerosene and paraffin with the volume ration of 1![[thin space (1/6-em)]](https://www.rsc.org/images/entities/char_2009.gif) :
:![[thin space (1/6-em)]](https://www.rsc.org/images/entities/char_2009.gif) 20. The viscosity was 23.9 mPa s at 25 °C, measured using a HAAKE RS600 rheometer. Sudan III was added to the oil mixture to enhance the visual effect, turning the color of the model oil into red.
20. The viscosity was 23.9 mPa s at 25 °C, measured using a HAAKE RS600 rheometer. Sudan III was added to the oil mixture to enhance the visual effect, turning the color of the model oil into red.
The oil for the core flooding experiments was provided by the Daqing oilfield. The viscosity was 25 mPa s and 100 mPa s at 25 °C, measured by a HAAKE RS600 rheometer.
The Daqing oilfield synthetic brine (Table 1) was employed to conduct the 2-D visualized model and core flooding experiments. Additionally, the brine was dyed blue in 2-D visualized experiments for better visual effects by adding 0.05 mg L−1 of methylene blue.
| Concentration of ions (mg L−1) | Total salinity (mg L−1) | ||||||
|---|---|---|---|---|---|---|---|
| Ca2+ | Mg2+ | K+ + Na+ | CO32− | HCO3− | Cl− | SO42− | |
| 15 | 7 | 2428 | 198 | 2160 | 2267 | 54 | 7129 |
2.3 Viscosity measurement
The viscosities of the nanogel particles, at different concentrations (0.5 wt% and 1.5 wt%) versus different temperatures ranging from 25 °C to 90 °C, were measured by the HAAKE RS600 rheometer (Thermo Electron Co., Germany).2.4 Cores for flooding experiments
Reservoir sandstones of the Daqing oilfield were used for flooding experiments with various permeabilities ranging from 25 mD to 2500 mD. Additionally, the cores were cylindrical with a diameter of 25 mm and a length of 100 mm. The processes of the core flooding experiments are as follows:① The cylindrical core was placed in a core holder and after confining pressure was added to the core, the air was removed from the fixed core by a vacuum pump.
② The core without air was saturated with simulated formation water by a constant flow pump at 1 mL min−1. The volume of saturated water was recorded as Vwi, representing the volume of pore space (Vp).
③ The crude oil was injected to displace the simulated formation water at 0.2 mL min−1 using a constant flow pump. The volume of displaced water was recorded as Voi to calculate the initial oil saturation (Soi) according to eqn (1). Additionally, the prepared core was aged for 3 days to simulate the formation of actual reservoirs.
 | (1) |
④ Water flooding was performed at 0.2 mL min−1 until the water cut reached 98%, and the oil production (Vow) and oil recovery rate (Row) were calculated according to eqn (2). The nanogel particle dispersion was injected at the same velocity of 0.2 mL min−1. The secondary oil production (Vop) and oil recovery rate (Rop) were calculated using eqn (3).
⑤ The above steps were repeated when other parameters were investigated.
 | (2) |
 | (3) |
2.5 2-D visualized models
The 2-D visualized models were designed and fabricated based on the scanning electron microscope (SEM) investigation of core tablets. It was difficult to describe all the characteristics of totally different pores and throats of natural core tablets (Fig. 3(a) and 4(a)) derived from the Daqing oilfield. Thus, the 2-D visualized model diagrams were designed based on SEM images (Fig. 3(b) and 4(b)). For better visual effects, the 2-D visualized models were made of oil-wet transparent polymethyl methacrylate. A laser numerical control lathe was utilized to engrave the inner pores and throats. Finally, the 2-D visualized models, with permeabilities of 25 mD (Fig. 3(c)) and 2500 mD (Fig. 4(c)), were obtained to conduct experiments to determine the EOR mechanisms and flow behaviors of the nanogel particles in porous media.3 Results and discussion
3.1 Properties of the nanogel particle dispersion
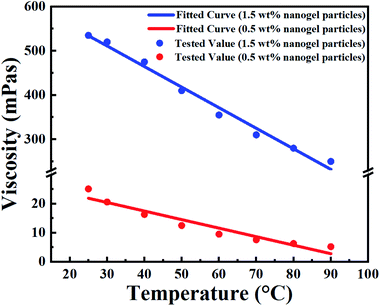 | ||
| Fig. 5 Fitted (curves) and measured (points) viscosity of the nanogel particle dispersion versus the temperature and concentration of nanogel particles. | ||
In terms of temperature, the viscosity of the nanogel particle dispersion gradually decreased with increasing system temperature for both 1.5 wt% and 0.5 wt% concentrations of nanogel particles. However, the viscosity for the 1.5 wt% nanogel particle system decreased faster than that of the 0.5 wt% nanogel particle system. This may be explained by the fact that the high-viscosity system was more sensitive to temperature. It is noteworthy that there was a linear relationship between temperature and viscosity. The different linear relationships were fitted and are exhibited in Table 2.
| Concentration of nanogel particles (wt%) | Linear relationship | Adj. R-square |
|---|---|---|
| a Where η is the viscosity of the nanogel particle dispersion (mPa s); T is the ambient temperature (°C). | ||
| 0.5 | η = −0.29403 × T + 29.24278 | 0.92378 |
| 1.5 | η = −4.65133 × T + 650.50533 | 0.98728 |
The correlations were trustworthy according to the value of Adj. R-square representing the degree of fitting.
Moreover, the viscosity of the nanogel particle dispersion dramatically increased on increasing the concentration of the nanogel particles and the viscosity was much higher than that of B-PPG.31 The high viscosity of the dispersion for 1.5 wt% nanogel particles was attributed to stronger intermolecular entanglement and the formation of three-dimensional complex network structures.31
Based on a detailed analysis of the relationships among the viscosity of nanogel, particle dispersion, temperature and concentration of nanogel particles, a comprehensive correlation (eqn (4)) was obtained and utilized to describe all the experimental data. The fitted curves are shown in Fig. 5 and the values are consistent with the experimental data.
| η(α,T) = (A × T + B) × α + C × T + D | (4) |
| Correlation coefficient | A | B | C | D |
|---|---|---|---|---|
| Value | −4.3573 | 621.26 | 1.8846 | −281.39 |
3.2 Core flooding experiments
The core flooding experiments were conducted to determine the best oil recovery rate under different experimental conditions (as shown in Table 4). The temperature was fixed at 25 °C for all experiments.| Core no. | Permeability (mD) | Porosity (%) | Average pore throat diameter (μm) | Oil viscosity (mPa s) | Concentration of nanogel particles (wt%) |
|---|---|---|---|---|---|
| 1 | 25 | 0.22 | 1.91 | 25 | 1.5 |
| 2 | 25 | 0.20 | 2.00 | 25 | 0.5 |
| 3 | 25 | 0.21 | 1.95 | 100 | 1.5 |
| 4 | 25 | 0.23 | 1.87 | 100 | 0.5 |
| 5 | 2500 | 0.23 | 18.65 | 25 | 1.5 |
| 6 | 2500 | 0.21 | 19.52 | 25 | 0.5 |
| 7 | 2500 | 0.24 | 18.26 | 100 | 1.5 |
| 8 | 2500 | 0.23 | 18.65 | 100 | 0.5 |
Eqn (5) was introduced to calculate the average diameter of pores and throats while the value of τ was 2.
 | (5) |
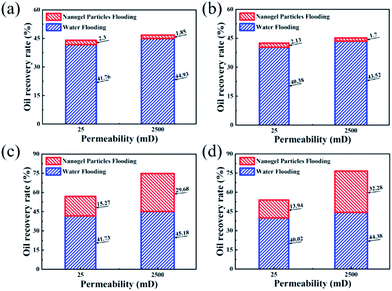
The experimental results of core flooding are shown in Fig. 6. In Fig. 6(a) and (b), the values of the oil recovery rate after 0.5 wt% nanogel particle dispersion flooding were almost same, although the other experimental conditions such as permeability and oil viscosity were different. In comparison with the 0.5 wt% nanogel particle dispersion, the 1.5 wt% nanogel particle dispersion had a significant incremental oil recovery after nanogel particle dispersion flooding. Fig. 6(c) shows that the oil recovery rates for the 25 mD and 2500 mD models were 15.27% and 29.68%, respectively, with the oil viscosity of 25 mPa s. Fig. 6(d) indicates that the oil recovery rates for 25 mD and 2500 mD were 13.94% and 32.28%, respectively, with the oil viscosity of 100 mPa s. Based on the results of the core flooding experiments, we came to the following two conclusions: the high concentration of nanogel particles was more conducive to enhanced oil recovery; nanogel particles have the potential for application in 2500 mD cores as compared with 25 mD cores.
3.3 Flow behaviors of nanogel particles
In order to analyze the flow behaviors of nanogel particles, the 2-D visualized model experiments were carried out to observe and analyze the characteristics of nanogel particles in porous media. Several parameters, including permeability, the concentration of the nanogel particles, injection direction and injection rate, were studied in depth.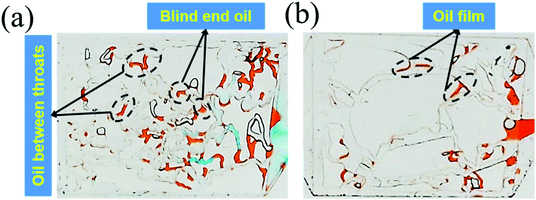 | ||
| Fig. 7 (a) The remaining oil distribution in the 25 mD model; (b) the remaining oil distribution in the 2500 mD model. | ||
The above results were attributed to the different structures and sizes of pores and throats in different permeability models. As seen in Fig. 7(a), the tortuosity and coordination number of the pore throat in 25 mD were higher as compared to that in 2500 mD, causing more blind end holes and trapping more remaining oil. Moreover, eqn (5) implies that smaller diameters of pores and throats existed in 25 mD. Thus, the capillary force calculated according to eqn (6) in the 25 mD model was higher than that in the 2500 mD model. The wettability of the surface of the model was oil-wet, thus the capillary force was resistant to the oil displacement, which leads to more remaining oil being trapped in the 25 mD model; the higher the permeability, the larger the pore size. Therefore, the majority of pores and throats could be swept by the nanogel particles in the 2500 mD model. Combined with the oil displacement effect of the nanogel particles, little remaining oil was left in the 2500 mD model (Fig. 7(b)). As a result, the greater oil recovery rate was obtained at the permeability of the 2500 mD core.
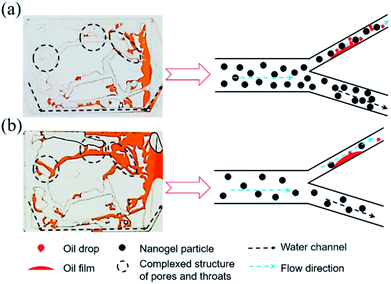 | ||
| Fig. 8 (a) Distribution of the remaining oil after 1.5 wt% nanogel particle flooding; (b) distribution of the remaining oil after 0.5 wt% nanogel particle flooding. | ||
The viscosity of the nanogel particle dispersion with the concentration of 0.5 wt% could be negligible (as shown in Fig. 5) as compared to the 1.5 wt% nanogel particle dispersion, which caused more remaining oil to be left as shown in Fig. 8(b). In Fig. 8(a), more nanogel particles preferred to flow through the water channels, causing a plugging wall and the increase in the percolation resistance. Thus, the subsequent nanogel particles were forced into the micron–nano scale pore throat, which increased the sweep efficiency and oil recovery rate. In terms of the 0.5 wt% nanogel particle dispersion, the plugging effect was not successful due to the presence of fewer nanogel particles. As a result, the nanogel particles only flowed along the water channel. Thus, the oil in the small pores and throats was not able to be effectively displaced during the process of nanogel particle flooding, as shown in Fig. 8(b). In addition, the greater viscosity of the nanogel particle dispersion with 1.5 wt% nanogel particles was also attributed to stronger intermolecular association among more nanogel particles, which formed three-dimensional network structures.34
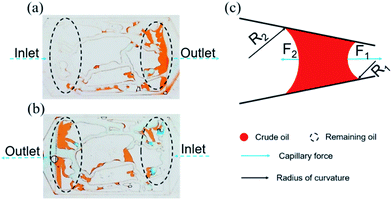 | ||
| Fig. 9 Distribution of the remaining oil in the injection direction (a) from left to right, (b) from right to left. (c) Force analysis of the curve interface. | ||
The above experimental results are attributed to the structures of the pores and throats in the porous media. In terms of the injection direction as shown in Fig. 9(a), the width of the pores and throats gradually decreased near the inlet as drawn in Fig. 9(c). There were two different meniscuses with different radii of curvature (R1 and R2) on both sides of the oil phase in throats. According to the Laplace equation as shown in eqn (6), the capillary force was calculated and recorded as F1 and F2:
 | (6) |
Obviously, F1 was larger than F2 due to the R1 < R2, representing the direction of the net force of the capillary force pointing to the right consistent with the displacement direction. Thus, the capillary force was beneficial for displacing oil near the inlet. On the contrary, the characteristics of the throat near the outlet were the opposite, leading to the net force of the capillary force pointing to the left, inconsistent with the displacement direction (as shown in Fig. 9(c)). Therefore, the capillary force was resistant to oil displacement, causing the remaining oil to be left mainly near the outlet. However, the direction of the net capillary force was opposite when the injection direction was the opposite. In other words, the capillary force played an opposite role at the same position in porous media. Thus, the distribution of the remaining oil was also in the vicinity of the outlet (as shown in Fig. 9(b)).
The oil was trapped in porous media due to intermolecular forces between oil molecules, and oil molecules and the solid particles, which prevented the movement of oil molecules from the solid. However, once the oil molecules enhanced the energy to neutralize the binding force, they were easily displaced. Inspired by this, the momentum conservation laws were introduced to explain the mechanism of oil displacement with the influence of the injection rate. The collision between nanogel particles and oil droplets was considered to be a perfect elastic collision and eqn (7) was utilized to briefly describe the momentum conservation law.
| Ft = MV′ + mv′ = MV + mv | (7) |
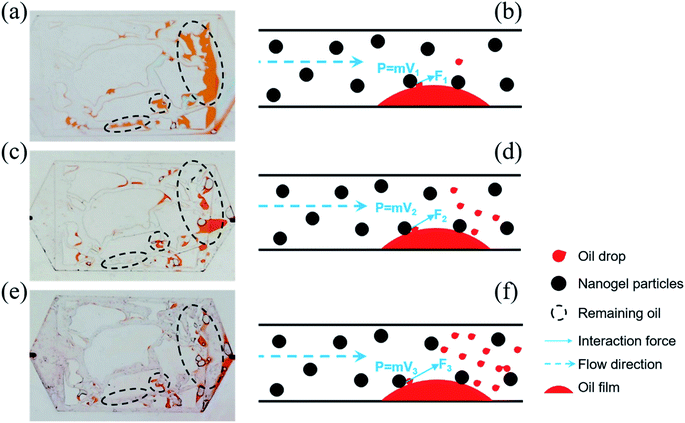
F was beneficial in promoting oil droplets getting rid of the constraint of intermolecular forces. Eqn (7) demonstrates that F is proportional to the velocity V. Thus, the value of F would be increased on increasing the injection rate of the nanogel particles. The larger the value of F, the more oil droplets are replaced. Finally, there was less remaining oil in the porous media as the injection rate increased (as shown in Fig. 10(b), (d) and (f)). On the other hand, the plugging was formed more easily when the injection rate was high, which could increase the sweep efficiency.
3.4 EOR mechanisms of nanogel particles
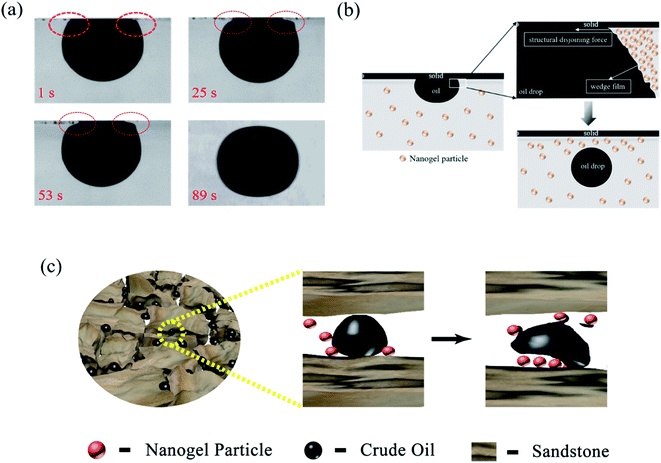
Fig. 11 revealed the EOR mechanism of the nanogel particles based on the immersion experiment and 2-D visualized experiments. The immersion experiment involved the immersion of one oil droplet, which was adhered to a solid, in the 1.5 wt% nanogel particle dispersion and measuring the contact angle. The 2-D visualized model experiments, including the effects of permeability, the concentration of the nanogel particles, injection direction and injection rate on the flow behaviors of nanogel particles in porous media, were also conducted.Fig. 11(a) shows the characteristics of the oil drop immersion in the static nanogel particle dispersion versus time. It is worth noting that the oil droplet was gradually moving away from the solid at both ends of the three-phase contact zone. Interestingly, the oil droplet was completely detached from the solid after 89 seconds. The above result may be ascribed to the presence of a force at the three-phase contact zone. Fig. 2(c) indicates that the diameter of the nanogel particles was 30 nm, which would cause the spreading behavior along the solid. Thus, the phenomenon (as shown in Fig. 11(a)) was attributed to the osmotic pressure, which caused the wedge film along its interface among the solid, nanogel particles and oil droplets.35,36 The structure of the nanogel particles within the wedge film could enhance the spreading of the nanogel particles on the solid. This would indicate that the wedge film induced an additional pressure force called the structural disjoining pressure at its interface to remove the oil droplets from the solid into the displacement phase. The structural disjoining pressure increased evenly as the nanogel particles spread further (as shown in Fig. 11(b)).37
We also determined some other oil displacement mechanisms of nanogel particles from dynamic experiments (as shown in Fig. 11(c)). Firstly, the viscosity of the 1.5 wt% nanogel particle dispersion was 250 mPa s of oil viscosity at 90 °C, attributed to the stronger intermolecular force among nanogel particles, causing greater mobility control. Secondly, more energy was transferred to the oil droplets from the nanogel particles by collision according to the momentum conservation laws. The oil droplets then moved away from the solid by overcoming the adhesion forces.
4 Conclusion
High-viscosity nanogel particles with a diameter of 30 nm were synthesized through a free-radical reaction to combine the effects of the gel and nanoparticles. The high viscosity of the nanogel particle dispersion with 250 mPa s at 90 °C was utilized to plug water channels and drag oil droplets out of the remaining oil. Core flooding experiments also demonstrated that both light and heavy oil recovery rates reached around 30%. The EOR mechanisms and flow behaviors of nanogel particles were also studied. According to the 2-D visualized model experiments, the momentum conservation law was first introduced to interpret the effect of the injection rate on the oil displacement efficiency, which demonstrated that the higher the injection rate, the better the oil displacement efficiency. Moreover, the presence of the structural disjoining pressure at the three-phase contact zone was proven through an immersion experiment, which is beneficial for oil displacement. In conclusion, nanogel particle dispersions with high viscosity can increase the sweep efficiency and also improve oil displacement efficiency.Conflicts of interest
The authors declare no competing financial interest.Acknowledgements
This work was supported by the National Natural Science Foundation of China (Grant No. 21427812, 21776308 and 21576289), National “111 Project” (B13010), and Important National Science and Technology Specific Projects of China (Grant No. 2016ZX05014-004-004).References
- A. Goudarzi, H. Zhang, A. Varavei, P. Taksaudom, Y. Hu, M. Delshad, B. Bai and K. Sepehrnoori, A Laboratory and Simulation Study of Preformed Particle Gels for Water Conformance Control, Fuel, 2015, 140, 502–513 CrossRef CAS.
- S. Zhao, W. Pu, B. Wei and X. Xu, A Comprehensive Investigation of Polymer Microspheres (PMs) Migration in Porous Media: EOR Implication, Fuel, 2019, 215, 249–258 CrossRef.
- F. B. Rego, V. E. Botechia and D. J. Schiozer, Heavy Oil Recovery by Polymer Flooding and Hot Water Injection Using Numerical Simulation, J. Pet. Sci. Eng., 2017, 153, 187–196 CrossRef.
- B. Bai, Y. Liu, J.-P. Coste and L. Li, Preformed Particle Gel for Conformance Control: Transport Mechanism Through Porous Media, SPE Reservoir Eval. Eng., 2007, 10(2), 176–184 CrossRef CAS.
- G. Chauveteau, A. Omari, R. Tabary, M. Renard and J. Rose, Controlling Gelation Time and Microgel Size for Water Shutoff, in SPE/DOE Improved Oil Recovery Symposium, April 3–5, Society of Petroleum Engineers, Tulsa, Oklahoma, 2000, SPE-59317-MS Search PubMed.
- C. Cozic, D. Rousseau and R. Tabary, Novel Insights into Microgel Systems for Water Control, SPE Prod. Oper., 2009, 24(04), 590–601 CAS.
- J. Pritchett, H. Frampton, J. Brinkman, S. Cheung, J. Morgan, K. Chang, D. Williams and G. Goodgame, Field Application of a New In-Depth Waterflood Conformance Improvement Tool, in SPE International Improved Oil Recovery Conference in Asia Pacific, October 20–21, Society of Petroleum Engineers, Kuala Lumpur, Malaysia, 2003, p. 8 Search PubMed.
- Y.-B. Qi, C.-G. Zheng, C.-Y. Lv, Z.-M. Lun and T. Ma, Compatibility Between Weak Gel and Microorganisms in Weak Gel-Assisted Microbial Enhanced Oil Recovery, J. Biosci. Bioeng., 2018, 126(2), 235–240 CrossRef CAS PubMed.
- G. Chauveteau, R. Tabary, M. Renard and A. Omari, Controlling In-Situ Gelation of Polyacrylamides by Zirconium for Water Shutoff, in SPE International Symposium on Oilfield Chemistry, February 16–19, Society of Petroleum Engineers, Houston, Texas, 1999, p. 9 Search PubMed.
- J. P. Coste, Y. Liu, B. Bai, Y. Li, P. Shen, Z. Wang and G. Zhu, In-Depth Fluid Diversion by Pre-Gelled Particles. Laboratory Study and Pilot Testing, SPE/DOE Improved Oil Recovery Symposium, April 3–5, Society of Petroleum Engineers, Tulsa, Oklahoma, 2000, p. 8 Search PubMed.
- A. Al-Ibadi and F. Civan, Experimental Investigation and Correlation of Treatment in Weak and High-Permeability Formations by Use of Gel Particles, SPE Prod. Oper., 2013, 28(04), 387–401 CAS.
- A. Imqam and B. Bai, Optimizing the Strength and Size of Preformed Particle Gels for Better Conformance Control Treatment, Fuel, 2015, 148, 178–185 CrossRef CAS.
- R. D. Sydansk, A. M. Al-Dhafeeri, Y. Xiong and R. S. Seright, Polymer Gels Formulated with a Combination of High- and Low-Molecular-Weight Polymers Provide Improved Performance for Water-Shutoff Treatments of Fractured Production Wells, SPE Prod. Facil., 2004, 19(04), 229–236 CrossRef CAS.
- A. K. Alhuraishawy, X. Sun, B. Bai, M. Wei and A. Imqam, Areal Sweep Efficiency Improvement by Integrating Preformed Particle Gel and Low Salinity Water Flooding in Fractured Reservoirs, Fuel, 2018, 221, 380–392 CrossRef CAS.
- G. Chauveteau, R. Tabary, B. Christel, M. Renard, F. Yujun and A. Omari, In-Depth Permeability Control by Adsorption of Soft Size-Controlled Microgels, in SPE European Formation Damage Conference, May 13–14, Society of Petroleum Engineers, The Hague, Netherlands, 2003, p. 8 Search PubMed.
- Y.-S. Wu and B. Bai, Modeling Particle Gel Propagation in Porous Media, in SPE Annual Technical Conference and Exhibition, September 21–24, Society of Petroleum Engineers, Denver, Colorado, USA, 2008, p. 10 Search PubMed.
- A. Zaitoun, R. Tabary, D. Rousseau, T. R. Pichery, S. Nouyoux, P. Mallo and O. Braun, Using Microgels to Shut Off Water in a Gas Storage Well, in International Symposium on Oilfield Chemistry, February 28 – March 2, Society of Petroleum Engineers, Houston, Texas, U.S.A., 2007, p. 8 Search PubMed.
- D. Rousseau, G. Chauveteau, M. Renard, R. Tabary, A. Zaitoun, P. Mallo, O. Braun and A. Omari, Rheology and Transport in Porous Media of New Water Shutoff/Conformance Control Microgels, in SPE International Symposium on Oilfield Chemistry, February 2–4, Society of Petroleum Engineers, The Woodlands, Texas, 2005, p. 12 Search PubMed.
- H. A. Al-Anazi and M. M. Sharma, Use of a pH Sensitive Polymer for Conformance Control, in International Symposium and Exhibition on Formation Damage Control, February 20–21, Society of Petroleum Engineers, Lafayette, Louisiana, 2002, p. 8 Search PubMed.
- I. P. Benson, L. X. Nghiem, S. L. Bryant and C. Huh, Development and Use of a Simulation Model for Mobility/Conformance Control Using a pH-Sensitive Polymer, in SPE Annual Technical Conference and Exhibition, November 11–14, Society of Petroleum Engineers, Anaheim, California, U.S.A., 2007, p. 10 Search PubMed.
- H. C. Lau, M. Yu and Q. P. Nguyen, Nanotechnology for Oilfield Applications: Challenges and Impact, J. Pet. Sci. Eng., 2017, 157, 1160–1169 CrossRef CAS.
- C. Binns, Introduction to Nanoscience and Nanotechnology, Wiley, New York, NY, 2010 Search PubMed.
- G. Cao, Nanostructures and Nanomaterials - Synthesis, Properties, and Applications, Imperial College Press, London, 2004 Search PubMed.
- B. Binks, Particles as Surfactants—Similarities and Differences, Curr. Opin. Colloid Interface Sci., 2002, 7(1), 21–41 CrossRef CAS.
- R. Aveyard, B. P. Binks and J. H. Clint, Emulsions Stabilised Solely by Colloidal Particles, Adv. Colloid Interface Sci., 2003, 100–102, 503–546 CrossRef CAS.
- T. N. Hunter, E. J. Wanless, G. J. Jameson and R. J. Pugh, Non-Ionic Surfactant Interactions with Hydrophobic Nanoparticles: Impact on Foam Stability, Colloids Surf., A, 2009, 347(1), 81–89 CrossRef CAS.
- T. F. Moghadam and S. Azizian, Effect of ZnO Nanoparticle and Hexadecyltrimethylammonium Bromide on the Dynamic and Equilibrium Oil–Water Interfacial Tension, J. Phys. Chem. B, 2014, 118(6), 1527–1534 CrossRef PubMed.
- F. Ravera, M. Ferrari, L. Liggieri, G. Loglio, E. Santini and A. Zanobini, Liquid–Liquid Interfacial Properties of Mixed Nanoparticle–Surfactant Systems, Colloids Surf., A, 2008, 323(1), 99–108 CrossRef CAS.
- H. Ma, M. Luo and L. L. Dai, Influences of Surfactant and Nanoparticle Assembly on Effective Interfacial Tensions, Phys. Chem. Chem. Phys., 2008, 10(16), 2207–2213 RSC.
- B. Bai, L. Li, Y. Liu, H. Liu, Z. Wang and C. You, Preformed Particle Gel for Conformance Control: Factors Affecting Its Properties and Applications, SPE Reservoir Eval. Eng., 2007, 10(04), 415–422 CrossRef CAS.
- Q. Sang, Y. Li, L. Yu, Z. Li and M. Dong, Enhanced Oil Recovery by Branched-Preformed Particle Gel Injection in Parallel-Sandpack Models, Fuel, 2014, 136, 295–306 CrossRef CAS.
- H. R. Saghafi, Retention Characteristics of Enhanced Preformed Particle Gels (PPGs) in Porous Media: Conformance Control Implications, J. Pet. Sci. Eng., 2018, 166, 962–968 CrossRef CAS.
- A. Goudarzi, A. Almohsin, A. Varavei, P. Taksaudom, S. A. Hosseini, M. Delshad, B. Bai and K. Sepehrnoori, New Laboratory Study and Transport Model Implementation of Microgels for Conformance and Mobility Control Purposes, Fuel, 2017, 192, 158–168 CrossRef CAS.
- A. Clarke, A. Howe, J. Mitchell, J. Staniland and L. Hawkes, How Viscoelastic-Polymer Flooding Enhances Displacement Efficiency, SPE, 2016, 21(3), 675–687 CrossRef CAS.
- S. Lim, H. Zhang, P. Wu, A. Nikolov and D. Wasan, The Dynamic Spreading of Nanofluids on Solid Surfaces – Role of the Nanofilm Structural Disjoining Pressure, J. Colloid Interface Sci., 2016, 470, 22–30 CrossRef CAS.
- D. T. Wasan and A. D. Nikolov, Spreading of Nanofluids on Solids, Nature, 2003, 423(6936), 156–159 CrossRef CAS.
- S. Lim and D. Wasan, Structural Disjoining Pressure Induced Solid Particle Removal from Solid Substrates Using Nanofluids, J. Colloid Interface Sci., 2017, 500, 96–104 CrossRef CAS PubMed.
| This journal is © The Royal Society of Chemistry 2020 |


