 Open Access Article
Discovery and structure characteristics of the intermediate-state conformation of poly(9,9-dioctylfluorene) (PFO) in the dynamic process of conformation transformation and its effects on carrier mobility†
Bin Liu,
Zeming Bai,
Tao Li,
Yang Liu,
Xiaona Li,
Hao Zhang and
Dan Lu *
*
State Key Laboratory of Supramolecular Structure and Materials, College of Chemistry, Jilin University, 2699 Qianjin Avenue, Changchun, 130012, China. E-mail: lud@jlu.edu.cn; Tel: +86 130 8681 2739
First published on 2nd January 2020
Abstract
Good solution processability is a prerequisite for fabricating polymer optoelectronic devices. In this research, a new PFO chain conformation called “intermediate-state conformation” was found through UV-vis absorption spectroscopy, photoluminescence spectroscopy (PL) and Raman spectroscopy in the transition process of α conformation towards β conformation. The intermediate-state conformation not only remedies the defect of film-forming caused by large aggregation of β-conformation but also gains an equivalent carrier mobility similar to that of β conformation. Simultaneously, it was found that the film with the intermediate-state conformation had a smooth surface morphology compared to the film with β-conformation, which indicates that the intermediate-state conformation has good solution processability; thus, it is more suitable for the fabrication of photoelectric films with high carrier mobility. The results of high-resolution transmission electron microscopy (HR-TEM) measurements showed that there were obvious lattice fringes in the films with the intermediate-state conformation and β conformation; this reveals that the intermediate-state conformation has a more planar conformation with extended conjugation length than the β conformation, which is very beneficial to enhance carrier mobility. The research significantly reveals the dynamic evolution of polymer structures based on conjugated polymer physics. The conclusions enrich the understanding of the structure evolution and dynamic process of conjugated polymers and present broad application prospects for photoelectric and other functional devices due to the good film-forming properties of the intermediate-state conformation.
1 Introduction
Poly(9,9-dioctylfluorene) (PFO) has been widely researched as a classical conjugated polymer with deep blue emission,1,2 high photoluminescence (PL) quantum yield,3 good thermal stability, and good processability in common organic solvents.4–6 Moreover, PFO is also an ideal model of a hairy-rod polymer.7–9 PFO solid phase shows polymorphic behaviors, including amorphous phase, β phase, and liquid crystalline semi-crystalline α and α′ phases, in a changing solution environment.10–12 Particularly, the β conformation adopts a more planar conformation, which leads to extended conjugated length; this endows PFO with optoelectric properties such as carrier mobility, PL efficiency, and stability enhancement.13–17 These attractive advantages have been used to obtain efficient amplified spontaneous emission as well as low-threshold lasers.18,19 A larger number of fluorene derivatives have emerged as electroluminescence materials, such as poly(9,9-dioctylfluorene-co-benzothiadiazole) (F8BT) and poly(9,9-dioctylfluorene-co-bithiophene) (F8T2).20–22 All these advantages indicate that PFO is an ideal model conjugated polymer for basic and application research.23–26 β conformation and main chain coplanaration were first proposed by Cadby et al.27 The PFO main chain can coexist with different torsion angles.11,28,29 Essentially, the PFO condensed state structure containing only a fraction of the β conformation is called “doping” of donor–acceptor material systems, which is highly suitable for exploring the process of excitonic energy transfer, excited-state dynamics, microscopic structures and photoelectric performance.14,30 However, all the previous research on PFO mostly focuses on chemical synthesis,31,32 chain aggregation and film morphology so as to increase the β conformation content to fabricate photoelectric devices with high carrier mobility, stability and efficiency.33 However, few studies have been devoted to quantitative research on the PFO β conformation; deeper and more detailed study is crucial to basic and application studies of PFO.34–37 It was found that a relatively low content of PFO β conformation can contribute to ordered aggregation of PFO and thus enhance its carrier mobility. Conversely, a remarkably high content of β conformation will prompt PFO chains to form macroscopic aggregations, which can result in a rough film surface and is unsuitable for device fabrication and device performance optimization.38,39 Therefore, both good film-forming and high carrier mobility performance are key to fabricate excellent polymer photoelectric devices. This research was performed to explore this issue. Here, different PFO chain conformations can be induced by good/poor mixed solvents because poor solvent is also a type of driving force, similar to force, heat, electricity and light, for the PFO chain conformation transition; it can provide energy to change the fluorene–fluorene torsion angle of the PFO main chain. Amazingly, the PFO intermediate-state conformation was found in the transition process of α conformation to β conformation, and its structure characteristics were revealed through the UV-vis spectrum, PL spectrum and Raman spectrum. The film with the intermediate-state conformation presented a lattice fringe image that reflected ordered structure domains, good film-formation properties and high carrier mobility by transmission electron microscope (TEM), high-resolution transmission electron microscope (HR-TEM), atomic force microscope (AFM) and photo-carrier extraction by linearly increasing voltage (photo-CELIV) measurements. Furthermore, the formation mechanism of the intermediate-state conformation was revealed. More details will be discussed below.2 Experimental details
2.1 Material and sample preparation
PFO was purchased from American Dye Source, catalog no. ADS329BE. The weight-average molecular weight (Mw) was 82![[thin space (1/6-em)]](https://www.rsc.org/images/entities/char_2009.gif) 000 g mol−1, and the polydispersity index was 1.36. (Detailed information is provided in the ESI.†) Toluene and ethanol were used as good and poor solvents, respectively. These reagents were purchased from Beijing Chemical Company, China and were all chromatographically pure. Firstly, PFO was dissolved in toluene with stirring at 75 °C and then cooled to room temperature for several minutes; next, different percentages of ethanol (0%, 10% and 20%) were added to PFO to induce β conformation formation, and the final concentrations of the PFO solutions were 10, 12 and 15 mg mL−1, respectively. Finally, the solutions were heated at 55 °C for five hours to achieve uniform dissolution.
000 g mol−1, and the polydispersity index was 1.36. (Detailed information is provided in the ESI.†) Toluene and ethanol were used as good and poor solvents, respectively. These reagents were purchased from Beijing Chemical Company, China and were all chromatographically pure. Firstly, PFO was dissolved in toluene with stirring at 75 °C and then cooled to room temperature for several minutes; next, different percentages of ethanol (0%, 10% and 20%) were added to PFO to induce β conformation formation, and the final concentrations of the PFO solutions were 10, 12 and 15 mg mL−1, respectively. Finally, the solutions were heated at 55 °C for five hours to achieve uniform dissolution.
2.2 Device fabrication
2.3 UV-vis absorption spectrum measurements
Absorption spectra were obtained by a Shimadzu 3000 UV-vis spectrophotometer.2.4 Photoluminescence measurements
PL spectra were acquired using a Shimadzu 5301PC to obtain the chain structure information.2.5 Raman spectra measurements
Raman spectra with JY-T64000 Raman spectrometer, equipped with an argon ion gas laser was used to explore the conformation change, and its excitation wavelength was at 514.5 nm.2.6 Atomic force microscope (AFM) measurements
The film surface morphology and film uniformity were measured by an SII SPA-300 AFM in tapping mode and the test range was 2 × 2 μm.2.7 Transmission electron microscope (TEM) measurements
The transmission electron microscope (TEM) and high-resolution transmission electron microscope (HR-TEM) images were obtained using a JEM-2100F, Japan. The magnified lattice fringes represent the ordered structure domains.2.8 Photo-carrier extraction by linearly increasing voltage (photo-CELIV) measurements
Photo-CELIV measurements were taken with a pulsed laser (Continuum Minilite TMNd:YAG), digital delay generator (Stanford Research Systems DG645) and oscilloscope (Tektronix MSO 4054) in the normal air environment. A laser pulse with a wavelength of 355 nm and pulse width of 10 ns was used. The laser energy reached a maximum of 20 μJ per cm2 per pulse. The compensation voltage Uoff-set was imposed to 0.5 V.3 Results and discussion
3.1 Discovery of the PFO intermediate-state conformation
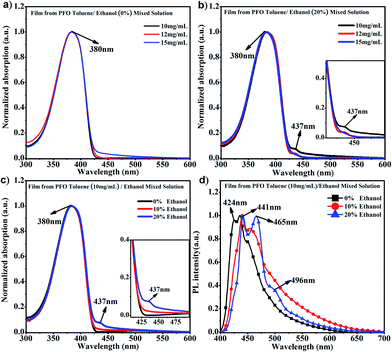
It is known that PFO usually presents a main absorption peak at around 380 nm with α conformation; however, a conformation transition can occur along with the appearance of a new absorption peak at around 437 nm, namely β conformation, when poor solvent is added to PFO solution, ethanol, cyclohexane, 1,8-diiodooctane (DIO), etc.15,40,41 Ethanol is a common poor solvent for PFO, and different percentages of ethanol can induce different contents of β conformation; however, the driving force provided by the low percentage of ethanol is not sufficient to overcome the interchain hindrance to achieve chain conformation transition to β conformation.35 Obviously, it can be found in Fig. 1a that only the α conformation absorption peak and no β conformation characteristic peak (437 nm) appeared in the PFO pure toluene solutions with different concentrations, even though the intensity at 437 nm in pure toluene solution at 15 mg mL−1 was higher than those at 10 mg mL−1 and 12 mg mL−1, where a chain conformation different from α and β conformation was present. However, the characteristic peak (437 nm) obviously appeared in PFO toluene/ethanol (20%) mixed solutions with concentrations of 10 mg mL−1 and 12 mg mL−1 but not 15 mg mL−1 (Fig. 1b); meanwhile, the intensity of the β conformation absorption peak at 437 nm was higher in 10 mg mL−1 mixed solution than in 12 mg mL−1 mixed solution; this indicated that there was a mixture of the α and β conformation, and the content of β conformation was the highest in PFO toluene (10 mg mL−1)/ethanol (20%) mixed solution. As mentioned in our previous work,35 solvent behaves as a driving force; thus, the different percentages of poor solvent (ethanol) provided corresponding limited driving forces, so the limited driving force provided from 20% ethanol could induce the highest content of β conformation in PFO toluene (10 mg mL−1) mixed solution but was not enough to induce β conformation formation in PFO toluene (15 mg mL−1) mixed solution. Hence, we chose the 10 mg mL−1.PFO toluene/ethanol mixed solutions with different percentages of ethanol to explore the transition process of the PFO chain conformation. From Fig. 1c, although the main absorption peak of α conformation appeared at 380 nm, a striking difference between the spectra was observed, namely in the intensity of the β conformation absorption peak at 437 nm. This clearly indicates that there was a mixture of α and β conformations in PFO toluene/ethanol (20%) mixed solution. However, it was unexpectedly found that there was no well-resolved peak at 437 nm in PFO toluene (10 mg mL−1)/ethanol (10%) mixed solution, that is, β conformation did not form; however, the absorption intensity at 437 nm was still higher than that in PFO toluene (10 mg mL−1)/ethanol (0%) mixed solution, where the PFO chains only adopted α conformation. Naturally, we were interested to know the reason for this and to understand the detailed dynamic process of the chain conformation transition between α and β conformation, which is very significant to deeply understand the dynamic process and mechanism of β conformation formation. Hence, photoluminescence (PL) measurements were carried out for PFO toluene solutions (10 mg mL−1) with different percentages of ethanol (Fig. 1d). The characteristic peaks of the PFO chain with the “isolated” chromophore (α conformation) in the PL spectrum are at 417 (strong, 0–0 band), 447 (moderate, 0–1 band), and 470 nm (weak, 0–2 band), and those of β conformation are at 442 (strong, 0–0 band), 465 (moderate, 0–1 band), and 495 nm (weak, 0–2 band). The β conformation emission peak at around 496 nm corresponds to the S1 → S0 0–2 vibronic transition. It is well known that a planar chain conformation with extended effective conjugated length can induce red-shifts in PL spectra. Therefore, the PFO β conformation produces the 0–0 emission peak change and red-shift to 441 nm,17 and the intensity of the peak at 424 nm (0–0 emission peak of α conformation) decreases obviously with increasing β conformation content; that is, the 0–0 emission changes from 426 nm (2.91 eV) to 441 nm (2.81 eV), which reflects energy transfer from α conformation to β conformation.27,42–45 Therefore, Fig. 1d presents the transition process from α to β conformation in detail: the peak intensity at 424 nm decreased gradually with increasing ethanol percentage until the peak disappeared in PFO mixed solution with toluene (10 mg mL−1)/ethanol (20%). It is worth noting that the positions of the emission peaks in PFO mixed solution with toluene (10 mg mL−1)/ethanol (10%) were between the characteristic peaks of α conformation (solution without ethanol) and β conformation (solution with 20% ethanol), and a red-shift emission vibrionic peak was observed from 450 nm to 465 nm; this indicates that the planarity of the chain geometry and the mean extended π conjugation length were also between the α conformation and β conformation.42–45 Therefore, it can be inferred that there is an “intermediate-state conformation” between α and β conformation. The dynamic process of the PFO chain conformation transition was shown in Fig. 2. To further prove the inference, the following research was performed.
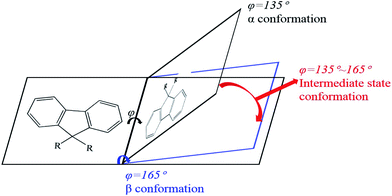 | ||
| Fig. 2 Schematic of the structural changes of PFO during the process of the conformation transition from α to β conformation. | ||
3.2 Structure characteristics of the PFO intermediate-state conformation
To further explore the structure characteristics of the intermediate-state conformation, we used Raman spectroscopy to investigate the vibration modes of the different PFO chain conformations because of its high sensitivity to the chain conformation changes, polarizability of supramolecular microstructures and intermolecular interactions. Specifically, Raman spectroscopy was also used to track the process of β -conformation formation.28,46–49 Raman spectroscopy usually involves two types of main light bands: one of them is in the low wavenumber region (100 to 1000 cm−1), as shown in Fig. 3, which corresponds to the PFO alkyl side-chain motion, and the other is in the high wavenumber region (1000 to 1650 cm−1), as shown in Fig. 4, which corresponds to the fluorene unit motion in the main chain. First, according to the literature,46 in the low-wavenumber region, the relative ratio of the peak intensities at around 633 cm−1 (I633 cm−1) and 620 cm−1 (I620 cm−1) can track the β conformation formation, and we defined this ratio as I633 cm−1/I620 cm−1. Especially, the appearance of a peak at 633 cm−1 (I633 cm−1) is the prerequisite of β-conformation formation, and its intensity also increases with increasing β conformation content, but the peak intensity at 900 cm−1 (I900 cm−1) decreases with increasing β conformation content; finally, it disappears, and the peak at 890 cm−1 becomes one predominant peak, which indicates that the relative ratio of the peak intensities at around 890 cm−1 (I890 cm−1) and 900 cm−1 (I900 cm−1) is sensitive to changes in the β conformation content and chain polarizability. Fig. 3 shows all the variations of the characteristic peaks in the chain conformation transition process in the low frequency region, and the detailed results are summarized in Tables 1 and 2. From Table 1, it can be clearly seen that I620 cm−1 and I633 cm−1 increased, respectively, with the ethanol percentage, and I633 cm−1/I620 cm−1 also increased with increasing ethanol percentage. Especially, it was found that although there was no β conformation in the film obtained from the 10% ethanol mixed solution, as shown in Fig. 1c, I633 cm−1 was also higher than the intensity of α conformation in the film obtained from pure toluene solution, and I633 cm−1/I620 cm−1 was almost equal to the film obtained from 20% ethanol mixed solution, in which the β conformation formed. This manifests that there is an intermediate-state conformation between α and β conformation. From Table 2, it can also be found that I890 cm−1 was always higher than I900 cm−1, and I900 cm−1 decreased with the ethanol percentage. This phenomenon also indicates that the PFO main chain conformation in the film obtained from the PFO toluene solution (10 mg mL−1) with 10% ethanol was obviously different from the α and β conformations; therefore, we inferred it to be an intermediate-state conformation. Here, we can conclude that the changes in the alkyl side-chain motion led the PFO chain conformation to transition towards β conformation, and the PFO intermediate-state conformation can be formed in the dynamic evolution process between α and β conformation.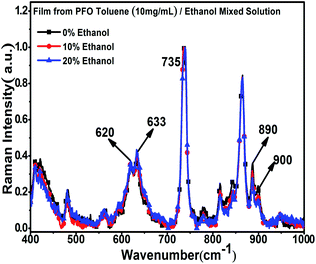 | ||
| Fig. 3 Raman spectra of the PFO films in the low wave number region with different ethanol contents. All concentrations of the PFO precursor toluene solutions were 10 mg mL−1. | ||
| Sample (10 mg mL−1) | I633 cm−1 | I620 cm−1 | I633 cm−1/I620 cm−1 |
|---|---|---|---|
| a The concentrations of all the PFO precursor toluene solutions were 10 mg mL−1. | |||
| Ethanol 0% | 0.38 | 0.34 | 1.12 |
| Ethanol 10% | 0.42 | 0.36 | 1.17 |
| Ethanol 20% | 0.43 | 0.37 | 1.16 |
| Sample (10 mg mL−1) | I890 cm−1 | I900 cm−1 | I890 cm−1/I900 cm−1 |
|---|---|---|---|
| a The concentrations of all the PFO precursor toluene solutions were 10 mg mL−1. | |||
| Ethanol 0% | 0.36 | 0.23 | 1.57 |
| Ethanol 10% | 0.30 | 0.18 | 1.67 |
| Ethanol 20% | 0.27 | 0.15 | 1.80 |
Second, the Raman spectra in the high-wavenumber region corresponded to the changes in the PFO main chain, as shown in Fig. 4a. It can obviously be inferred from Fig. 4b and c that there should be an intermediate-state chain conformation in the PFO toluene (10 mg mL−1)/ethanol (10%) mixed solution. The peak intensity in the range from 1100 cm−1 to 1400 cm−1 increased overall, as shown in Fig. 4b, which corresponds to the PFO main chain transition towards the chain geometry with more planarity;46 the enhancement of the peak intensity was attributed to C–C stretching modes between the phenylene rings and C–H in-plane bending modes.17,46–49
Although the β conformation did not form in the film obtained from the PFO toluene solution (10 mg mL−1) with 10% ethanol, changes in the main chain conformation still occurred because the peak intensity from 1100 cm−1 to 1400 cm−1 increased compared to that of α conformation in the film obtained from the PFO toluene solution (10 mg mL−1) with 0% ethanol, as shown in Fig. 4c. More importantly, the intensity of the peak at 1257 cm−1 was highly sensitive to the planarity of the PFO main chain, and its enhancement again proved that the chain geometry had transformed to be more planar. In addition, the soft shift to a shorter wavenumber of the peak at around 1604 cm−1, which represents C![[double bond, length as m-dash]](https://www.rsc.org/images/entities/char_e001.gif) C stretching motions, indicates a more planar chain conformation, as shown in Fig. 4d and e.17,46–49 These results all indicate that the PFO intermediate-state chain conformation was formed between α and β conformation and that the PFO intermediate-state conformation is more planar than the α conformation.
C stretching motions, indicates a more planar chain conformation, as shown in Fig. 4d and e.17,46–49 These results all indicate that the PFO intermediate-state chain conformation was formed between α and β conformation and that the PFO intermediate-state conformation is more planar than the α conformation.
3.3 Effects of the PFO chain conformation changes on the film morphology
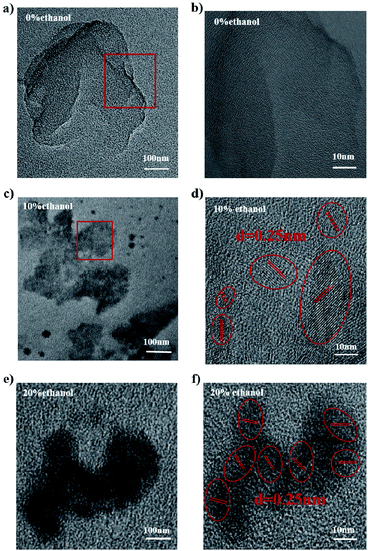
From the results of all the above spectra, it can be seen that there was indeed an intermediate-state conformation with increasing π conjugation length and chain planarity in the transition process of the transformation of α conformation into β conformation. It is well known that the chain conformation can dramatically affect the chain condensed state structure, and the condensed state structure directly impacts the film morphology. To reveal the differences in the morphologies of the films derived from the intermediate-state conformation, transmission electron microscope (TEM), high-resolution transmission electron microscope (HR-TEM) and atomic force microscope (AFM) measurements were carried out. It is well known that the formation of ordered structures is accompanied by the appearance of lattice fringes.50In Fig. 5, it can be found that there were obvious lattice fringes in the films obtained from PFO toluene (10 mg mL−1)/ethanol mixed solutions with 10% ethanol (containing the intermediate-state conformation) and 20% ethanol (containing β conformation), and the spaces between the lattice fringes were the same (about 0.25 nm); hence, ordered structures could be formed by the self-assembly of PFO chains adopting the intermediate-state conformation and β conformation. According to the above spectral results, these PFO chains in both the intermediate-state conformation and β conformation all had more extended conjugated lengths and high chain planarity, which can contribute to enhanced optoelectronic properties and improve the performance of devices. Therefore, the two different chain conformations, i.e., intermediate-state conformation and β conformation, can both impel PFO chains to form more ordered condensed structures with lattice fringes, as shown in Fig. 5d and f.
As is known, thin films used for photo-electron devices not only need ordered chain packing as the channels of the carrier transportation but also require smooth surfaces in order to decrease the interface obstacles between the electrodes.34
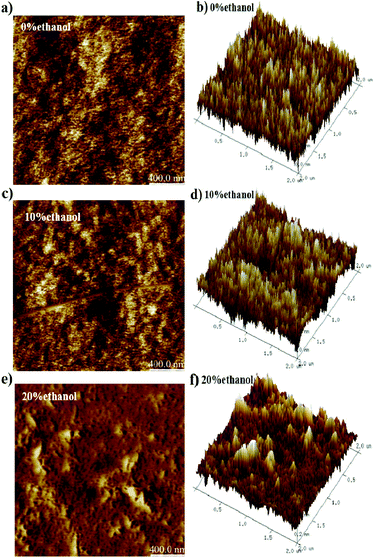
Therefore, to explore the film surface morphologies, AFM measurements were carried out (Fig. 6). It was found that the surface morphologies of the films obtained from PFO toluene (10 mg mL−1)/ethanol mixed solutions with 0% ethanol (containing α conformation) and 10% ethanol (containing intermediate-state conformation) were smoother than that obtained from 20% ethanol (containing β-conformation). The root-mean-square (RMS) analysis (in Table 3) and the 3D height images (Fig. 6b, d and f) showed the same results; this indicates that a uniform film surface morphology was obtained in the films with 0% ethanol (containing α conformation) and 10% ethanol (containing intermediate-state conformation). In general, a very rough surface morphology is unsuitable for photo-electron device fabrication. According to the TEM and AFM images, it was found that the film with intermediate-state conformation contained not only an ordered condensed state structure but also a smooth film surface; this reflects that the film with intermediate-state conformation was more soluble than that with β conformation. In conclusion, the film with the intermediate-state conformation was the most suitable for photoelectric film fabrication.
| Sample (10 mg mL−1) | RMS (nm) | Rmax (nm) |
|---|---|---|
| a The concentrations of all the PFO precursor toluene solutions were 10 mg mL−1. | ||
| Ethanol 0% | 0.33 | 2.79 |
| Ethanol 10% | 0.35 | 3.07 |
| Ethanol 20% | 0.95 | 10.50 |
3.4 Effects of the intermediate-state conformation on the carrier mobility and the charge density
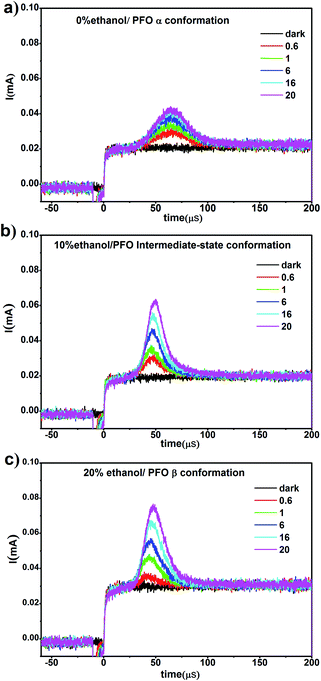
In our previous work,34 it was found that the carrier mobility could increase by an order of magnitude and the charge density could also increase due to the emergence of the β conformation. However, in this work, β conformation did not emerge in the film prepared from PFO toluene (10 mg mL−1)/ethanol mixed solution with 10% ethanol; however, a new PFO conformation called the “intermediate-state conformation” emerged, and the film-forming properties were very well suited to device fabrication requirements according to the above results. In order to reveal the effects of the intermediate-state conformation on the device performance, the carrier mobility and charge density were investigated, as shown in Fig. 7.From Fig. 7, it can be seen that although the charge density increased in all three films, the charge density of the film with the intermediate-state conformation was almost equivalent to that of the film with β conformation. In Fig. 8, it can also be found that the hole mobility (μ) in the film with β conformation was 4.0 × 10⁻⁶ cm2 V−1 s−1 and that in the film with the intermediate-state conformation was 2.3 × 10⁻⁶ cm2 V−1 s−1. Obviously, they were of the same order of magnitude, and they were higher than that in the film with α conformation in which the hole mobility (μ) was only 7.9 × 10⁻⁷ cm2 V−1 s−1. Hence, it is not difficult to observe that the hole mobilities of the films with the intermediate-state conformation and β conformation were all enhanced by an order of magnitude compared to that of the film with α conformation. In conclusion, the PFO intermediate-state conformation not only contributed to the increase of charge density and hole mobility but also afforded good film-forming properties with smooth surface morphologies compared with β conformation. It is well known that the carrier mobility and device efficiency can be enhanced by increasing the content of PFO β conformation.14,15 However, when the content of β conformation continually increases, the film-forming properties contrastingly decrease because the increase of the polymer chain aggregation size thus leads to a film with high surface roughness. As a result, the applications of PFO are limited. However, the discovery of the intermediate-state conformation has completely overcome this limit.
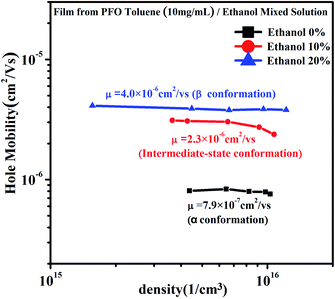 | ||
| Fig. 8 The hole mobility and charge density curves of the films obtained from PFO toluene (10 mg mL−1)/ethanol mixed solutions with different ethanol ratios of 0%, 10% and 20%, respectively. | ||
4 Conclusions
An intermediate-state conformation indeed exists in the transition process of the transformation from α conformation to β conformation, as confirmed by UV-absorption, PL and Raman spectroscopy. Uniform film morphologies and ordered structure domains could be induced by the self-assembly of PFO chains in the intermediate-state conformation, which concomitantly enhanced the hole mobility. The discovery of the intermediate-state conformation has completely overcome the limit of decreasing film-forming properties because of the increase of β-conformation content; this increased the aggregation size of the polymer chains, leading to high surface roughness. This research demonstrates that the intermediate-state conformation is advantageous not only to the formation of films with smooth surface morphologies but also to the enhancement of charge density and hole mobility due to the ordered condensed state structure formation. The enhanced carrier mobility was almost equivalent to that of the device containing β conformation. Relative to the film with β conformation, the films containing the intermediate-state conformation have broad application prospects because of its good film-formation properties and photo-electrical performance. We presume that if all the chain segments are controlled as much as possible to adopt the intermediate-state conformation, enhancement of the photoelectric efficiency and wider applications can be greatly expected.Conflicts of interest
There are no conflicts to declare.Acknowledgements
This work is supported by grants from the National Natural Science Foundation of China (21574053 and 91333103).Notes and references
- J. Jacob, J. Zhang, A. C. Grimsdale, K. Mllen, M. Gaal and E. J. W. List, Macromolecules, 2003, 36, 8240–8245 CrossRef CAS.
- X. Zhang, Z. Lei, Q. Hu, J. Lin, Y. Chen, L. Xie, W. Lai and W. Huang, Appl. Phys. Express, 2014, 7, 101601 CrossRef.
- C.-F. Shu, R. Dodda, F.-I. Wu, M. S. Liu and A. K.-Y. Jen, Macromolecules, 2003, 36, 6698–6703 CrossRef CAS.
- M. Grell, D. D. C. Bradley, M. Inbasekaran and E. P. Woo, Adv. Mater., 1997, 9, 798–802 CrossRef CAS.
- M. Redecker, D. D. C. Bradley, M. Inbasekaran and E. P. Woo, Appl. Phys. Lett., 1999, 74, 1400–1402 CrossRef CAS.
- Y. Boon Kar, X. Ruidong, C. Q. Mariano, P. N. Stavrinou and D. D. C. Bradley, Nat. Mater., 2008, 7, 376–380 CrossRef PubMed.
- R. Stepanyan, A. Subbotin, M. Knaapila, O. Ikkala and G. ten Brinke, Macromolecules, 2003, 36, 3758–3763 CrossRef CAS.
- M. Brinkmann, N. Charoenthai, R. Traiphol, P. Piyakulawat, J. Wlosnewski and U. Asawapirom, Macromolecules, 2009, 42, 8298–8306 CrossRef CAS.
- M. Knaapila and M. J. Winokur, Adv. Polym. Sci., 2008, 212, 227–272 CAS.
- S. H. Chen, A. C. Su and S. A. Chen, J. Phys. Chem. B, 2005, 109, 10067–10072 CrossRef CAS.
- S. H. Chen, A. C. Su, C. H. Su and S. A. Chen, Macromolecules, 2005, 38, 379–385 CrossRef CAS.
- A. Perevedentsev, S. Aksel, K. Feldman, P. Smith, P. N. Stavrinou and D. D. C. Bradley, J. Polym. Sci., Part B: Polym. Phys., 2015, 53, 22–38 CrossRef CAS.
- P. Prins, F. C. Grozema, B. S. Nehls, T. Farrell, U. Scherf and L. D. A. Siebbeles, Phys. Rev. B: Condens. Matter Mater. Phys., 2006, 74, 113203 CrossRef.
- H.-H. Lu, C.-Y. Liu, C.-H. Chang and S.-A. Chen, Adv. Mater., 2007, 19, 2574–2579 CrossRef CAS.
- J. Peet, E. Brocker, Y. Xu and G. C. Bazan, Adv. Mater., 2008, 20, 1882–1885 CrossRef CAS.
- X. Zhang, Q. Hu, J. Lin, Z. Lei, X. Guo, L. Xie, W. Lai and W. Huang, Appl. Phys. Lett., 2013, 103, 153301 CrossRef.
- T.-H. Jen, K.-K. Wang and S.-A. Chen, Polymer, 2012, 53, 5850–5855 CrossRef CAS.
- C. Rothe, F. Galbrecht, U. Scherf and A. Monkman, Adv. Mater., 2006, 18, 2137–2140 CrossRef CAS.
- A. J. C. Kuehne, M. Kaiser, A. R. Mackintosh, B. H. Wallike- witz, D. Hertel, R. A. Pethrick and K. Meerholz, Adv. Funct. Mater., 2011, 21, 2564–2570 CrossRef CAS.
- A. J. Campbell, D. D. C. Bradley, H. Antoniadis, M. Inbasekaran, W. W. Wu and E. P. Woo, Appl. Phys. Lett., 2000, 76, 1734–1736 CrossRef CAS.
- R. Xia, G. Heliotis and D. D. C. Bradley, Appl. Phys. Lett., 2003, 82, 3599–3601 CrossRef CAS.
- P. A. Levermore, R. Jin, X. Wang, J. C. de Mello and D. D. C. Bradley, Adv. Funct. Mater., 2009, 19, 950–957 CrossRef CAS.
- Y. Yang, G. A. Turnbull and I. D. W. Samuel, Appl. Phys. Lett., 2008, 92, 163306 CrossRef.
- Y. Yang, G. A. Turnbull and I. D. W. Samuel, Adv. Funct. Mater., 2010, 20, 2093–2097 CrossRef CAS.
- M. Anni and R. Rella, J. Phys. Chem. B, 2010, 114, 1559–1561 CrossRef CAS PubMed.
- D. Nassyrov, C. Mller, A. Roig, I. Burgus-Ceballos, J. Oriol Oss, D. B. Amabilino, M. Garriga, M. Isabel Alonso, A. R. Goni and M. Campoy-Quiles, J. Mater. Chem., 2012, 22, 4519–4526 RSC.
- A. J. Cadby, P. A. Lane, H. Mellor, S. J. Martin, M. Grell, C. Giebeler, D. D. C. Bradley, M. Wohlgenannt, C. An and Z. V. Vardeny, Phys. Rev. B: Condens. Matter Mater. Phys., 2000, 62, 15604–15609 CrossRef CAS.
- M. Arif, C. Volz and S. Guha, Phys. Rev. Lett., 2006, 96, 025503 CrossRef CAS PubMed.
- M. Ariu, D. G. Lidzey, M. Sims, A. J. Cadby, P. A. Lane and D. D. C. Bradley, J. Phys.: Condens. Matter, 2002, 14, 9975–9986 CrossRef CAS.
- J.-H. Kim, S. Wood, J. B. Park, J. Wade, M. Song, S. C. Yoon, I. H. Jung, J.-S. Kim and D.-H. Hwang, Adv. Funct. Mater., 2016, 26, 1517–1525 CrossRef CAS.
- B. Tanto, S. Guha, C. M. Martin, U. Scherf and M. J. Winokur, Macromolecules, 2004, 37, 9438–9448 CrossRef CAS.
- M. Knaapila and A. P. Monkman, Adv. Mater., 2013, 25, 1090–1108 CrossRef CAS PubMed.
- L. Huang, X. Huang, G. Sun, C. Gu, D. Lu and Y. Ma, J. Phys. Chem. C, 2012, 116, 7993–7999 CrossRef CAS.
- Z. Bai, Y. Liu, T. Li, X. Li, B. Liu, B. Liu and D. Lu, J. Phys. Chem. C, 2016, 120, 27820–27828 CrossRef CAS.
- B. Liu, L. Tao, Z. Hao, T. Ma, J. Ren, L. Bo, B. Liu, J. Lin, M. Yu and L. Xie, J. Phys. Chem. C, 2018, 122, 14814–14826 CrossRef CAS.
- T. Li, L. Huang, Z. Bai, X. Li, B. Liu and D. Lu, Polymer, 2016, 88, 71–78 CrossRef CAS.
- M. Knaapila, F. B. Dias, V. M. Garamus, L. Almsy, M. Torkkeli, K. Leppanen, F. Galbrecht, E. Preis, H. D. Burrows, U. Scherf and A. P. Monkman, Macromolecules, 2007, 40, 9398–9405 CrossRef CAS.
- C.-Y. Chen, C.-S. Chang, S.-W. Huang, J.-H. Chen, H.-L. Chen, C.-I. Su and S.-A. Chen, Macromolecules, 2010, 43, 4346–4354 CrossRef CAS.
- J. Liang, L. Yu, S. Zhao, L. Ying, F. Liu, W. Yang, J. Peng and Y. Cao, Nanotechnology, 2016, 27, 284001 CrossRef PubMed.
- J. Peet, E. Brocker, Y. Xu and G. C. Bazan, Adv. Mater., 2008, 20, 1882–1885 CrossRef CAS.
- Y.-D. Liu, Q. Zhang, X.-H. Yu, J.-G. Liu and Y.-C. Han, Chin. J. Polym. Sci., 2019, 37, 664–673 CrossRef CAS.
- U. Scherf and E. List, Adv. Mater., 2002, 14, 477–487 CrossRef CAS.
- M.-N. Yu, H. Soleimaninejad, J.-Y. Lin, Z.-Y. Zuo, B. Liu, Y.-F. Bo, L.-B. Bai, Y.-M. Han, T. A. Smith, M. Xu, X.-P. Wu, D. E. Dunstan, R.-D. Xia, L.-H. Xie, D. D. C. Bradley and W. Huang, J. Phys. Chem. Lett., 2018, 9, 364–372 CrossRef CAS PubMed.
- Z.-Q. Lin, N.-E. Shi, Y.-B. Li, D. Qiu, L. Zhang, J.-Y. Lin, J.-F. Zhao, C. Wang, L.-H. Xie and W. Huang, J. Phys. Chem. C, 2011, 115, 4418–4424 CrossRef CAS.
- J.-Y. Lin, W.-S. Zhu, F. Liu, L.-H. Xie, L. Zhang, R. Xia, G.-C. Xing and W. Huang, Macromolecules, 2014, 47, 1001–1007 CrossRef CAS.
- C. Volz, M. Arif and S. Guha, J. Chem. Phys., 2007, 126, 064905 CrossRef CAS PubMed.
- M. Ariu, D. Lidzey and D. Bradley, Synth. Met., 2000, 111–112, 607–610 CrossRef CAS.
- M. Ariu, D. Lidzey, M. Lavrentiev, D. Bradley, M. Jandke and P. Strohriegl, Synth. Met., 2001, 116, 217–221 CrossRef CAS.
- A. L. T. Khan, P. Sreearunothai, L. M. Herz, M. J. Banach and A. Khler, Phys. Rev. B: Condens. Matter Mater. Phys., 2004, 69, 085201 CrossRef.
- J. Ren, X. Li, T. Ma, B. Liu, H. Zhang, T. Li and D. Lu, ACS Appl. Mater. Interfaces, 2018, 10, 28093–28102 CrossRef CAS PubMed.
Footnote |
| † Electronic supplementary information (ESI) available. See DOI: 10.1039/c9ra07115f |
| This journal is © The Royal Society of Chemistry 2020 |

