 Open Access Article
Biomass-derived three-dimensional carbon framework for a flexible fibrous supercapacitor and its application as a wearable smart textile†
Chunghsuan Hsiao ,
Chiyoung Lee and
Nyanhwa Tai
 *
*
Department of Materials Science and Engineering, National Tsing Hua University, No. 101, Sec. 2 Kuang-Fu Rd., Hsinchu, 30013, Taiwan, Republic of China. E-mail: nhtai@mx.nthu.edu.tw; Tel: +886-3-5715131 ext. 31026
First published on 17th February 2020
Abstract
High electrochemical performance and mechanical reliability are two important properties of the flexible fibrous supercapacitors (FFSCs) used in portable and wearable electronics. Herein, we introduce high-performance and stable FFSCs produced using Tetrapanax papyrifer with a honeycomb-like structure (the key material) acting as a frame for an activated carbon (AC) coating. The honeycomb-like structure facilitates penetration of electrolytes and electron transport in the AC particles. This reduces the contact resistance between the AC and current collector, thereby enhancing the electrochemical energy storage. The FFSCs possess long length and area specific capacitances of 20.8 mF cm−1 and 83.9 mF cm−2, respectively. In addition, the fabricated FFSCs display a maximum length (area) energy density of 3.98 μW h cm−1 (16.1 μW h cm−2) at a power density of 0.07 mW cm−1 (1.99 mW cm−2) and attain an excellent capacitance retention of 91% over 10![[thin space (1/6-em)]](https://www.rsc.org/images/entities/char_2009.gif) 000 cycles. Moreover, the supercapacitors exhibit excellent mechanical flexibility with minor increase in capacitance upon bending. Three flexible fibrous supercapacitors in series power a red light-emitting diode, demonstrating the potential application of the flexible fibrous supercapacitors in smart textiles.
000 cycles. Moreover, the supercapacitors exhibit excellent mechanical flexibility with minor increase in capacitance upon bending. Three flexible fibrous supercapacitors in series power a red light-emitting diode, demonstrating the potential application of the flexible fibrous supercapacitors in smart textiles.
1. Introduction
Studies on miniaturized and flexible electronic devices including artificial skin, smart textiles, and flexible/wearable electronics are increasingly emerging because of the urgent demand for next-generation high-performance electronic devices.1,2 Thus, the study of flexible fibrous supercapacitors (FFSCs) is attracting much attention. Fibrous supercapacitors usually range from micrometers to millimeters in diameter, with their small size and light weight making them suitable for many innovative applications.3,4FFSCs include active materials like carbon materials, metal oxides, conductive polymers, and MXene, and fiber current collectors such as metal wire, graphene fibers, carbon nanotube (CNT) yarn, and carbon fiber bundles (CFBs).5–14 In a recently published article, Z. Wang et al., reported the fabrication of flexible yarn electrodes by biscrolling MXene with CNT yarns. Because of adopting the biscrolling process, a high MXene loading of ≈98 wt% was reported. MXene, with the general formula of Mn + 1XnTx, composed of a transition metal (M), carbon and/or nitrogen (X) and surface termination groups (T), was used in their study and the electrode with high MXene loading and high conductivity of CNT yarn performs an extremely high linear capacitance of 118 mF cm−1. In our work, all-carbon electrode was prepared and a high linear capacitance of 97.81 mF cm−1 is achieved owing to the synergistic effect of the 3D carbon framework of the carbonized TC paper and the high specific surface area of the AC. In addition, carbon fibers with low density, excellent conductivity, and good mechanical properties are promising as the ESI† for FFSCs.
Compared with metal oxides, active carbon materials including AC, onion-like carbon, carbide-derived carbon, CNTs, and graphene sheets are frequently utilized in FFSCs. This is because of their high specific surface area, electrical conductivity, high rate capability, and excellent cycling stability. The properties of the carbon materials facilitate their application in devices requiring reversible ion adsorption/desorption during operation.
Most novel carbon materials are expensive, and their fabrication is environmentally unfriendly. In contrast, AC is widely used in supercapacitors, and it is available for massive and economic production. Harrison et al. fabricated a coaxial single wire supercapacitor with length and area specific capacitances of 0.1 mF cm−1 and 3.18 mF cm−2,15 respectively. However, the nonuniform dispersion of AC causes the supercapacitor to exhibit low efficiency. This is further explained by the low charge transfer rate from the AC to the current collectors, producing a significant decrease in efficiency of the electrical double layer capacitor (EDLC).
A possible solution to problems arising is the combination of the AC with wearable/knittable conductive fibers to maintain good capacitive energy storage properties. However, there are only few reports in order to address these problems. Published studies on FFSCs focus on the development of materials with high specific surface area.
Generally, most of the amorphous carbon which derived from natural sources are grinded into powder, therefore, it may lose its three-dimensional (3D) framework structure. The Tetrapanax papyrifer (Tong Cao, TC) pith can be easy cut into paper, therefore, the grinding is not required for the fabrication of electrodes, as a result, it can retain its 3D structures.
The aim of this research is to maintain the 3D framework structures of plant while preparing the electrodes, therefore, the electrolyte can more easily infiltrate to the electrode, thereby improving the energy storage efficiency.
Herein, we propose a novel method to fabricate low-cost, high-performance, and flexible textile FFSCs by utilizing CFBs as the current collector and carbonized TC paper possessing a 3D carbon framework coated with commercial AC as the activated material. The 3D carbon framework provides interconnected pathways for electron transfer and enhances the ion transfer capability.16 More importantly, the AC can be distributed uniformly on the framework through the proposed method.
The excellent mechanical properties and electrical conductivity of CFBs, in conjunction with the good electrical conductivity of the carbonized TC and the high surface area of the AC resulted in exceptional electrochemical properties of FFSCs. The properties include a high specific capacitance (20.8 mF cm−1 or 83.9 mF cm−2), a high energy density (3.98 μW h cm−1 or 16.1 μW h cm−2), and a power density of up to 0.07 mW cm−1 (or 1.99 mW cm−2) at a current of 0.1 A g−1. The fabricated FFSCs also exhibit long life stability, retaining a specific capacitance of 91% after 10![[thin space (1/6-em)]](https://www.rsc.org/images/entities/char_2009.gif) 000 test cycles.
000 test cycles.
2. Materials and fabrication method
2.1 Preparation of TC pith paper and TC powders
TC pith paper was prepared by cutting pith from the stalk of the TC plant into long strips ∼200 μm thick with an area of 3 × 150 mm2. TC powders (TCp) were then obtained by grinding the carbonized TC pith into powders.2.2 Synthesis of the activated carbon slurry and tong cao powders slurry
Polyvinylidene fluoride (PVDF, 0.8 g) was dissolved in 40 mL of N-methyl-2-pyrrolidone; subsequently, 2.4 g of AC (or TCp) and 0.8 g of XC-72 carbon black were added to the solution and mixed by magnetic stirring for an hour.2.3 Electrode preparation
The starting materials for the electrode comprised TC pith paper, CFB, TCp, and AC slurry, and the fabrications of TC pith paper, TC-CFB, and AC-TC-CFB are schematically shown in Fig. 1. Conversely, a long CFB containing 3000 fibers in a bundle was cut into pieces ∼60 mm long. The TC pith paper was dipped into a molasses solution (0.4 g mL−1) and then wrapped around the CFB, followed by drying at 80 °C in an oven for 10 min. The molasses solution acted as the carbon precursor and the binder between the CFB and the TC. Subsequently, the CFB wrapped by the TC paper containing the molasses solution was placed in a tube furnace. This was then carbonized in Ar (1000 sccm) at 700 °C, 800 °C, and 900 °C using a heating rate of 20 °C min−1, and held isothermally at the designed temperature for 1 h at 1 atm; the electrodes carbonized at 700 °C, 800 °C, and 900 °C were designated as TC700-CFB, TC800-CFB, and TC900-CFB, respectively.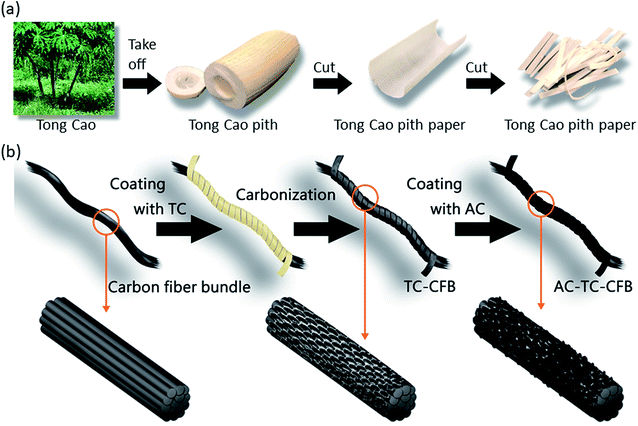 | ||
| Fig. 1 Schematic diagram illustrating the preparation of (a) TC pith paper and (b) TC-CFB and AC-TC-CFB. | ||
The CFB and the TC800-CFB were dipped separately into an AC slurry while another CFB was dipped into a TCp slurry, and all the specimens were dried overnight in an oven at 120 °C. The fabricated electrodes were designated as AC-CFB, AC-TC800-CFB, and TCp-CFB, respectively.
2.4 FFSC fabrication
The gel electrolyte was prepared by dissolving 3 g of polyvinyl alcohol (PVA) in a solution containing 3 g of H3PO4 (85 wt%) and 30 mL of deionized water and stirring at 80 °C until the solution was clear. Two AC-TC800-CFB electrodes were separately coated with a gel electrolyte (PVA–H3PO4) via a dip-coating process and wrapped with a nonwoven polyester fabric acting as a spacer. The two electrodes with electrolyte were interlaced and inserted into a heat-shrinkable tube that was subsequently subjected to hot air; consequently, the tube diameter was reduced to host the two electrodes.2.5 Characterizations and instrumentation
The morphologies of the AC, CFB, and TC samples were studied using a field emission scanning electron microscope (SEM, JEOL JSM-6500F). A Raman spectrometer (Horiba HR800 UV) and an X-ray diffractometer (XRD, Shimadzu XRD 6000) were used to analyze the microstructures. The surface chemistry of the TC samples was examined by an X-ray photoelectron spectrometer (XPS, Ulvac-PHI PHI 1600). A Brunauer–Emmett–Teller analyzer (BET, Micromeritics TriStar II Series2) was applied to measure the pore size distribution. Cyclic voltammetry (CV), electrochemical impedance spectroscopy (EIS), and galvanostatic charge–discharge (GCD) were performed by a potentiostat/galvanostat system (Metrohm/Eco Chemie PGSTAT30) to assess the electrochemical performance of the electrodes and the FFSCs.3. Results and discussion
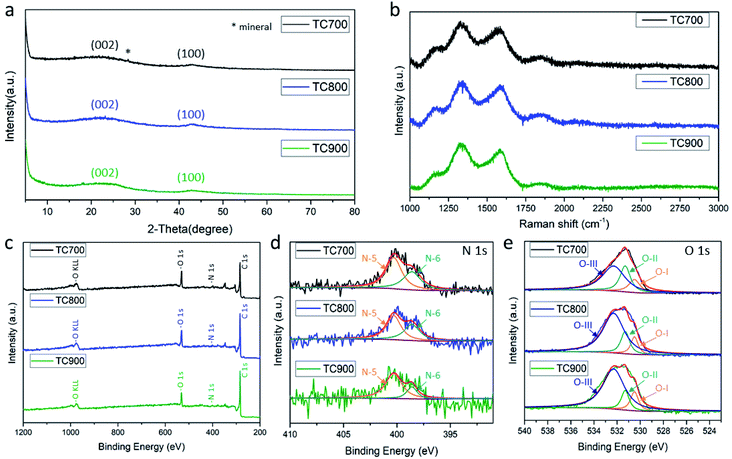
The color of the TC pith paper changed from white to black after heating at elevated temperatures, highlighting carbonization. The XRD patterns display two broad diffuse bands centered around 2θ = 23° and 43° (Fig. 2a) that are associated with crystalline diffraction of the (002) and the (100) planes of graphite, respectively. This suggests that the TC pith paper possesses a low-degree graphitic crystal structure, with the star symbol representing a mineral from the TC plant.Further analyses of the microstructures of the TC pith paper-derived carbon were conducted using Raman spectroscopy (Fig. 2b). The Raman spectra of the TC700, TC800, and TC900 samples exhibit typical peaks at 1330 cm−1 and 1580 cm−1, assigned as the D band and G band, respectively. The D band is in reference to the disordered structure of graphite (sp3 type), whereas the G band is attributed to C–C bond stretching of the prefect graphitic structure (sp2 type). The ID/IG ratio represents the degree of graphitization; a low ratio indicates a better graphitic microstructure for the carbon material. As the carbonization temperature increases, the carbon material shows higher degree of graphitization, as demonstrated by ID/IG ratios of 1.18, 1.13, and 1.11 for TC700, TC800, and TC900 samples, respectively.
The full-range XPS spectra of TC700, TC800, and TC900 for O 1s and N 1s are shown in Fig. 2c, with the peaks attributed to functional groups of the carbonized molasses. The high-resolution N 1s spectrum depicted in Fig. 2d shows peaks at 400.3 and 398.6 eV, corresponding to N-5 and N-6, respectively.10 All samples presenting peaks at 530.5, 531.3, and 532.3 eV for the O 1s spectra corresponding to O-I (quinone), O-II (phenol/ether), and O-III (carboxylic groups/water), respectively, are shown in Fig. 2e. Among the carbon materials, the TC700 shows the highest nitrogen and oxygen contents of 2.13% and 15.71 at%, respectively (Table 1). Nevertheless, TC700 was not adopted as the primary sample for investigation in this work because its high electric resistivity may negatively impact capacitance.
| Sample | Atomic concentration (at%) | Resistance (Ω) | ||
|---|---|---|---|---|
| C 1s | N 1s | O 1s | ||
| TC700 | 82.16 | 2.13 | 15.71 | 14.4 |
| TC800 | 84.65 | 1.52 | 13.83 | 2.2 |
| TC900 | 87.92 | 1.13 | 10.95 | 0.8 |
The presence of nitrogen-doped and oxygen functional groups creates a disordered structure in the TC pith paper-derived carbons. As the carbonization temperature increases, the carbon material becomes more ordered, indicating a better electric conductivity.
A photograph and a SEM image of the TC pith paper are shown in Fig. 3a and b, respectively. The TC pith paper is easily processed into any shape with its flexibility maintained (inset Fig. 3a). Interestingly, the TC pith paper exhibits a honeycomb-like structure with a hole size between 100 and 150 μm (Fig. 3b).
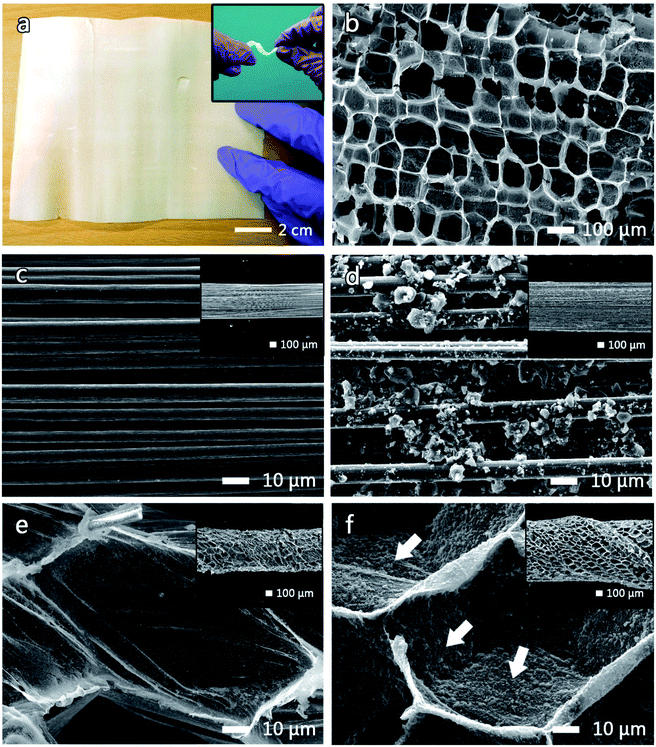 | ||
| Fig. 3 (a) Photo of a TC sheet with the inset of (a) showing a distorted TC ribbon. Morphologies of (b) a TC sheet surface, (c) a bare CFB, (d) AC-CFB, (e) TC-CFB, and (f) AC-TC-CFB. | ||
An FESEM image of a CFB containing 3000 fibers (3 K CFB), with a bundle diameter of 500 μm, a density (mass per length) of 2 mg cm−1, and an electrical conductivity of approximately 5.6 × 10⁴ S m−1 is shown in Fig. 3c. The CFB morphologies before and after coating with the AC slurry are depicted in Fig. 3c and d, respectively. The diameter of the AC-CFB increased to 750 μm (inset, Fig. 3d) after incorporation the AC particles containing nanometric to micrometric pores. The inset in Fig. 3e illustrates a macroscopic view of the CFB wrapped in TC pith paper after carbonization. The magnified image of the TC-CFB in Fig. 3e represents a honeycomb-like structure like the original TC structure, providing a high surface area for AC deposition. The TC-CFB diameter is approximately 600 μm, and molasses was used to bind the TC pith paper to the CFB before carbonization. The carbonized molasses provided a charge transfer network between the TC and CFB and strengthened the TC structure. More importantly, we observed uniform deposition of AC particles onto the surface of the concave TC structure (shown by arrows in Fig. 3f). Magnified images of the CFB and the TC-CFB coated with AC are displayed in Fig. 3d and f, respectively. Evidently, uniform deposition of the AC particles on the TC-CFB without agglomeration is possible. However, this is not possible without the TC pith paper, suggesting that the TC pith paper and the molasses enhanced adhesion of the AC particles onto the TC pith paper. The AC-TC-CFB yielded an approximate thickness of 850 μm (inset Fig. 3f).
The N2 adsorption–desorption isotherms and the pore size distributions for the AC, AC-TC, and TC powder are displayed in Fig. 4a and b, respectively. Generally, the hysteresis loop at relative pressures (P/P0) from 0.4 to 1.0 in the adsorption–desorption isotherms indicates the presence of mesopores (2–50 nm) and macropores (>50 nm). In addition, the AC exhibits a typical Type I isotherm (Fig. 4a), characterized by rapid adsorption at pressures <0.2, representing micropores from 1.6 to 3.0 nm.17,18 The calculated specific surface areas are 1425.2, 470.2, and 44.2 m2 g−1 for AC, AC-TC800, and TC800, respectively. The low specific surface area (44.2 m2 g−1) of the TC800 powder explains the low specific capacitance of 3.2 F g−1 at 100 mV s−1 for the TCp-CFB electrode (Fig. S1b†). Interestingly, the specific capacitance of TC800-CFB, incorporating the honeycomb-like structure of the TC and high electric conductivity of the CFB is 120.0 F g−1 at 100 mV s−1 (Fig. S1a†). The observed difference is because agglomeration of the powder provides a negative effect on capacitance by hindering infiltration of the electrolyte into the powder cluster. In addition, the boundary within the cluster increases contact resistance.
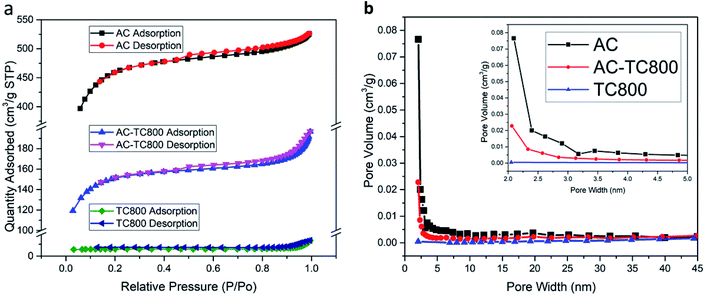 | ||
| Fig. 4 (a) N2 adsorption–desorption isotherms and BET surface areas and (b) pore size distribution curves based on the Barrett–Joyner–Halenda calculation for AC, AC-TC800, and TC800. | ||
3.1 Electrochemical performance of the fabricated electrodes
The electrochemical properties of the TC-CFB electrodes treated at different temperatures (denoted as TCX00-CFB, where X00 is the carbonization temperature) were evaluated using a three-electrode system containing a 1 M H2SO4 solution (Fig. S2a–c†). The TC-CFB electrode exhibited nearly rectangular CV curves at a low scan rate of 20 mV s−1 as well as at higher scanning rates of 60 and 100 mV s−1, demonstrating an ideal capacitive behavior. This behavior probably results from the good electric conductivity of the electrode attributed to the tight contact between TC and CFB that is beneficial for rapid electron transport. Similar results emerge from the GCD curves with typical triangular shapes measured at a current density of 0.2 A g−1 (Fig. S2d†). The equivalent series resistance (ESR) values of the TC700-CFB, TC800-CFB, and TC900-CFB electrodes calculated based on the voltage drop (IR drop) in the GCD curves (Fig. S2d†) are 39.3, 20.7, and 31.7 Ω, respectively. The high specific capacitance of the TC800-CFB electrode (Fig. S2e†) is attributed to the synergistic effect of oxygen functional groups and its relatively low electric resistance.19–21Usually, the amount of active material used in FFSCs is small, and therefore, the capacitance per unit mass is an improper index for evaluation of the capacitive properties of an electrode. The capacitance per unit space seems more suitable for the evaluation of the capacitive properties of an electrode. Thus, the length capacitance, areal capacitance, and volumetric capacitance are more meaningful for the capacitance evaluation. The specific capacitances of the TC-CFB electrodes treated at 700 °C, 800 °C, and 900 °C and tested at a scan rate of 20 mV s−1 are presented in Table 2, which were calculated using the equations given in the section of ESI.†
| Sample | Cmass* (F g−1) | Cmass** (F g−1) | Clength (mF cm−1) | Carea (mF cm−2) | Cvolume (F cm−3) |
|---|---|---|---|---|---|
| a Cmass* and Cmass**: mass specific capacitances calculated based on the electrode weight and the weight of activated material, respectively; Clength: length specific capacitance; Carea: area specific capacitance; and Cvolume: volume specific capacitance. | |||||
| TC700-CFB | 18.60 | 96.11 | 38.45 | 196.37 | 50.39 |
| TC800-CFB | 25.18 | 130.10 | 52.04 | 265.82 | 68.21 |
| TC900-CFB | 14.72 | 76.04 | 30.41 | 155.35 | 39.87 |
Based on the results shown in Table 2, we adopted the TC800-CFB sample penetrated by the AC slurry and dried (AC-TC800-CFB) as the typical electrode for evaluation of the capacitive performance of the fabricated electrodes. The CV and GCD curves along with EIS results were used to evaluate the capacitive properties of the bare CFBs, AC-CFB, TC800-CFB, and AC-TC800-CFB. The CV curves (measured at a scan rate of 20 mV s−1) at potentials ranging from 0 to 1.0 V and the GCD curves (measured at a fixed current density of 0.2 A g−1) at potentials ranging from 0 to 1.0 V are shown in Fig. 5a and b, respectively. The GCD curves display an almost symmetrical triangle shape, highlighting a typical feature of good EDLC behavior. The larger CV and GCD area of the AC-TC800-CFB compared with the others suggest that the presence of the AC created a 3D carbon framework that subsequently enhanced the EDLC efficiency of the electrode.
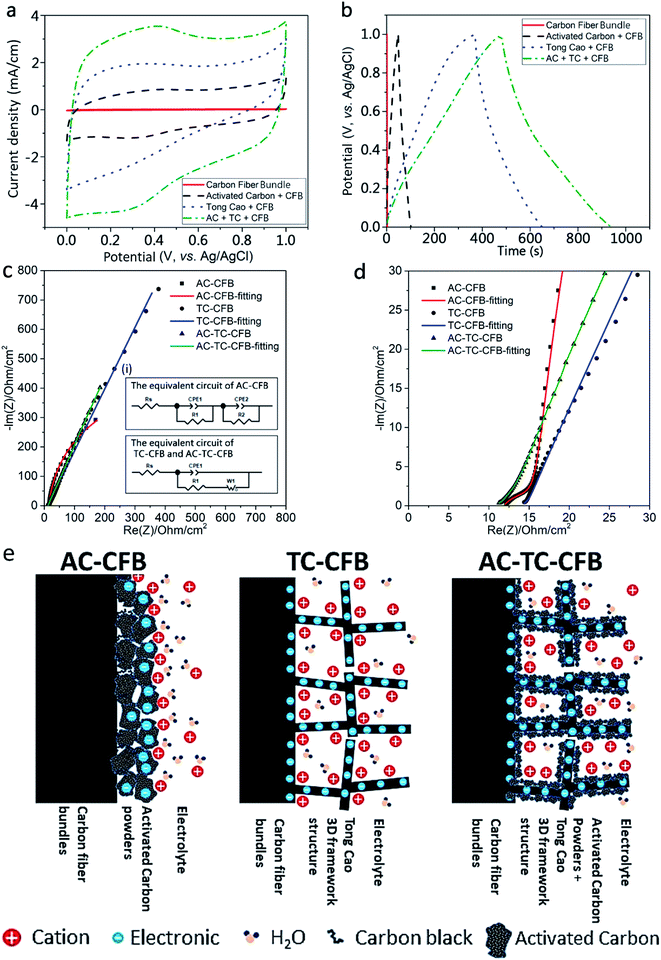 | ||
| Fig. 5 (a)–(e) Electrochemical characterization of the electrodes of bare CFB, AC-CFB, TC-CFB, and AC-TC-CFB with a length of 1.5 cm using 1 M H2SO4 as the electrolyte; (a) CV curves tested at a scan rate of 20 mV s−1; (b) GCD curves measured at a current density of 0.2 A g−1; (c and d) Nyquist plots of the AC-CTB, TC-CFB, and AC-TC-CFB electrodes (inset in Fig. 5c shows the electrochemical equivalent circuit); and (e) schematic illustration of the AC-CFB, TC-CFB, and AC-TC-CFB electrodes. | ||
The gravimetric capacitances for the active materials (Cmass**) obtained from the CV curves at different scan rates (20–100 mV s−1) are shown in Fig. S3.† Compared with other electrodes, the AC-TC800-CFB electrode has the highest Cmass** of 244.51 F g−1 for a scan rate of 20 mV s−1. The specific capacitances per unit length, area, and volume for the AC-TC800-CFB at a scan rate of 20 mV s−1 are presented in Table 3. The capacitance of the AC-TC800-CFB is higher than that of the sum of the AC-CFB and TC-CFB. This high capacitance is attributed to a synergistic effect of the 3D carbon framework of the carbonized TC paper and the high specific surface area of the AC. Specifically, the agglomeration of AC in AC-CFB is alleviated, improving the low specific surface area of the TC-CFB.
| Sample | Cmass* (F g−1) | Cmass** (F g−1) | Clength (mF cm−1) | Carea (mF cm−2) | Cvolume (F cm−3) |
|---|---|---|---|---|---|
| a Cmass*, Cmass**, Clength, Carea, and Cvolume: specific capacitances calculated based on the electrode weight, weight of activated material, length, area, and volume, respectively. | |||||
| CFB | 0.21 | 0.21 | 0.34 | 2.13 | 0.67 |
| AC-CFB | 10.80 | 34.48 | 26.20 | 111.69 | 23.92 |
| TC800-CFB | 25.18 | 130.10 | 52.04 | 265.82 | 68.21 |
| AC-TC800-CFB | 47.33 | 244.51 | 97.81 | 395.18 | 80.22 |
In addition, AC coating on TC provides more surface area and prevents agglomeration of AC in the electrode, consequently increasing the surface area for the electric double layer. Furthermore, the CFB with high electric conductivity acted as an excellent current collector for fast electron transfer.
The Nyquist plots of the supercapacitors using AC-CFB, TC-CFB, and AC-TC-CFB as electrodes are shown in Fig. 5d. The plot helps in analyzing the EIS data and constructing the equivalent circuits of the electrodes (inset (i) of Fig. 5c). Herein we used two models to simulate the electrodes including one for the AC-CFB and another for the TC-CFB and AC-TC-CFB. As displayed in Fig. 5d, the simulation results match very well the experimental results. The electrode structures, with or without incorporation of TC in the electrode, are illustrated in Fig. 5e.
As shown in the high-frequency region of the inset in Fig. 5d, the x-intercept of the Nyquist plot, denoted as Rs, represents the ESR of the electrode. The low Rs of 11.85, 14.22, and 11.13 Ω obtained for AC-CTB, TC-CFB, and AC-TC-CFB, respectively, imply low solution resistance of the electrolytes and electric resistance of the electrodes. The constant phase element 1 (CPE1) and CPE2 depicting the double layer capacitance appear in the equivalent circuits of AC-CFB and AC-TC-CFB shown in the inset in Fig. 5c. Double layer capacitance occurs at interfaces between ionic solutions and electrodes. The diameter of the distorted semicircle highlights the electrode conductivity and the charge transfer resistance (R1) of the electrode/electrolyte interface. The large value of fitted value of R1 of 4.38 Ω for the AC-CFB compared with 1.94 Ω for the TC-CFB and 2.96 Ω for AC-TC-CFB is attributed to the binder used in slurry.
In the intermediate-frequency region, the resistance (R2) is related to the ion transport barrier created by the agglomerated AC particles and the contact resistance among AC particles. The straight line in the Nyquist plots in the low-frequency region signifies the Warburg resistance (W1) resulting from ion diffusion in the nonuniform microstructure of the AC-CFB, TC-CFB, and AC-TC-CFB electrodes. However, the Nyquist plots of the AC-CFB electrode demonstrate a linear behavior in the low-frequency region and nonlinear behavior at a relatively higher frequency, indicating that the agglomeration of AC particles restricts diffusion of electrolyte ions in the electrode.
The obtained results suggest that because of the synergistic effect and 3D framework of the AC-TC-CFB electrode, the electrolyte easily infiltrates the electrode, enhancing its capacitance.
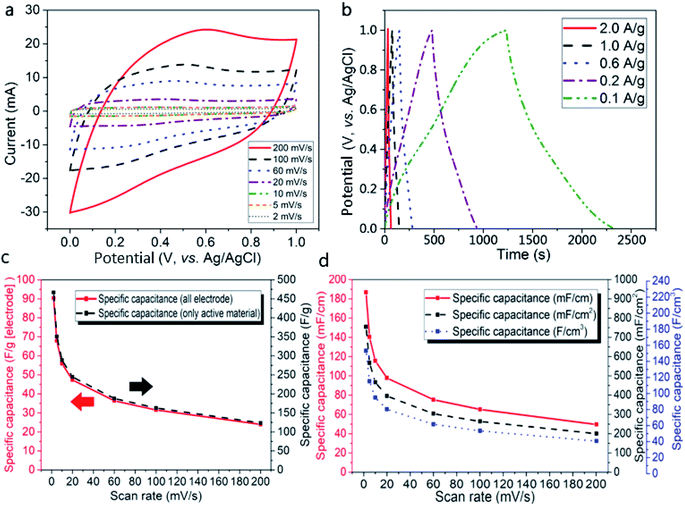
The CV curves obtained from the tests at scan rates of 2–200 mV s−1 (Fig. 6a) display quasi-rectangular shapes, especially at low scan rates, indicating that the AC-TC800-CFB exhibits typical EDLC characteristics. The obvious redox peaks likely originate from functional groups including hydroxyl, carbonyl, and carboxyl in the electrode associated with the adoption of molasses as the starting material for the carbon material.22 In addition, the XPS results, demonstrating low density N doping in the electrode, contributed to the pseudo-capacitance, and therefore enhanced its capacitance.
As depicted in Fig. 6b, the GCD performances, measured at current densities of 0.1–2.0 A g−1 show symmetric triangular shapes. This suggests fast charge/discharge properties and an ideal capacitive behavior for the AC-TC800-CFB electrode. Notably, a small IR drop (0.0198 V) is observed at a charge/discharge current density of 0.2 A g−1, implying a low internal resistance.
The specific capacitance of the AC-TC800-CFB electrode (Fig. 6c) attains high values of 466.84 and 90.36 F g−1 from calculations based on the weight of the activated material and electrode, respectively. The capacitance calculated in terms of electrode length (Clength), area (Carea), and volume (Cvolume) for the AC-TC800-CFB based on scan rates from 2 to 200 mV s−1 are shown in Fig. 6d. The calculations based on the CV and GCS curves are provided in the experimental section.
3.2 Electrochemical performance of the FFSCs
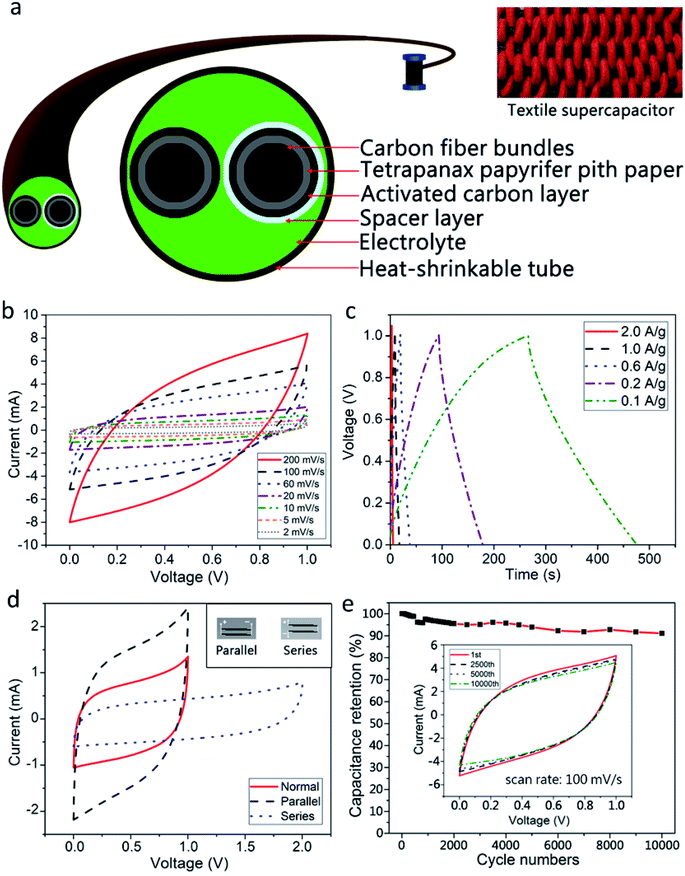
The fabricated FFSCs comprise two fiber electrodes, a spacer, and an electrolyte (Fig. 7a). Two commercial CFBs used as current collectors were wrapped with a TC pith paper, and the samples were carbonized at different temperatures followed by infiltration of AC slurry, and subsequently dried in an oven over night. A fiber electrode was then evenly wrapped with a nonwoven polyester fabric to avoid short circuits. Afterward, two electrodes wrapped with and without polyester were placed closely in parallel, inserted into a heat-shrinkable plastic tube, followed by the addition of PVA–H3PO4 gel electrolyte, and hot air was applied to shrink the tube.The CV and GCD measurements of the FFSCs at different scan rates and current densities are depicted in Fig. 7b and c, respectively. The FFSCs display quasi-rectangular CV curves and triangular waves with a small IR drop at the start of the discharge process especially at a lower scan rate, suggesting that the as-prepared FFSC is nearly an ideal EDLC with a low internal resistance.
The FFSCs are further integrated to achieve higher voltages or currents by connecting them in series or in parallel. The CV curves of two FFSCs connected in parallel or in series is displayed in Fig. 7d, with the inset depicting these two circuits. Compared with a single FFSC, the output current of a parallel circuit increased by a factor of two over the voltage range of 0 to 1.0 V. The series circuit operated at a maximum voltage of 2.0 V, which is two times the maximum output voltage of a single FFSC. The voltage profiles retain their original shapes, suggesting that the integrated-supercapacitor maintains stability without degradation of the excellent electrochemical properties of the AC-TC800-CFB FFSCs. The additivity of the capacitance by integrating the supercapacitor is important for high voltage or high current output.
A life test (Fig. 7e) reveals a high retention for the FFSC based on a CV test at a scan rate of 100 mV s−1. The specific capacitance of the AC-TC800-CFB FFSC remained approximately 91% of its original value after 10![[thin space (1/6-em)]](https://www.rsc.org/images/entities/char_2009.gif) 000 cycles, indicating a long life cycle. In addition, it showed no severe damage such as exfoliation of the AC from the TC (SEM image not shown).
000 cycles, indicating a long life cycle. In addition, it showed no severe damage such as exfoliation of the AC from the TC (SEM image not shown).
3.3 Mechanical properties of the FFSC
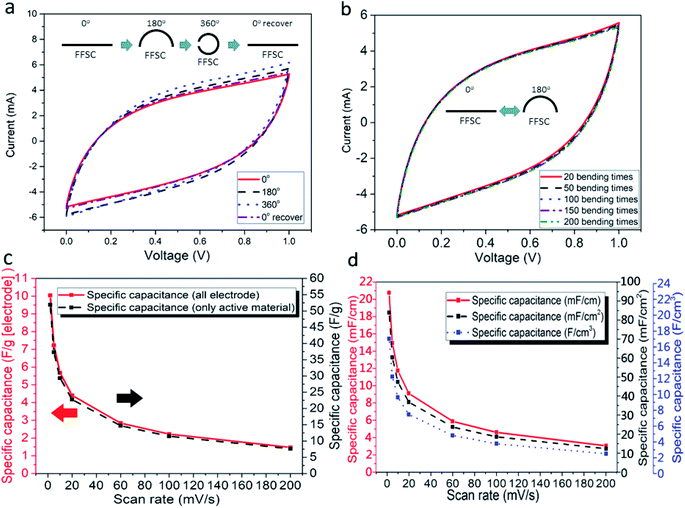
Capacitances of the FFSCs were tested at different bend angles to study the flexibility of the FFSCs. During the bending tests, the capacitance increased slightly at a high curvature due to squeezing of the gel into the pores of the FFSCs by the generated pressure (Fig. 8a). The CV curves of the FFSC display no obvious reduction in electrochemical performance even after 200 bending tests (Fig. 8b). The results indicate that the flexible FFSCs endure large-angle bending and repeated bending without loss of capacitance. The curves shown in Fig. 8c represent the specific capacitances calculated based on the electrodes or activated materials weights, whereas Fig. 8d illustrates the specific capacitance in terms of length, area, or volume. The results in Fig. 8 demonstrate that the FFSCs are flexible and strong enough to maintain their capacitance under different bending states and during repeating bending. This characteristic is beneficial for the utilization of the FFSCs for energy storage and power output in smart textile.The CV curves of an unfolded and a folded FFSC and a schematic representation of the FFSC are shown in Fig. 9a and the inset, respectively. The CV curves of the folded and unfolded FFSCs are almost identical, indicating good mechanical properties of the fabricated supercapacitor. The Ragone plots of the FFSCs in terms of length and area are shown in Fig. 9b and c, respectively, with some published which using all-carbon material for the flexible fibrous supercapacitor results also included for comparison. The highest power density in Fig. 9b is 1.37 mW cm−1 (or 39.8 mW cm−2), whereas the energy density in Fig. 9c is 0.68 μW h cm−1 (or 2.76 μW h cm−2). The highest energy density of 3.98 μW h cm−1 (or 16.1 μW h cm−2) occurred at a power density of 0.07 mW cm−1 (or 1.99 mW cm−2). The energy and power densities at different current densities are presented in Table S1.† The system performance surpassed those previously reported.9,12,23–31
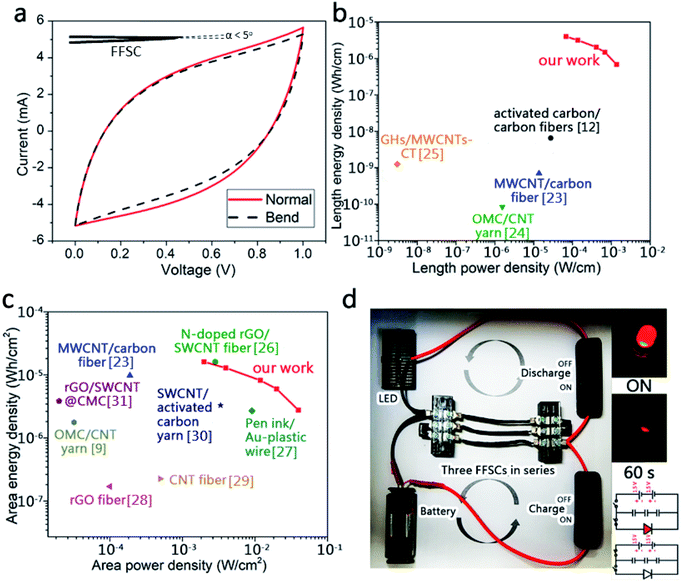 | ||
| Fig. 9 (a) Dependence of the CV curves of the folded FFSC and the Ragone plot of the fabricated supercapacitors based on (b) length and (c) area. Comparisons with other published results are also made;9,12,23–31 (d) brightness variation of the LED powered by three charged FFSCs arranged in series. The inserted image in (d) is a schematic circuit diagram for charging the FFSCs and a lit LED in the beginning and after 60 s. | ||
Three FFSCs of length 3 cm each were arranged in series and charged for 10 s. The FFSCs powered a red light-emitting diode (LED) for more than 1 min (Fig. 9d). The powered LED was very bright in the beginning, but the intensity slightly decreased after 60 s.
4. Conclusions
In this study, high-performance FFSCs were fabricated using commercially available AC, CFBs, and TC as the primary materials. The AC-TC800-CFB electrodes fabricated through a simple and environmentally friendly process demonstrate extremely high capacitance even under bending. In the fabricated FFSCs, conductive CFBs and TC with a honeycomb-like structure served as the current collectors and substrates for AC deposition, respectively. The excellent combination of AC, TC, and CFBs provided the FFSCs with a large effective area for ion transport and energy storage. The resultant specific length capacitance of 20.8 mF cm−1 at 2 mV s−1 is high specific length capacitance for all-carbon fiber supercapacitors. The FFSCs also exhibited an energy density of 16.1 μW h cm−2 (or 3.98 μW h cm−1) and a power density of 1.99 mW cm−2 (or 0.07 mW cm−1), retaining an energy density of 2.76 μW h cm−2 (or 0.56 mW h cm−1) at a high power density (39.8 mW cm−2 or 1.37 mW cm−1) after life tests for 10![[thin space (1/6-em)]](https://www.rsc.org/images/entities/char_2009.gif) 000 cycles. Additionally, we powered an LED light using three fabricated FFSCs arranged in series, to demonstrate the promising application of this system in smart textile applications. The fabrication method and fabricated FFSCs introduced in this work rely on environmentally friendly processes and commercially available carbon materials, indicating a great potential for utilization in future.
000 cycles. Additionally, we powered an LED light using three fabricated FFSCs arranged in series, to demonstrate the promising application of this system in smart textile applications. The fabrication method and fabricated FFSCs introduced in this work rely on environmentally friendly processes and commercially available carbon materials, indicating a great potential for utilization in future.
Conflicts of interest
There are no conflicts to declare.Acknowledgements
The authors thank the support from the Ministry of Science and Technology, Taiwan, under contract number MOST 104-2221-E-007-029-MY3.References
- Q. Li, H. Cheng, X. Wu, C.-F. Wang, G. Wu and S. Chen, Enriched carbon dots/graphene microfibers towards high-performance micro-supercapacitors, J. Mater. Chem. A, 2018, 6(29), 14112–14119 RSC.
- S. Xi, Y. Kang, S. Qu and S. Han, Flexible supercapacitors on chips with interdigital carbon nanotube fiber electrodes, Mater. Lett., 2016, 175, 126–130 CrossRef CAS.
- Y. Zhang, X. Zhang, K. Yang, X. Fan, Y. Tong and Z. Zhang, et al., Ultrahigh energy fiber-shaped supercapacitors based on porous hollow conductive polymer composite fiber electrodes, J. Mater. Chem. A, 2018, 6(26), 12250–12258 RSC.
- X. Ye, Q. Zhou, C. Jia, Z. Tang, Z. Wan and X. Wu, A Knittable Fibriform Supercapacitor Based on Natural Cotton Thread Coated with Graphene and Carbon Nanoparticles, Electrochim. Acta, 2016, 206, 155–164 CrossRef CAS.
- S. Seyedin, E. R. S. Yanza and M. Razal Joselito, Knittable energy storing fiber with high volumetric performance made from predominantly MXene nanosheets, J. Mater. Chem. A, 2017, 5(46), 24076–24082 RSC.
- H.-J. Chu, C.-Y. Lee and N.-H. Tai, Three-dimensional porous polyaniline/graphene-coated activated carbon fiber electrodes for supercapacitors, RSC Adv., 2016, 6(112), 111465–111471 RSC.
- Y. Li, Z. Kang, X. Yan, S. Cao, M. Li and Y. Liu, et al., A facile method for the preparation of three-dimensional CNT sponge and a nanoscale engineering design for high performance fiber-shaped asymmetric supercapacitors, J. Mater. Chem. A, 2017, 5(43), 22559–22567 RSC.
- L.-H. Tseng, C.-H. Hsiao, D. D. Nguyen, P.-Y. Hsieh, C.-Y. Lee and N.-H. Tai, Activated carbon sandwiched manganese dioxide/graphene ternary composites for supercapacitor electrodes, Electrochim. Acta, 2018, 266, 284–292 CrossRef CAS.
- Q. Yang, Z. Li, R. Zhang, L. Zhou, M. Shao and M. Wei, Carbon modified transition metal oxides/hydroxides nanoarrays toward high-performance flexible all-solid-state supercapacitors, Nano Energy, 2017, 41, 408–416 CrossRef CAS.
- S. Yan, J. Lin, P. Liu, Z. Zhao, J. Lian and W. Chang, et al., Preparation of nitrogen-doped porous carbons for high-performance supercapacitor using biomass of waste lotus stems, RSC Adv., 2018, 8(13), 6806–6813 RSC.
- Q. Yang, Z. Xu, B. Fang, T. Huang, S. Cai and H. Chen, et al., MXene/graphene hybrid fibers for high performance flexible supercapacitors, J. Mater. Chem. A, 2017, 5(42), 22113–22119 RSC.
- S. Zhai, W. Jiang, L. Wei, H. E. Karahan, Y. Yuan and A. K. Ng, et al., All-carbon solid-state yarn supercapacitors from activated carbon and carbon fibers for smart textiles, Mater. Horiz., 2015, 2(6), 598–605 RSC.
- D. Yu, Q. Qian, L. Wei, W. Jiang, K. Goh and J. Wei, et al., Emergence of fiber supercapacitors, Chem. Soc. Rev., 2015, 44(3), 647–662 RSC.
- Z. Wang, S. Qin, S. Seyedin, J. Zhang, J. Wang and A. Levitt, et al., High-Performance Biscrolled MXene/Carbon Nanotube Yarn Supercapacitors, Small, 2018, 14(37), e1802225 CrossRef PubMed.
- D. Harrison, F. Qiu, J. Fyson, Y. Xu, P. Evans and D. Southee, A coaxial single fibre supercapacitor for energy storage, Phys. Chem. Chem. Phys., 2013, 15(29), 12215–12219 RSC.
- X. Deng, S. Zhu, J. Li, L. Ma, F. He and E. Liu, et al., Ball-in-cage nanocomposites of metal-organic frameworks and three-dimensional carbon networks: synthesis and capacitive performance, Nanoscale, 2017, 9(19), 6478–6485 RSC.
- W. Huang, H. Zhang, Y. Huang, W. Wang and S. Wei, Hierarchical porous carbon obtained from animal bone and evaluation in electric double-layer capacitors, Carbon, 2011, 49(3), 838–843 CrossRef CAS.
- W. Xing, C. C. Huang, S. P. Zhuo, X. Yuan, G. Q. Wang and D. Hulicova-Jurcakova, et al., Hierarchical porous carbons with high performance for supercapacitor electrodes, Carbon, 2009, 47(7), 1715–1722 CrossRef CAS.
- Y. J. Oh, J. J. Yoo, Y. I. Kim, J. K. Yoon, H. N. Yoon and J.-H. Kim, et al., Oxygen functional groups and electrochemical capacitive behavior of incompletely reduced graphene oxides as a thin-film electrode of supercapacitor, Electrochim. Acta, 2014, 116, 118–128 CrossRef CAS.
- Y. He, Y. Zhang, X. Li, Z. Lv, X. Wang and Z. Liu, et al., Capacitive mechanism of oxygen functional groups on carbon surface in supercapacitors, Electrochim. Acta, 2018, 282, 618–625 CrossRef CAS.
- H. Cao, X. Peng, M. Zhao, P. Liu, B. Xu and J. Guo, Oxygen functional groups improve the energy storage performances of graphene electrochemical supercapacitors, RSC Adv., 2018, 8(6), 2858–2865 RSC.
- A. Sanchez-Sanchez, A. Martinez de Yuso, F. L. Braghiroli, M. T. Izquierdo, E. D. Alvarez and E. Pérez-Cappe, et al., Sugarcane molasses as a pseudocapacitive material for supercapacitors, RSC Adv., 2016, 6(91), 88826–88836 RSC.
- V. T. Le, H. Kim, A. Ghosh, J. Kim, J. Chang and Q. A. Vu, et al., Coaxial Fiber Supercapacitor Using All-Carbon Material Electrodes, ACS Nano, 2013, 7(7), 5940–5947 CrossRef CAS.
- J. Ren, W. Bai, G. Guan, Y. Zhang and H. Peng, Flexible and weaveable capacitor wire based on a carbon nanocomposite fiber, Adv. Mater., 2013, 25(41), 5965–5970 CrossRef CAS PubMed.
- Q. Zhou, C. Jia, X. Ye, Z. Tang and Z. Wan, A knittable fiber-shaped supercapacitor based on natural cotton thread for wearable electronics, J. Power Sources, 2016, 327, 365–373 CrossRef CAS.
- D. Yu, K. Goh, H. Wang, L. Wei, W. Jiang and Q. Zhang, et al., Scalable synthesis of hierarchically structured carbon nanotube-graphene fibres for capacitive energy storage, Nat. Nanotechnol., 2014, 9(7), 555–562 CrossRef CAS PubMed.
- Y. Fu, X. Cai, H. Wu, Z. Lv, S. Hou and M. Peng, et al., Fiber supercapacitors utilizing pen ink for flexible/wearable energy storage, Adv. Mater., 2012, 24(42), 5713–5718 CrossRef CAS PubMed.
- Y. Meng, Y. Zhao, C. Hu, H. Cheng, Y. Hu and Z. Zhang, et al., All-graphene core-sheath microfibers for all-solid-state, stretchable fibriform supercapacitors and wearable electronic textiles, Adv. Mater., 2013, 25(16), 2326–2331 CrossRef CAS PubMed.
- P. Xu, T. Gu, Z. Cao, B. Wei, J. Yu and F. Li, et al., Carbon Nanotube Fiber Based Stretchable Wire-Shaped Supercapacitors, Adv. Energy Mater., 2014, 4(3), 1300759 CrossRef.
- Q. Meng, H. Wu, Y. Meng, K. Xie, Z. Wei and Z. Guo, High-performance all-carbon yarn micro-supercapacitor for an integrated energy system, Adv. Mater., 2014, 26(24), 4100–4106 CrossRef CAS PubMed.
- L. Kou, T. Huang, B. Zheng, Y. Han, X. Zhao and K. Gopalsamy, et al., Coaxial wet-spun yarn supercapacitors for high-energy density and safe wearable electronics, Nat. Commun., 2014, 5, 3754 CrossRef CAS PubMed.
Footnote |
| † Electronic supplementary information (ESI) available. See DOI: 10.1039/c9ra07441d |
| This journal is © The Royal Society of Chemistry 2020 |

