 Open Access Article
Molecular dynamics simulations of solvent effects on the crystal morphology of lithium carbonate
Hang Chenabc,
Shaojun Duanab,
Yuzhu Sun*abc,
Xingfu Song *abc and
Jianguo Yuab
aEngineering Research Center of Resource Process Engineering, Ministry of Education, Shanghai 200237, China
bNational Engineering Research Center for Integrated Utilization of Salt Lake Resource, East China University of Science and Technology, Shanghai 200237, China. E-mail: yzsun@ecust.edu.cn; xfsong@ecust.edu.cn; Fax: +86-21-64252346; Tel: +86-21-64252346
cShanghai Institute of Pollution Control and Ecological Security, Shanghai 200092, China
First published on 4th February 2020
Abstract
The attachment energy (AE) model was employed to investigate the growth morphology of Li2CO3 under vacuum and water solvent conditions by molecular dynamics simulations. The attachment energy calculation predicted the growth morphology in vacuum dominated by the (1 1 −1), (0 0 2) and (1 1 0) crystal faces. A modified attachment energy model, accounting for the surface chemistry and the corresponding topography of the habit crystal plane, was established to predict the morphological importance of crystal faces in a water solvent. Moreover, radial distribution function (RDF) and diffusion coefficient analyses were performed to explore the adsorption and diffusion behaviors of solvent molecules on the Li2CO3 crystal faces. The calculated results showed that with the solvent effects, the (0 0 2) and (1 1 0) faces were of great morphological importance, while the (1 1 −1) face disappeared gradually. These finally resulted in a cuboid-like Li2CO3 crystal. The growth morphology and the corresponding X-ray powder diffraction pattern derived from the modified AE model were in accordance with the results observed in experiments. The related model provides an important basis for the further investigation of the effects of impurities.
Introduction
Lithium is an important strategic resource with good conduction, low thermal expansion, and high electrochemical potential. Li2CO3, as a stable and common compound of lithium, is the main applied form of lithium in industries. It is widely applied in fields such as battery electrodes and as add-in materials to ceramics or glasses, lubricating agents and pharmaceutical agents.1–3 In practice, different application fields usually have various requirements on the crystal shape. The typical example is that the needle-shaped crystals of Li2CO3 are undesirable in pharmaceutical industries due to their difficult processing; nevertheless, they are useful for applications in solar cells.4 In general, crystals with uniform size, shape and internal structure with a narrow size distribution are preferred. During the crystallization process, the crystal shape is mainly defined by the crystal growth rate of its different faces. Therefore, crystal growth and morphology are important for the crystallization of Li2CO3.Although the Li2CO3 crystal belongs to the monoclinic system (space group C2/c), it is different from rhombohedral or orthorhombic for most carbonates.The Li2CO3 crystals belong to the monoclinic system (space group C2/c) at variance with all other and most common rhombohedral and orthorhombic carbonates.5 Recently, much attention has been paid to the growth mechanism of the Li2CO3 crystals considering the complex composition of raw brine materials and crystallization process. Pastero et al.6 studied the evolution of the crystal growth and shape of 100 contact twinned crystals of Li2CO3 (zabuyelite) by comparing the experimental and calculated growth morphologies. Besides, surfactants and polyelectrolytes have been used to study the morphology transformation of Li2CO3 obtained by using LiCl and Na2CO3.7,8 In general, the morphology of a growing crystal is governed by two factors. One is the internal structure of the crystal; the other comprises external parameters, which mainly include supersaturation, temperature, the presence of solvents and impurity ions. Among them, the solvent is one of the most important factors that should be taken into consideration. However, reports on the growth mechanisms and the crystal morphology of Li2CO3 are rare. It is, therefore, very important to investigate the influence of solvents on the growth mechanism and crystal morphology of Li2CO3.
Until now, the rapid development of the molecular dynamics theory has provided a powerful tool for the investigation of the crystallization process.9–13 Researchers once reviewed the related theoretical models for predicting crystal shapes and pointed out that new approaches offer the possibility of accurately predicting the effects of solvents or impurities on the crystal morphology.14 As an example, Duan et al.15 studied the solvent-mediated crystal habit of an organic explosive compound by a modified attachment energy (AE) model. The effects of a solvent layer on different crystal surfaces were discussed. In short, the method of molecular dynamics has been widely applied to study the most favoured interactions between the crystal habit surfaces and specific solvents in order to establish the modification to the crystal shape in terms of relative growth rates.16–24 Nevertheless, due to the complexity of the crystallization system and process, there are very few reports on the theoretical study of the Li2CO3 crystal morphology and the related research is still challenging.
This study mainly focused on the growth morphology and surface configuration of Li2CO3 under a water solvent environment. This is expected to provide a fundamental reference for the subsequent investigation on the effects of impurity ions. The molecular dynamics models, namely, the Bravais–Friedel–Donnay–Harker (BFDH) and AE models were tested first for predicting the morphology of Li2CO3 crystals in vacuum. Then, as an exploration, the effects of the water solvent on the crystal faces of Li2CO3 were investigated through molecular dynamics simulations. The results were compared with experimental observations and discussed further.
Theory and MD simulation details
Attachment energy model
The attachment energy model was proposed based on the period bond chain (PBC) theory.25 The solvent has to be removed from the surface before the crystal face can grow. This would cost energy and thus, the attachment energy decreases. In the model, Es is defined as the energy correction term describing the energy of solvent binding on the crystal habit surface (h k l) in the presence of water. is the solvent-effected attachment energy and can be calculated by the attachment energy in vacuum Eatt as follows.
 | (1) |
In the process of crystal growth, Rhkl is the relative growth rate of the (h k l) face, which is taken to be proportional to  26
26
 | (2) |
For the crystal face with the lowest attachment energy, it has the greatest morphological importance due to the slowest growth rate. Since the influence of the solvent lies on both surface chemistry and the corresponding topography of the crystal face, the correction term Es can be calculated as follows:27
 | (3) |
| Eint = Etotal − (Esurface + Esolvent) | (4) |
Computational details
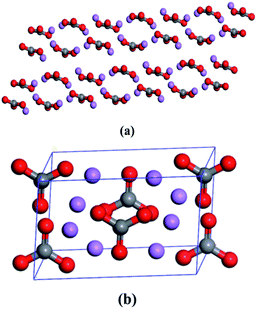
The initial crystal parameters of Li2CO3 are summarized in Table 1, which has been adopted by the Inorganic Crystal Structure Database (ICSD#66941).29 There are four irreducible molecules in each unit cell. The molecular and unit cell structures of Li2CO3 are displayed in Fig. 1.| Formula | Crystal system | Crystal class | Space group | a | b | c | α | β | γ |
|---|---|---|---|---|---|---|---|---|---|
| Li2CO3 | Monoclinic | 2/m | C2/c | 8.35263 Å | 4.97353 Å | 6.18942 Å | 90.000 | 114.677 | 90.000 |
In the beginning, the crystal structure of Li2CO3 was optimized with Forcite tools. Subsequently, the BFDH and AE models were used to predict the crystal morphology in vacuum and provide a list of possible crystal faces with different inherent multiplicities. The later results show that the AE model is more precise than the BFDH model because it takes the crystal unit cell into consideration. A periodic superstructure of 5 × 6 unit cells was constructed and the Li2CO3 crystal was cleaved along the three main stable faces: (1 1 −1), (0 0 2) and (1 1 0). The solvent layers (ρ = 1 g cm−3) filled with 500 randomly distributed H2O molecules were built using the “Amorphous Cell” tool at a target density of 1 g cm−3 (both H2O solvent). Their sizes were selected to match with the superstructures of the morphologically important surfaces. The solvent layers were geometrically optimized and their molecular dynamics were assessed using the Andersen thermostat with a uniform distribution of solvent molecules (NVT ensemble, 2000 ps with time step 1 fs at 298.15 K).30
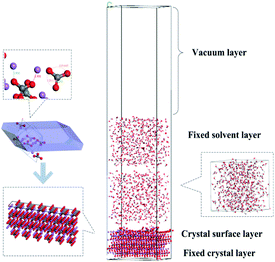
Furthermore, as shown in Fig. 2, two solvent layers are placed along the c axis on the crystal surface. A vacuum slab with 50 Å thickness was built above the solvent in order to eliminate the effect of additional free boundaries. The upper water layer and lower crystal molecules were fixed along the a, b and c directions. A global geometry optimization was carried out for initializing. The molecular dynamics simulation was assessed using the Andersen thermostat. The standard Ewald method with an accuracy of 0.0001 kcal mol−1 was used to calculate the electrostatic interactions and an atom-based summation with a cutoff of 15.5 Å was used to calculate van der Waals forces. The whole crystal surface and upper solvent layer were fixed and subjected to molecular dynamics simulations (NVT ensemble, 2000 ps with time step of 1 fs at 289.15 K).
The COMPASS force field was employed in all simulations.31 For each case, the equilibrium of the system was judged by two criteria of temperature and energy simultaneously. When the fluctuations of temperature and energy are in the range of 5–10%, the equilibrium of the system is considered to be ascertained.32 All the simulations were performed on the program of Material Studio (Accelrys Inc., USA) installed on a Rongtian SCS4450 GPU server, which was powered by 16 Intel Xeon CPU E5-2650 v3.
Experiments
Analytically pure Li2CO3 (99.99%, metal basis) was purchased from Shanghai McLean Biochemical Technology Co., Ltd. Li2CO3 was dissolved in deionized water and filtered through a G4 sand-core funnel to eliminate impurity nuclei. Then, it was recrystallized to obtain high purity. All solutions were prepared with deionized water.Methods of evaporation crystallization were adopted to prepare the Li2CO3 crystal, which comprised the following steps. First, agitation was terminated and the temperature was increased to room temperature when the concentration became lower than the solubility of Li2CO3 at 298.15 K. The resulting solution was stored under atmospheric conditions with minor interferences for a month to allow slow evaporation of water, thus yielding crystals. The morphology of the samples was observed by using a scanning electron microscope (SEM, Quanta 250, FEI Co., USA). The phase composition of the samples was determined by using an X-ray diffractometer (D/max 2550, Rigaku, Japan).
Results and discussion
Crystal morphology of Li2CO3 in vacuum
The crystal morphology of Li2CO3 in vacuum was calculated using both the BFDH and AE models. As presented in Fig. 3, the AE model predicts that the morphology is closer to that of the actual crystal due to its consideration of the crystal unit cell. Meanwhile, it can be seen that the predicted crystal shape in vacuum is dominated by the (1 1 −1), (0 0 2) and (1 1 0) faces according to the AE model. Based on the simulation, the crystal habit parameters of the main stable faces of Li2CO3 are listed in Table 2. It is clear that the (1 1 −1) face has the strongest morphological importance because of the slowest relative growth rate (Rhkl = 1.00) and the largest total habit facet area. The (0 0 2) face possesses the second largest facet area. The (1 1 0) face has the lowest morphological importance with a surface of 10.64%.| h k l | Multiplicity | dhkl (Å) | Eatt (kcal mol−1) | Rhkl | Total facet area (%) |
|---|---|---|---|---|---|
| (1 1 −1) | 4 | 3.78 | −84.05 | 1.00 | 75.38 |
| (0 0 2) | 2 | 2.81 | −172.52 | 2.05 | 13.98 |
| (1 1 0) | 4 | 4.16 | −183.03 | 2.18 | 10.64 |
Solvent effects on Li2CO3 morphology
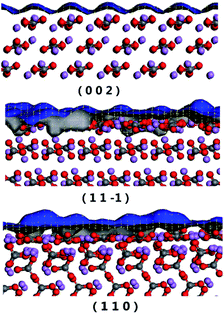
In order to understand the interaction between the solvent molecules and different Li2CO3 crystal faces, the crystal packing diagrams of the Li2CO3 habit faces were explored (Fig. 4). The blue grid on the Li2CO3 crystal face represents the Connolly surface. For the Connolly surface calculation, the grid interval was set to be 0.15 Å at a probe radius of 1.0 Å in this paper. It was obvious that the (1 1 −1) and (1 1 0) faces were uneven with large voids on the molecular level, while the (0 0 2) face was relatively flat. The parameter S is defined as the ratio of the solvent-accessible area (Aacc) to the corresponding surface area (Ahkl). The values calculated by these formulas are shown in Table 3. It can be found that the order of smoothness of the Li2CO3 crystal faces is (1 1 −1) > (0 0 2)> (1 1 0). Therefore, for the (0 0 2) and (1 1 −1) faces, the relatively low values of S mean morphological smoothness, which makes the adsorption behaviours less favourable. By contrast, the (1 1 0) face has the maximum S value of 1.05, indicating the rough topography of the crystal surface.| h k l | Aacc | Ahkl | Abox | S |
|---|---|---|---|---|
| a All areas are in Å2; Abox = n × Ahkl, n = 30. | ||||
| (1 1 −1) | 31.31 | 30.87 | 926.16 | 1.01 |
| (0 0 2) | 21.10 | 20.77 | 747.76 | 1.02 |
| (1 1 0) | 29.07 | 28.08 | 842.46 | 1.05 |
During the process of crystallization, solvents usually have an important influence on crystal growth due to the interactions between solvents and crystal surfaces. According to a previous theory, the attachment energies of the Li2CO3 crystal faces in vacuum would be altered by the interactions of the solvent layer. The simulated results of the Li2CO3 crystal morphology cultivated in the water solvent are summarized in Table 4. The (1 1 0) face has the minimum modified attachment energy  of −167.36 kcal mol−1 and the (0 0 2) face has the maximum
  of −77.66 kcal mol−1. The order of the modified attachment energies of the Li2CO3 crystal faces is (1 1 −1) > (0 0 2) > (1 1 0).
| h k l | Etotal | Esurf | Esolv | Eint | Es | Area ratio, % | |||
|---|---|---|---|---|---|---|---|---|---|
| a All energies are in kcal mol−1, areas are in Å2. | |||||||||
| (1 1 −1) | −113185.41 | −106353.51 | −6005.35 | −826.54 | −6.89 | −77.66 | 1.00 | 83.03 | 1.79 × 10⁵ |
| (0 0 2) | −121245.22 | −107976.33 | −7774.75 | −5494.14 | −45.78 | −137.24 | 1.77 | 16.97 | 3.65 × 10⁴ |
| (1 1 0) | −71443.13 | −65008.36 | −6411.99 | −742.78 | −5.16 | −167.36 | 2.16 | 0 | 0 |
Due to the solvent-surface interactions, the deposition of the solute molecules at the crystal faces is hampered. In other words, the relative growth of the crystal surfaces is inhibited. Then, the crystal morphology is affected ultimately due to the relative growth rates of its faces in different directions.33–35 The effect of the water solvent on the growth of the Li2CO3 crystal can be evaluated by comparing the relative crystal growth rates. For the water solvent, the order of relative crystal growth rates is (1 1 0) > (0 0 2) > (1 1 −1). Apparently, the (1 1 −1) face has a minimum relative growth rate, due to which it exhibits the largest facet area, accounting for 83.03% of the total value, whereas the growth rates of the (0 0 2) and (1 1 0) faces become faster. The final result is that the (1 1 0) face disappears gradually and the Li2CO3 crystal grows along the (0 0 2) face. Therefore, the (1 1 0) face is expected to be the most morphologically important crystal face for the slowest relative growth rate, while the (1 1 −1) face vanishes due to the fast relative growth rate.
The solvent–crystal interactions can be further analyzed by calculating the radial distribution function (RDF, or pair correlation function) g(r) in a system of particles (atoms, molecules, colloids, etc.). RDF is mainly used to describe how density varies as a function of distance from a reference particle. It has found applications in the structural investigations of specific interactions such as hydrogen bonding. Generally, the distance range of hydrogen bonding interactions and van der Waals (vdW) interactions is 3.1 Å and 3.1–5.0 Å, respectively. In contrast, the Coulomb interaction exhibits a large distance range of above 5.0 Å.11 The outermost layer of the Li2CO3 surface was employed during all RDF analyses. As shown in Fig. 5(a), the first peaks of r(H2O_H–Li2CO3_O) appear at 1.77, 1.81 and 1.75 Å, which means that the hydrogen bonds exist between H2O_H and Li2CO3_O. In the intervals of 3.31 and 3.33 Å, the second peaks can be observed for g(r)O–H-r, suggesting the presence of van der Waals (vdW) interactions. Wide areas occur above 5.0 Å, which indicates that Coulomb interactions also exist. In other words, water molecules absorb on the Li2CO3 crystal faces mainly via the solvent–crystal interactions of hydrogen bonds, van der Waals forces and Coulomb forces.
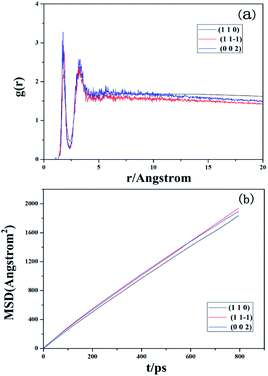 | ||
| Fig. 5 (a) RDF analysis of the interfacial model of solvent molecules and Li2CO3 crystals. (b) MSD analysis of solvent molecules on different crystal faces of Li2CO3. | ||
The diffusion capacity of solvent molecules is of great interest since it is likely to reveal the effect of solvents on the process of crystal growth. The diffusion coefficient (D) is measured by the mean square displacement (MSD) with respect to time using the Einstein relation:
 | (5) |
The predicted crystal morphology and the corresponding SEM result of Li2CO3 cultivated from the water solvent are displayed in Fig. 6. When Li2CO3 was crystallized from the water solvent, the predicted morphology was shown to be a cuboid-like crystal with an aspect ratio of 5.313, in which the (1 1 −1) and (0 0 2) faces remarkably increased with the disappearance of the (1 1 0) face in the process of crystal growth. This indicated that compared to that in vacuum, the morphological importance of the (1 1 −1) face increased. This result is in accordance with the structure obtained by the SEM experiment, which determines the validity of the molecular dynamics model effectively.
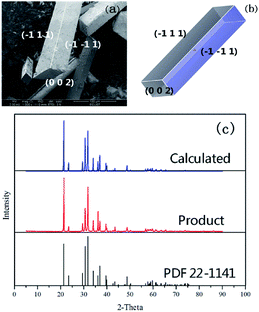 | ||
| Fig. 6 (a) SEM image of Li2CO3 cultivated from water solvent; (b) simulated crystal morphology by the AE model; (c) comparison of XRD patterns for Li2CO3. | ||
The XRD patterns calculated from the simulated crystal and experimental data are compared in Fig. 6(c). The bottom pattern represents the standard card PDF 22-1141 in Jade 5.0. The medium pattern is that of the product from the experiment and the top pattern is calculated from the simulated crystal. The result indicates that the calculated XRD pattern is in good agreement with the experimental one. Meanwhile, both of them were validated effectively by the standard PDF card.
Conclusions
In this paper, the interfacial effects between Li2CO3 crystals and water solvent layers were studied, particularly by molecular dynamics simulations. The results indicate that the growth morphology of the Li2CO3 crystal in vacuum is dominated by the (1 1 −1), (0 0 2) and (1 1 0) faces. A modified AE model was established to investigate the crystal growth process of Li2CO3 in water solvent and calculate solvent-effected attachment energy. The (1 1 −1) and (0 0 2) faces were found to be the morphologically important growth faces in the water solvent. Meanwhile, the (1 1 0) face disappears gradually and the Li2CO3 crystal grows along the (0 0 2) face. Moreover, RDF analysis shows that the adsorption behaviours of the H2O molecules on the Li2CO3 surfaces comprise hydrogen bonds, vdW forces, and Coulomb interactions. Because of the high values of the diffusion coefficients, the growth rates of the (1 1 −1) and (0 0 2) faces are inhibited, making them the dominant growth faces. Hence, the Li2CO3 crystal becomes cuboid-shaped finally due to the effects of the water solvent, which is in accordance with the experimental observation. The molecular dynamics model presented in this study provides an important basis for the subsequent investigation of the effects of solution impurity ions. Meanwhile, it determines that the solvent effect is a non-ignorable important factor for investigating the crystal morphology.Conflicts of interest
There are no conflicts to declare.Acknowledgements
This work was financially supported by the National Natural Science Foundation of China (51574126), National Key R&D Plan (2016YFC0401203), National Science-technology Support Plan Projects (2015BAB10B01).References
- J. W. Fergus, J. Power Sources, 2010, 195, 939–954 CrossRef CAS.
- C. J. Leo, A. K. Thakur, G. V. S. Rao and B. V. R. Chowdari, J. Power Sources, 2013, 115, 295–304 CrossRef.
- J. H. Lazarus, A. M. McGregor, M. Ludgate, C. Darke, F. M. Creagh and C. J. Kingswood, J. Affective Disord., 1986, 11, 155–160 CrossRef CAS.
- M. A. Lovette, A. R. Browning, D. W. Griffin, J. Sizemore, R. Snyder and M. Doherty, Ind. Eng. Chem. Res., 2008, 47, 9812–9833 CrossRef CAS.
- R. J. Reeder, Carbonates: Mineralogy and Chemistry, Mineralogical Society of America, Chantilly, VA, U.S.A, 1983 Search PubMed.
- L. Pastero, F. R. Massaro and D. Aquilano, Cryst. Growth Des., 2008, 7, 2749–2755 CrossRef.
- P. Taborga, I. Brito and T. A. Graber, J. Cryst. Growth, 2016, 460, 5–12 CrossRef.
- H. Watamura, H. Marukawa and I. Hirasawa, J. Cryst. Growth, 2013, 373, 111–117 CrossRef CAS.
- X. T. Ren, D. Y. Ye, N. Ding, J. X. He, Y. H. Lu, Q. Lei and Y. Y. Guo, Acta Armamentarii, 2015, 36, 272–278 Search PubMed.
- W. Shi, Y. Chu, M. Xia, L. Wu and F. Wang, J. Mol. Graphics Modell., 2016, 64, 94–100 CrossRef CAS PubMed.
- N. Liu, Y. Li, S. Zeman, Y. Shu, B. Wang, Y. Zhou, Q. Zhao and W. Wang, CrystEngComm, 2016, 18, 2843–2851 RSC.
- G. Chen, C. Chen, M. Xia, W. Lei, F. Wang and X. Gong, RSC Adv., 2015, 5, 25581–25589 RSC.
- X. Mao, X. Song, G. Lu, Y. Sun, Y. Xu and J. Yu, Ind. Eng. Chem. Res., 2015, 54, 4781–4787 CrossRef CAS.
- W. Daniel and M. F. Doherty, AIChE J., 2000, 46, 1348–1367 CrossRef.
- X. Duan, C. Wei, Y. Liu and C. Pei, J. Hazard. Mater., 2010, 174, 175–180 CrossRef CAS PubMed.
- R. B. Hammond, K. Pencheva and K. J. Roberts, Cryst. Growth Des., 2006, 6, 1324–1334 CrossRef CAS.
- C. Stoica, P. Verwer, H. Meekes, P. J. C. M. van Hoof, F. M. Kaspersen and E. Vlieg, Cryst. Growth Des., 2004, 4, 765–768 CrossRef CAS.
- C. Li and P. Choi, J. Phys. Chem. C, 2008, 112, 10145–10152 CrossRef CAS.
- S. Piana, M. Reyhani and J. D. Gale, Nature, 2005, 438, 70–73 CrossRef CAS PubMed.
- J. Chen, J. Wang, Y. Zhang, H. Wu, W. Chen and Z. Guo, J. Cryst. Growth, 2004, 265, 266–273 CrossRef CAS.
- S. Piana and J. D. Gale, J. Cryst. Growth, 2006, 294, 46–52 CrossRef CAS.
- X. Sun, Y. Sun and J. Yu, Cryst. Res. Technol., 2015, 50, 293–298 CrossRef CAS.
- J. Kundin, C. Yürüdü, J. Ulrich and H. Emmerich, Eur. Phys. J. B, 2009, 70, 403–412 CrossRef CAS.
- S. Piana and J. D. Gale, J. Am. Chem. Soc., 2005, 127, 1975–1982 CrossRef CAS PubMed.
- P. Hartman and P. Bennema, J. Cryst. Growth, 1980, 49, 145–156 CrossRef CAS.
- Z. Berkovitch-Yellin, J. Am. Chem. Soc., 1985, 107, 8239–8253 CrossRef CAS.
- L. Yang and Y. Dong, Carbohydr. Res., 2011, 346, 2457–2462 CrossRef CAS PubMed.
- M. L. Connolly, Science, 1983, 221, 709–713 CrossRef CAS PubMed.
- Y. Idemoto, J. W. Richardson, N. Koura, S. Kohara and C. K. Loong, J. Phys. Chem. Solids, 1998, 59, 363–376 CrossRef CAS.
- J. Ö. Bjarnason and H. C. Andersen, J. Chem. Phys., 1980, 72, 4132–4140 CrossRef CAS.
- M. J. McQuaid, H. Sun and D. Rigby, J. Comput. Chem., 2004, 25, 61–71 CrossRef CAS PubMed.
- G. Chen, M. Xia, W. Lei, F. Wang and X. Gong, J. Mol. Model., 2013, 19, 5397–5406 CrossRef CAS PubMed.
- M. Lahav and L. Leiserowitz, Chem. Eng. Sci., 2001, 56, 2245–2253 CrossRef CAS.
- C. Stoica, P. Verwer, H. Meekes, P. J. C. M. van Hoof, F. M. Kaspersen and E. Vlieg, Cryst. Growth Des., 2004, 4, 765–768 CrossRef CAS.
- G. R. Desiraju, Acc. Chem. Res., 2002, 35, 565–573 CrossRef CAS PubMed.
| This journal is © The Royal Society of Chemistry 2020 |

