 Open Access Article
Finely crafted quasi-core–shell gadolinium/layered double hydroxide hybrids for switching on/off bimodal CT/MRI contrasting nanodiagnostic platforms†
Sang-Yong Jung‡
a,
Gyeong-Hyeon Gwak‡ b,
Jin Kuen Park
 *c and
Jae-Min Oh
 *a
*a
aDepartment of Energy and Materials Engineering, Dongguk University-Seoul, 04620 Seoul, South Korea. E-mail: jaemin.oh@dongguk.edu
bBeamline Research Division, Pohang Accelerator Laboratory, Pohang University of Science and Technology, Pohang, Gyeongsangbukdo 37673, Republic of Korea
cDepartment of Chemistry, Hankuk University of Foreign Studies, Yongin 17035, Republic of Korea
First published on 5th February 2020
Abstract
We successfully synthesized a size-controlled hybrid of layered double hydroxide (LDH) platelets and Gd(OH)3 nanorods through the reverse micelle method. Under controlled synthetic conditions, the hybrid was developed to a quasi-core–shell structure, where the Gd(OH)3 nanorods were covered by the LDH platelet assembly, and this was investigated by X-ray diffraction and high-resolution transmission electron microscopy. The zeta potential measurement for the hybrid revealed that Gd(OH)3 was surrounded by LDH moieties. According to dynamic light scattering, the hydrodynamic radius of the hybrid was uniformly controlled under 150 nm, which was comparable to that of one Gd(OH)3 nanorod surrounded by an LDH moiety. Thus, the obtained hybrid exhibited a maximum Hounsfield unit of 180 at a concentration of 5 mg mL−1, implying its potential as a computed tomography contrast agent. The magnetic resonance relaxivities of the hybrid were examined at pH 5 and 7, simulating lysosomal and plasma conditions; the r1 values were 7.3 and 2.9, respectively, which were highly dependent on the physiological conditions.
Introduction
Various imaging technologies such as X-ray-based computed tomography (CT), magnetic resonance imaging (MRI), ultrasound (US) imaging, and single-photon emission computed tomography (SPECT) are utilized clinically. In order to enhance the accuracy of diagnosis and help clinical doctors to interpret images, contrast agents (CAs) corresponding to imaging technologies are either under development or commercially available. Each imaging technique has inherent strong and weak points. For example, CT has the advantages of fast scanning and high accessibility with the limitation of low spatial resolution. MRI shows a high resolution; however, it takes a long time for scanning. Although the US technique shows clear images of soft tissues, its depth of investigation is low. SPECT imaging enables the systemic tracing of a contrast agent in time course; unfortunately, it is hard to obtain anatomical information. Thus, it is not easy to obtain accurate and reliable diagnosis results based on a single modality.1 To have the maximum advantage of diagnostics, the paradigm of a contrast agent is moving from a simple modality to multimodality and from the discovery of a contrast moiety to the development of distinguished functionalities. For example, dual-modal CAs with CT and MRI responsivity have been widely reported due to their complementarities to each other.2,3 On the other hand, responsive MRI-CAs with respect to various physiological conditions are being developed.4,5The above-mentioned strategies in the development of CAs are recently strongly affected by nanotechnologies, in which CAs are being developed with high accuracy, efficacy, and multimodality.6,7 An example of a molecular imaging platform is diatrizoate, a water-soluble iodinated compound that is widely utilized as a computed tomography (CT) contrast agent. However, due to their small sizes, iodinated molecules suffer from fast renal clearance once they enter the bloodstream. Consequently, a large dose of administration is inevitably required, increasing unexpected side effects.8–12 Another example is the magnetic resonance imaging (MRI) contrast agent gadolinium-diethylenetriaminepentaacetic acid (Gd-DTPA). Due to its high paramagnetic property, Gd species can be utilized as T1-weighted MRI contrast agents. However, the affinity of Gd to sulfur moieties in proteins causes toxicity issues. To solve problems such as prolonged circulation, reduced toxicity, and decreased accuracy to the target lesion, researchers have tried to apply nanoplatforms whose size and surface nature can be controlled to avoid fast clearance and take the advantage of target specificity.13 Nanoparticles consisting of noble metals (e.g., Ag, Au, and Pt) have been reported as CT contrast agents.14,15 Paramagnetic Gd or Mn-based materials and ferromagnetic iron oxides have been developed as T1 or T2-weighted magnetic resonance imaging (MRI) contrast agents.16
When using chemical strategies to obtain high performance of nanoplatform-based CAs, it is important to control the composition and/or structure of the nanoparticles. In order to increase the efficiency of contrast agents in CT applications, CA nanomaterials have been designed to have not only a high X-ray absorption coefficient17 and anisotropic shape18 to take the advantage of effective X-ray attenuation but also modifiable surface properties to endow biological functionalities.19 First, the high X-ray absorption coefficient is strongly related to the atomic number of the contrast moiety and the density of the material.17 It was reported that the anisotropic shape like a rod had higher CT contrasting activity than a sphere.18 In terms of surface issues, high surface areas and multifunctional groups are advantageous for facile modifications. Furthermore, surface-modified nanomaterials could enhance the innate X-ray attenuation of materials by controlling the assembly of the contrast moiety within a modified surface.19 In fact, the contrast moiety and surface modification are in competitive relationship with each other; an increase in the surface-modified moiety enables more biological functionalities but less CT efficiency due to the decrease in the contrast moiety. To strike a balance between the two factors, the Hounsfield unit (HU), i.e., the CT contrasting power has been adjusted between 50 and 200 at the CA concentration from 0 to 5 mg mL−1 in the previous literature.19–22 We also aimed, in this research, to obtain similar HU values within a comparable concentration range.
On the other hand, in T1-weighted MRI-CA, the accessibility of water molecules to the Gd moiety is an important factor to determine the contrasting effect. Thus, nanomaterials are designed to have controlled water accessibility according to external stimuli.
Herein, we propose a hybrid CA nanoplatform with on/off switchable MRI contrasting ability according to physiological conditions and CT/MRI bimodality. In order to realize the CT/MRI biomodality, Gd(OH)3 nanorods were designed. Due to the high X-ray attenuation coefficient of Gd, its hydroxide or oxide compounds inherently possess CT contrasting ability. In addition, the paramagnetic properties of the Gd moiety in Gd2O3 or Gd(OH)3 enable T1-weighted MRI contrasting.23 Recently, the Gd2O3 or Gd(OH)3 nanoparticles instead of Gd–organic complexes have been extensively studied. One recent study has reported that the Gd(OH)3 nanorods have higher relaxivity than a Gd complex with equivalent Gd moieties.24 In the present study, we covered the surface of the Gd(OH)3 nanorods with platelet-like layered double hydroxide (LDH) nanoparticles. LDHs are recently emerging as important materials in biological applications due to their biocompatibility,25 high cellular uptake by cancer cells,26 bio-inertness in physiologically neutral solutions, solubility in weakly acidic conditions,27 etc. In this study, a Gd/LDH hybrid was designed to have a quasi-core–shell structure,28 where the Gd(OH)3 core was not perfectly covered by the LDH shell. Instead, small LDH platelets covered the Gd(OH)3 nanorods by random attachment. In this way, LDH can block the interaction between Gd(OH)3 and water molecules under plasma conditions. Such a hybrid can be taken up by cancer cells and the LDH coatings can be dissolved in the lysosome (pH ∼ 5)29 or the cytosolic compartment of cancer cells (pH ∼ 4)30 to expose core Gd(OH)3 nanorods to water molecules.
In this contribution, we applied the reverse-micelle technique to obtain Gd/LDH hybrids with a well-defined particle size (∼150 nm), an important factor in terms of toxicity, clearance by macrophages, and uptake by cancer cells. The nanorod-shaped Gd(OH)3 and quasi-core–shell structure were then controlled by utilizing chelated Gd precursors and adjusting precipitation procedures. Substantial characterizations were carried out to elucidate the core–shell structure and CT/MRI bimodality as well as the switchable MRI contrasting ability.
Results and discussion
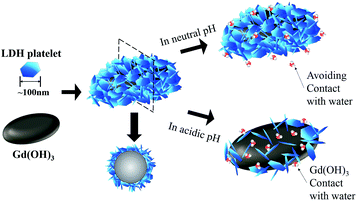
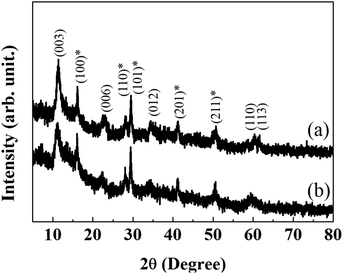
The strategy of the current research is shown in Scheme 1. After the Gd/LDH hybrids were prepared by the reverse micelle method and the surfactants were removed, we could expect that a unit of hybrid can consist of a Gd(OH)3 rod (a black rod) and lots of LDH plates (blue plates) surrounding the rod. LDH platelets with a lateral dimension of tens of nanometers made a huge coating for the Gd(OH)3 rod through random agglomeration among the LDH platelets. The frequency of interactions between the contrast moiety and water molecules is known to determine the efficiency of MRI. Therefore, controlling the area of the LDH cover that blocks the interaction between water molecules and the Gd(OH)3 rod is a key in the MRI contrasting efficiency of the current hybrid. In neutral pH conditions, the cover of LDH is maintained and there is less chance for water molecules to meet the Gd(OH)3 moiety, resulting in ‘switch-off’ mode in MRI measurements. In contrast, in acidic pH conditions such as in lysosomes or the cytosolic part of cancer cells, LDH is soluble and the cover is partially removed to expose the Gd(OH)3 moiety. As a result, the chances of interactions between the Gd(OH)3 rods and water molecules increase. Thus, ‘switch-on’ hybrids will show better MRI contrasting efficiency. In summary, the MRI contrasting switch of the hybrid is off in plasma conditions, but the switch is on when the hybrid is taken up by tumors without any additional external stimulus.Both hybrids, regardless of the metal composition of LDH, showed XRD patterns attributed to both Gd(OH)3 and LDHs (Fig. 1 and S1†). The diffraction peaks at 2θ of 11.42, 22.84, 34.46, and 60.23° indicate the (003), (006), (012), and (110) planes of hydrotalcite (JCPDS no. 14-0191), respectively, while the peaks at 2θ of 16.06, 28.21, 29.56, 41.15, and 50.56° are assigned to the (100), (110), (101), (201), and (211) planes of gadolinium hydroxide (JCPDS no. 83-2037), respectively. The XRD pattern of the as-prepared Gd(OH)3 shows less intensity than that for hybrids, suggesting the facilitated crystal growth of Gd(OH)3 among the LDH matrix. The lattice parameters of Gd(OH)3 in the hybrids were a = 6.34 and c = 3.63, which were not significantly different from those of conventional compounds. The lattice parameters of LDH were slightly different depending on the metal composition. MgAl-LDH in Gd(OH)3@MgAl-LDH (Gd/MgAl) had a = 3.07 and c = 23.5, while MgGa-LDH in Gd(OH)3@MgGa-LDH (Gd/MgGa) showed a = 3.10 and c = 24.1. The slightly larger a value of MgGa-LDH than that of MgAl-LDH might be attributed to the larger ionic radius of Ga3+ (∼76 pm) than that of Al3+ (67 pm).
We could estimate the crystallite sizes of both Gd(OH)3 and LDH in the hybrid utilizing the Scherrer's equation.31 The crystallite sizes of LDH along the (110) direction for the Gd/MgAl and Gd/MgGa hybrids were determined to be 13.5 nm and 10.6 nm, respectively. The crystallite sizes of Gd(OH)3 along the (101) direction for the Gd/MgAl and Gd/MgGa hybrids were found to be 213.2 nm and 236.7 nm, respectively. It could be concluded that neither the hybridization process nor the metal composition of LDH influenced the crystallographic property or crystallite size of Gd(OH)3 or LDH.
Although we confirmed that both the Gd(OH)3 and LDH phases were well developed, we could not confirm the formation of a uniform hybrid, where the Gd(OH)3 particle was covered by small LDH domains only with XRD. In order to examine the sites of Gd(OH)3 and LDH in the hybrid, we obtained zeta potential measurements (Fig. 2). The zeta potential value of Gd(OH)3 in a neutral aqueous condition has been well described to be moderately negative (−19 mV).32 In a neutral aqueous condition, MgAl-LDH and MgGa-LDH synthesized without the Gd(OH)3 moiety were determined to have the zeta potential values of +32.6 and 13.9 ± 1.0 mV, respectively. It should be noted here that the zeta potential values of both hybrids (27.4 ± 1.7 mV for Gd/MgAl and 6.0 ± 2.0 mV for Gd/MgGa) lie more closely to the value of LDH than that of Gd(OH)3. This strongly indicated that the external part of hybrids was occupied by the LDH part more than by Gd(OH)3.
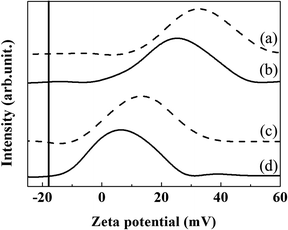 | ||
| Fig. 2 Zeta potentials of samples. (a) MgAl-LDH, (b) Gd/MgAl, (c) MgGa-LDH, (d) Gd/MgGa. Zeta potential of Gd(OH)3 is marked on the graph with a horizontal line. | ||
We could observe a similar aspect from the SEM measurement of powder specimens. The external part of the hybrids majorly exhibited LDH-like morphology, whereas the Gd(OH)3 particles were found when the inside part was exposed. As shown in Fig. 3(A), the outside of the hybrid exhibits typical round platelets and rosette-like structure, corresponding to MgAl–CO3-LDH and MgGa–CO3-LDH.33 We could occasionally observe rod-shaped particles (white squares in images), a typical morphology of Gd(OH)3,32 when the inside part of the hybrids was exposed. In this way, the surface chemistry of Gd(OH)3 can be camouflaged by LDH, which has biological advantages such as protein corona formation,34 facilitation of endocytosis by cancer cells,25 and biocompatibility.
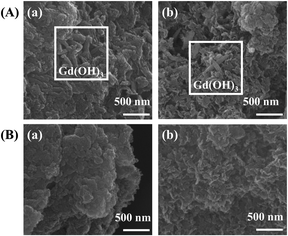 | ||
| Fig. 3 Scanning electron microscopy of powder sample. (A) Inside exposed images and (B) external surface images of hybrids: (a) Gd/MgAl, (b) Gd/MgGa. | ||
In order to cross-confirm that the rod part and round platelets with rosette-like structure-shaped particles in the SEM measurements were those of Gd(OH)3 and LDH, respectively, we further examined the hybrid by utilizing TEM, EDS, and FFT analyses for cross-sectioned samples. As shown in Fig. 4(a), there are both strong dark contrast and relatively bright contrast regions. Considering the atomic numbers of 12Mg, 13Al and 64Gd, the dark and gray regions surely indicate Gd(OH)3 and MgAl-LDH, respectively. The EDS mapping (Fig. 4(b)) and EDS line scan profile (Fig. 4(c)) pointed out that these two components were separated and well distributed in the hybrid. For detailed crystallographic information, we obtained a high-resolution image of the part where dark and bright contrasts co-existed (Fig. 4(d)). The FFT patterns of the overall area show reciprocal lattice patterns, corresponding to the (110) plane of LDH (Fig. 4(e)). On the other hand, a specific region strongly represents the FFT patterns corresponding to the (110) and (211) reciprocal lattice spots of Gd(OH)3 (Fig. 4(f)).
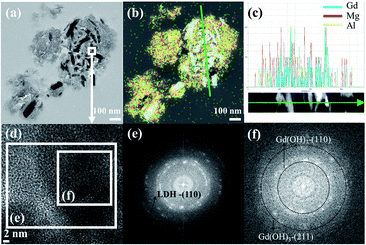 | ||
| Fig. 4 (a) Cross-sectional TEM image of Gd/MgAl. (b) EDS mapping of Gd/MgAl. (c) EDS line scan profile of (b), (d) magnified image of (a), (e) FFT of (d), (f) FFT of (d). | ||
Interestingly, the FFT of the Gd(OH)3 part exhibits a rather regular dot pattern, while that of the LDH part is more ring-like. This indicated a random orientation of relatively small LDH particles surrounding Gd(OH)3. The FFT patterns depending on the designated area showed that Gd(OH)3 existed in a specific position, whereas the LDH moiety was present throughout the sample, confirming that the LDH part covered Gd(OH)3.
Likewise, Gd/MgGa showed similar TEM, EDS, and FFT results to those of Gd/MgAl in terms of particle size, component, distribution, and lattice fringe, as shown in Fig. 5. The TEM image of Gd/MgGa shows relatively dark and bright contrasts originating from Gd(OH)3 and MgGa-LDH, respectively. The EDS image and line profile clearly reveal that the cyan-colored dots on the Gd(OH)3 rods and red/green colored dots on MgGa-LDH are uniformly distributed. Moreover, like the Gd/MgAl results, the lattice fringes in the TEM image and FFT images of Gd/MgGa also show reciprocal lattice spots of each component in the Gd/MgGa hybrids.
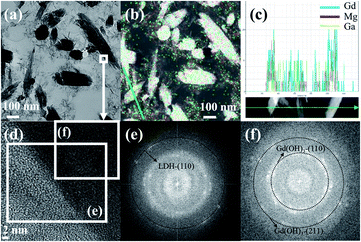 | ||
| Fig. 5 (a) Cross-sectional TEM image of Gd/MgGa. (b) EDS mapping of Gd/MgGa. (c) EDS line scan profile of (b). (d) Magnified image of (a), (e) FFT of (d), (f) FFT of (d). | ||
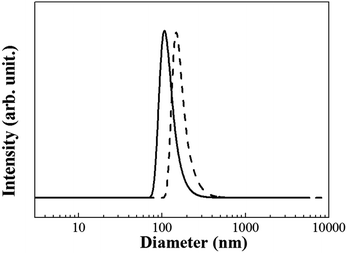
For the biological application of CT/MRI contrast agents, the optimized particle size of the hybrids in terms of LDH's surface chemistry should lie between 100 and 200 nm. This size range is beneficial for avoiding macrophages for long-term circulation,13 taking advantage of enhanced permeation and retention (EPR) for tumour selectivity,35 and entering cancer cells in large quantities through endocytosis.36 Thus, we carried out dynamic light scattering analyses on the hybrids (Fig. 6) to measure the hydrodynamic radius of the single unit, which we could not clearly detect with SEM or TEM. Both hybrids showed a size of ∼120 nm in aqueous suspensions.
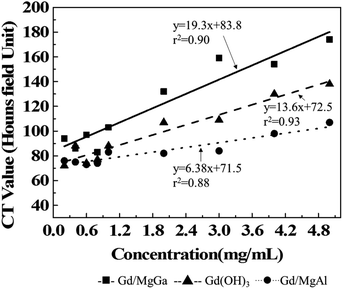
In order to evaluate the contrasting effect of the hybrids, we utilized Biograph mCT. As shown in Fig. 7, the attenuations of both hybrids as well as Gd(OH)3 alone are significantly correlated under all concentration ranges in this study. As described in Table S1,† LDHs themselves show negligible X-ray attenuation at all the concentration ranges tested. The CT values of both hybrids in the concentration range of 0.2–5 mg mL−1 were between 80 and 180 HU. Such values are comparable with those of CT/MRI dual contrast agents in the literature.37,38 It was worthy to note that the HU values of Gd(OH)3 lay between 72 and 138 and these were between those of Gd/MgAl (73–107 HU) and Gd/MgGa (83–174 HU) in the same concentration range. The higher HU values of Gd(OH)3 than that of Gd/MgAl could be easily explained by the composition; Gd(OH)3 had more high-atomic-number elements than Gd/MgAl in the same weight. However, it was unexpected that the HU value of Gd/MgGa was higher than that of Gd(OH)3 despite the lower atomic masses of 12Mg and 31Ga than that of 64Gd. This anomalous phenomenon would be attributed to the particle distribution in the LDH matrix. As reported previously, Au nanoparticles with a smaller size have higher X-ray attenuation than the larger ones.39,40 Wang et al. interpreted that this was due to the high surface-to-volume ratio by comparing the HU values of Au nanoparticles and Fe3O4–Au hybrid nanoparticles.41 As-prepared Gd(OH)3 nanoparticles tend to have agglomeration, reducing the surface-to-volume ratio; however, the LDH moiety properly segregated the Gd(OH)3 moiety in Gd/MgGa to maximize the X-ray attenuation property. According to the HU values, it could be concluded that Gd/MgGa has a better property to become a dual CT/MRI CA candidate than Gd/MgAl.
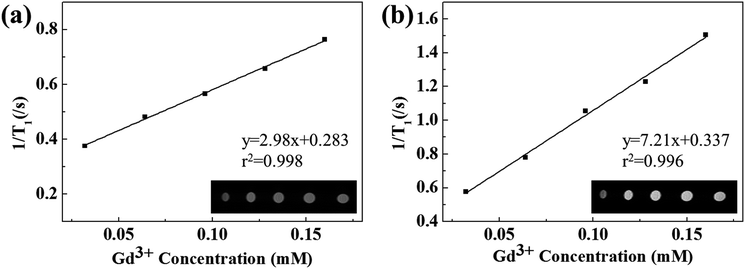
The MRI contrasting effect, r1 relaxivity, of Gd/MgGa was measured under physiological pH conditions to check the possibility of potential dual-modal CA candidates (Fig. 8). For comparison, the MRI image and r1 value were obtained with LDH and Gd(OH)3. As expected from the non-magnetism of LDHs, both MgAl-LDH and MgGa-LDH did not show MRI contrasting properties (Fig. S2†). Unexpectedly, the as-prepared Gd(OH)3 also showed poor MRI contrasting properties despite the expected paramagnetic properties. This could be partially explained by the heterogeneity of the suspension. The as-prepared Gd(OH)3 nanoparticles tended to agglomerate in the aqueous phase. The resulting heterogeneous suspension may give rise to an artifact of MRI measurement by setting wrong points. In fact, the MRI imaging in Fig. S3† is stained due to heterogeneity. Furthermore, the agglomeration of nanoparticles could result in reduction in MRI contrasting; Faucher et al. reported that Gd2O3 nanoparticles showed decreasing r1 values upon increasing agglomeration.42
As the hybrid has a quasi-core–shell structure, the outer part of LDH does not fully cover the Gd(OH)3 particles inside the hybrid. There can be an interaction between the exposed Gd(OH)3 surface and water protons, enabling MRI contrast. As expected, bright contrast was clearly observed on increasing the Gd3+ concentration in the hybrid suspension. Linear regression analysis showed high linearity between [Gd3+] and 1/T1, with the r2 value of 0.9983 for the Gd/MgGa hybrids. The calculated r1 value of the hybrids in DW was 2.978 mM−1 s−1 (Fig. 8(a)). This slight discrepancy in the r1 value might be attributed to the different particle sizes of Gd(OH)3 in each hybrid. It is well-known that the particle size and surface-to-volume ratio of Gd(OH)3 strongly affect r1 relaxivity.24 As the shell part LDH can be partially dissolved in acidic conditions, we can expect that acidic conditions will expose more Gd(OH)3 surfaces in the hybrid, resulting in the increase in r1 relaxivity. At pH 5, both hybrids showed increasing 1/T1 values and bright contrast on increasing the Gd3+ concentration. The linearity between 1/T1 and [Gd3+] was also very high, with the r2 value of 0.9957 for Gd/MgGa, indicating contrasting reliability of the hybrids at acidic pH. The r1 value at pH 5 was determined to be 7.217 mM−1 s−1 (Fig. 8(b)), showing a dramatically increased r1 value compared with that in a neutral condition. Based on these results, we can expect boosting effects in MRI contrasting in biologically acidic environments such as those in lysosomes43 and cancer cell cytoplasm.44,45
Experimental
Materials
Aluminum nitrate nonahydrate (Al(NO3)3·9H2O), gallium nitrate hydrate (Ga(NO3)3·xH2O), hexadecyltrimethylammonium bromide (CH3(CH2)15N(Br)(CH3)3, CTAB) and diethylenetriaminepentaacetic acid gadolinium(III) dihydrogen salt hydrate (C14H20GdN3O10·xH2O, Gd-DTPA) were purchased from Sigma-Aldrich, Inc. (USA). Magnesium nitrate hexahydrate (Mg(NO3)2·6H2O) was purchased from Junsei Chemical Co., Ltd. (Japan). Sodium hydroxide (NaOH), sodium nitrate (NaNO3) and ethyl alcohol (C2H5OH, absolute grade) were obtained from Daejung Chemicals & Metal Co., Ltd. (Korea). Acetone (C3H6O, extra pure grade) and 1-butanol (C4H10O, extra pure grade) were obtained from Samchun Pure Chemical Co., Ltd. (Korea). Cyclohexane (C6H12, extra pure grade) was purchased from Duksan Company (Korea).Preparation of gadolinium-incorporated LDH, Gd/MgAl and Gd/MgGa
Gadolinium-incorporated LDHs, Gd/MgAl, and Gd/MgGa were synthesized by the conventional reverse micelle method.46 To prepare a microemulsion containing the surfactant, 5 g of CTAB and 7.4 mL of 1-butanol were added into 200 mL of cyclohexane. Three kinds of solutions were prepared: (A) a mixed metal solution (0.012 mol Mg2+ and 0.004 mol of trivalent cation precursors (Al3+ or Ga3+) in 5 mL of deionized water (DW)), (B) anionic solution (0.0025 mol of Gd-DTPA in 5 mL of DW), and (C) alkaline solution (0.02 mol of NaOH in 5 mL of DW). For the deprotonation of Gd-DTPA, the anionic solution B was dropwise titrated by the alkaline solution C until pH ∼ 10. Then, each solution (2.07 mL of A, 5 mL of B and 3 mL of C) was added in sequence into microemulsion with total water/surfactant ratio (w) = 42. After aging for 24 h, the suspension was centrifuged and the precipitate was sequentially washed with water and ethanol mixed solution (1![[thin space (1/6-em)]](https://www.rsc.org/images/entities/char_2009.gif) :
:![[thin space (1/6-em)]](https://www.rsc.org/images/entities/char_2009.gif) 1) at 75 °C for 8 h and with acetone at 50 °C for 8 h. The slurry was dried under ambient conditions for 8 h. For control group samples, MgAl-LDH and MgGa-LDH were prepared by the same reverse-micelle method described above. For MgAl-LDH and MgGa-LDH, the anionic solution B contained NaNO3 instead of Gd-DTPA. Other procedures were carried out using the same method.
1) at 75 °C for 8 h and with acetone at 50 °C for 8 h. The slurry was dried under ambient conditions for 8 h. For control group samples, MgAl-LDH and MgGa-LDH were prepared by the same reverse-micelle method described above. For MgAl-LDH and MgGa-LDH, the anionic solution B contained NaNO3 instead of Gd-DTPA. Other procedures were carried out using the same method.
Characterization
The powder X-ray diffraction (XRD) patterns were obtained to analyse crystallite size and crystal structure of Gd/MgAl, Gd/MgGa with Bruker D2 PHASER, using Ni filtered CuKα radiation (λ = 1.5418 Å) with increments of degree and time step of 0.02° and 0.2 seconds per degree, respectively. The particle morphology and distribution of each component of Gd/MgAl and Gd/MgGa were observed by scanning electron microscopy (SEM) by Quanta 250 FEG. For SEM measurements, powder samples were tenderly spread on the carbon tape. High-resolution transmission electron microscopy (HR-TEM) and energy-dispersive X-ray spectroscopy (EDS) mapping were studied with Titan G2 ChemiSTEM Cs Probe at an accelerating voltage of 200 kV. For TEM measurements, powder samples were embedded in the epoxy resin, ultramicrotomed and then placed on a Ted Pella 200 mesh Cu grid. The surface charge and hydrodynamic radius were analyzed with Otsuka electronics ELSZ-1000. Surface charge was measured at neutral pH. The optimal suspension concentration was 1 mg mL−1 for surface charge and 0.1 mg mL−1 for hydrodynamic radius.Computed tomography (CT)/magnetic resonance imaging (MRI) test
For a CT efficiency test, each Gd/MgAl and Gd/MgGa stock solution was prepared in DW (5 mg mL−1) and then diluted to 4, 3, 2, 1, 0.8, 0.6, 0.4 and 0.2 mg mL−1 to figure out the CT Hounsfield unit. The Hounsfield unit was obtained with Biograph mCT (Siemens Medical Solutions. Inc, USA) operating at 120 kV, 35 mA with 17.55 s scan time.For the MRI test, the sample powder was dispersed in each pH 5 and 7 phosphate buffer solution to make a stock solution with 1 mM of Gd3+ ion concentration (1.6 and 1.3 mg mL−1 of Gd/MgAl and Gd/MgGa, respectively); then, the stock solution was diluted to 0.8, 0.6, 0.4, and 0.2 mM. MRI was measured with Bruker 4.7 T MRI equipped with a 72 mm solenoid coil. MRI images were acquired with a flipped angle of 90°, TR/TE/NEX 100/7.8/1, FOV = 5.4 cm × 7.4 cm, data matrix 128 × 128, slice thickness 1 mm.
Conclusions
We described a nanodiagnostic CA hybrid with a CT/MRI bimodality and switchable MRI contrasting ability. The structure was finely crafted to have a nanorod Gd(OH)3 core and the assembly of LDH platelets as quasi-shells. Furthermore, the size of this CA hybrid was homogeneously controlled below 150 nm through the reverse micelle technique considering the prolonged circulation, facilitated cellular uptake, etc. The obtained CA with Gd(OH)3 and MgGa-LDH composition showed the HU value of ∼180 at 5 mg mL−1, suggesting the possibility of being used as a CT contrast agent. The r1 values of the Gd/MgGa hybrid CA in solutions of pH 7 (neutral plasma conditions) and pH 5 (cancer cell or lysosomal conditions) were 2.9 and 7.2, respectively, exhibiting switch on/off MRI contrasting ability depending on the surrounding physiological environment.Conflicts of interest
There are no conflicts to declare.Acknowledgements
This work was supported by the Dongguk University Research Fund of 2019.Notes and references
- J. K. Willmann, N. van Bruggen, L. M. Dinkelborg and S. S. Gambhir, Nat. Rev. Drug Discovery, 2008, 7, 591 CrossRef CAS PubMed.
- D.-H. Kim, W. Li, J. Chen, Z. Zhang, R. M. Green, S. Huang and A. C. Larson, Sci. Rep., 2016, 6, 29653 CrossRef CAS PubMed.
- G. Wang, W. Gao, X. Zhang and X. Mei, Sci. Rep., 2016, 6, 28258 CrossRef CAS PubMed.
- M. Woods, G. E. Kiefer, S. Bott, A. Castillo-Muzquiz, C. Eshelbrenner, L. Michaudet, K. McMillan, S. D. K. Mudigunda, D. Ogrin, G. Tircsó, S. Zhang, P. Zhao and A. D. Sherry, J. Am. Chem. Soc., 2004, 126, 9248–9256 CrossRef CAS PubMed.
- X. Huang, Y. Yuan, W. Ruan, L. Liu, M. Liu, S. Chen and X. Zhou, J. Nanobiotechnol., 2018, 16, 30 CrossRef PubMed.
- X. Ma, A. Gong, B. Chen, J. Zheng, T. Chen, Z. Shen and A. Wu, Colloids Surf., B, 2015, 126, 44–49 CrossRef CAS PubMed.
- P. Sharma, A. Singh, S. C. Brown, N. Bengtsson, G. A. Walter, S. R. Grobmyer, N. Iwakuma, S. Santra, E. W. Scott and B. M. Moudgil, Cancer Nanotechnology: Methods and Protocols, 2010, vol. 624, pp. 67–81 Search PubMed.
- J. C. De La Vega and U. O. Häfeli, Contrast Media Mol. Imaging, 2015, 10, 81–95 CrossRef CAS PubMed.
- N. Lee, S. H. Choi and T. Hyeon, Adv. Mater., 2013, 25, 2641–2660 CrossRef CAS PubMed.
- H. Lusic and M. W. Grinstaff, Chem. Rev., 2013, 113, 1641–1666 CrossRef CAS PubMed.
- J.-M. Idée and B. Guiu, Crit. Rev. Oncol. Hematol., 2013, 88, 530–549 CrossRef PubMed.
- J. M. Widmark, Baylor University Medical Center Proceedings, 2007, 20, 408–417 CrossRef PubMed.
- N. Hoshyar, S. Gray, H. Han and G. Bao, Nanomedicine, 2016, 11, 673–692 CrossRef CAS PubMed.
- A. L. Bernstein, A. Dhanantwari, M. Jurcova, R. Cheheltani, P. C. Naha, T. Ivanc, E. Shefer and D. P. Cormode, Sci. Rep., 2016, 6, 26177 CrossRef CAS PubMed.
- S. E. Lohse, N. D. Burrows, L. Scarabelli, L. M. Liz-Marzán and C. J. Murphy, Chem. Mater., 2014, 26, 34–43 CrossRef CAS.
- T.-H. Shin, J.-s. Choi, S. Yun, I.-S. Kim, H.-T. Song, Y. Kim, K. I. Park and J. Cheon, ACS Nano, 2014, 8, 3393–3401 CrossRef CAS PubMed.
- H. Lusic and M. W. Grinstaff, Chem. Rev., 2013, 113, 1641–1666 CrossRef CAS PubMed.
- S. Khademi, S. Sarkar, S. Kharrazi, S. M. Amini, A. Shakeri-Zadeh, M. R. Ay and H. Ghadiri, Phys. Med., 2018, 45, 127–133 CrossRef PubMed.
- M. Wu, Z. Li, J. Yao, Z. Shao and X. Chen, ACS Biomater. Sci. Eng., 2019, 5, 4799–4807 CrossRef CAS.
- Z. Wang, T. Jia, Q. Sun, Y. Kuang, B. Liu, M. Xu, H. Zhu, F. He, S. Gai and P. Yang, Biomaterials, 2020, 228, 119569 CrossRef PubMed.
- Y. Wang, F. Zhang, H. Lin and F. Qu, ACS Appl. Mater. Interfaces, 2019, 11, 43964–43975 CrossRef CAS PubMed.
- S. Narayanan, B. N. Sathy, U. Mony, M. Koyakutty, S. V. Nair and D. Menon, ACS Appl. Mater. Interfaces, 2012, 4, 251–260 CrossRef CAS PubMed.
- H. Yim, S.-G. Yang, Y. S. Jeon, I. S. Park, M. Kim, D. H. Lee, Y. H. Bae and K. Na, Biomaterials, 2011, 32, 5187–5194 CrossRef CAS PubMed.
- S. J. Park, J. Y. Park, H. K. Yang and J.-Y. Je, Inorg. Chem. Front., 2017, 4, 1287–1295 RSC.
- J.-M. Oh, S.-J. Choi, S.-T. Kim and J.-H. Choy, Bioconjugate Chem., 2006, 17, 1411–1417 CrossRef CAS PubMed.
- S.-J. Choi, J.-M. Oh and J.-H. Choy, J. Ceram. Soc. Jpn., 2009, 117, 543–549 CrossRef CAS.
- J.-H. Choy, S.-Y. Kwak, Y.-J. Jeong and J.-S. Park, Angew. Chem., Int. Ed., 2000, 39, 4041–4045 CrossRef PubMed.
- Y. Tian, C. Yang, W. Que, Y. He, X. Liu, Y. Luo, X. Yin and L. B. Kong, J. Power Sources, 2017, 369, 78–86 CrossRef CAS.
- S. Ohkuma and B. Poole, Proc. Natl. Acad. Sci. U. S. A., 1978, 75, 3327 CrossRef CAS PubMed.
- J. R. Griffiths, Br. J. Cancer, 1991, 64, 425–427 CrossRef CAS PubMed.
- B. D. Cullity and S. R. Stock, Elements of X-ray Diffraction, Prentice hall, New Jersey, 2001 Search PubMed.
- N. Ullah, M. Imran, K. Liang, C.-Z. Yuan, A. Zeb, N. Jiang, U. Y. Qazi, S. Sahar and A.-W. Xu, Nanoscale, 2017, 9, 13800–13807 RSC.
- L. N. Stepanova, O. B. Belskaya, A. N. Salanov, A. N. Serkova and V. A. Likholobov, Appl. Clay Sci., 2018, 157, 267–273 CrossRef CAS.
- C. Vasti, D. A. Bedoya, R. Rojas and C. E. Giacomelli, J. Mater. Chem. B, 2016, 4, 2008–2016 RSC.
- L. Wang, J. Huang, H. Chen, H. Wu, Y. Xu, Y. Li, H. Yi, Y. A. Wang, L. Yang and H. Mao, ACS Nano, 2017, 11, 4582–4592 CrossRef CAS PubMed.
- A. Verma, O. Uzun, Y. Hu, Y. Hu, H.-S. Han, N. Watson, S. Chen, D. J. Irvine and F. Stellacci, Nat. Mater., 2008, 7, 588 CrossRef CAS PubMed.
- L. Chen, H. Zhong, X. Qi, H. Shao and K. Xu, RSC Adv., 2019, 9, 13220–13233 RSC.
- Y. Liu, G.-F. Tian, X.-W. He, W.-Y. Li and Y.-K. Zhang, J. Mater. Chem. B, 2016, 4, 1276–1283 RSC.
- H. Y. Zhao, S. Liu, J. He, C. C. Pan, H. Li, Z. Y. Zhou, Y. Ding, D. Huo and Y. Hu, Biomaterials, 2015, 51, 194–207 CrossRef CAS PubMed.
- L. E. Cole, R. D. Ross, J. M. Tilley, T. Vargo-Gogola and R. K. Roeder, Nanomedicine, 2015, 10, 321–341 CrossRef CAS PubMed.
- G. Wang, W. Gao, X. Zhang and X. Mei, Sci. Rep., 2016, 6, 28258 CrossRef CAS PubMed.
- L. Faucher, Y. Gossuin, A. Hocq and M.-A. Fortin, Nanotechnology, 2011, 22, 295103 CrossRef PubMed.
- R. K. Draper and M. I. Simon, J. Cell Biol., 1980, 87, 849 CrossRef CAS PubMed.
- P. P. Hsu and D. M. Sabatini, Cell, 2008, 134, 703–707 CrossRef CAS PubMed.
- F. Kallinowski and P. Vaupel, Oxygen Transport to Tissue VIII, 1986, vol. 200, pp. 609–621 Search PubMed.
- J. Zhang, X. Ju, Z. Y. Wu, T. Liu, T. D. Hu, Y. N. Xie and Z. L. Zhang, Chem. Mater., 2001, 13, 4192–4197 CrossRef CAS.
Footnotes |
| † Electronic supplementary information (ESI) available. See DOI: 10.1039/c9ra08159c |
| ‡ Equally contributed to the work reported. |
| This journal is © The Royal Society of Chemistry 2020 |

