 Open Access Article
Modeling the effect of interfacial conductivity between polymer matrix and carbon nanotubes on the electrical conductivity of nanocomposites
Yasser Zare and
Kyong Yop Rhee*
Department of Mechanical Engineering, College of Engineering, Kyung Hee University, Giheung, Yongin, Gyeonggi 446-701, Republic of Korea. E-mail: rheeky@khu.ac.kr; Fax: +82 31 202 6693; Tel: +82 31 201 2565
First published on 2nd January 2020
Abstract
This article presents the role of interfacial conductivity between the polymer matrix and nanoparticles in the electrical conductivity of polymer carbon nanotube (CNT) nanocomposites (PCNT) by simple equations. In this methodology, CNT size, CNT conductivity, CNT waviness and interfacial conductivity express the effective length and effective concentration of CNT in PCNT. Additionally, the percolation threshold and the percentages of CNT in the conductive networks are defined by the above mentioned terms. Finally, a simple model is developed to suggest the electrical conductivity of PCNT by CNT dimensions, CNT conductivity, CNT waviness, interphase thickness, interfacial conductivity and tunneling distance. The developed model is applied to show the roles of all parameters in the conductivity. Also, the experimental levels of percolation threshold and conductivity for several samples are compared to the predictions to validate the developed equations. The interfacial conductivity directly controls the electrical conductivity of nanocomposites. In addition, thick interphase, low waviness and short tunneling distance increase the conductivity. Moreover, the predictions show good agreement with the experimental measurements, providing evidence in support of the developed equations.
1 Introduction
The electromagnetic shielding and electrical conductivity (summarized as conductivity in this paper) of polymer nanocomposites containing carbon nanotubes (CNT) and graphene provide applications in electronics, biomedical tools, sensors, automobile and aerospace industries.1–20 The CNT networks are formed above the percolation threshold, i.e. the percolation threshold is the minimum volume fraction of nanoparticles establishing continuous networks.21,22 The percolation threshold is considered as the volume fraction of conductive nanoparticles in which the conductivity significantly improves, due to the formation of networks.The main mechanism for electrical conductivity of polymer CNT nanocomposites (PCNT) was suggested as electron tunneling in which the charges are transferred by tunneling effect.23,24 So, the adjacent CNT cause the conductivity by electron jumping in the tunneling regions. Additionally, the tunneling effect only depends on the tunneling properties between CNT such as tunneling distance, tunneling resistivity due to insulated polymer layer and contact area.25,26 However, many authors have neglected the dominant tunneling conductivity in PCNT. The electrical conductivity of PCNT depends on many parameters attributed to CNT such as concentration, conductivity, dimensions and waviness.27,28 Moreover, the recent papers have indicated that some parameters such as the network size and interphase properties also affect the conductivity of PCNT.29 Some modeling studies have considered the roles of the latter terms in the conductivity,29–31 but many researches have investigated the percolation threshold and conductivity of PCNT by conventional views. Therefore, the earlier works commonly have not considered the roles of novel terms in the conductivity of nanocomposites.
Many nanocomposites show an inadequate interfacial adhesion between polymer matrix and nanoparticles, which deteriorates the performance of nanocomposites such as modulus, because the poor interfacial regions cannot assign the outstanding properties of nanoparticles to the polymer matrix.32,33 This occurrence is due to the incompatibility or less compatibility between polymer matrix and nanoparticles as well as the poor dispersion and agglomeration of nanofiller in nanocomposites.34–36 The extent of interfacial properties can also control the percolation threshold and conductivity of nanocomposites, because the super conductivity of nanoparticles should be transferred to surrounding polymer matrix. In fact, a strong interfacial adhesion can efficiently assign the filler conductivity to polymer matrix, whereas a poor interface cannot provide it. Therefore, the roles of interfacial adhesion in the percolation threshold and conductivity of nanocomposites are important, although the limited studies in this field have not explained this subject.
In this study, “Lc” term is defined as the minimum length of CNT essential for efficient transferring of conductivity from nanofiller to adjacent polymer matrix. “Lc” is a function of CNT properties and interfacial conductivity, which considers the role of interfacial adhesion in the percolation threshold and conductivity. Also, the effective length and concentration of CNT are expressed by CNT dimensions, CNT conductivity, CNT waviness and interfacial conductivity. Additionally, the percolation threshold and the percentages of CNT in the conductive networks are defined by simple equations assuming the mentioned terms. Finally, a simple model is developed, which can suggest the conductivity of nanocomposites by CNT dimensions, CNT conductivity, CNT waviness, interphase thickness, interfacial conductivity and tunneling distance. The roles of all parameters in the conductivity are expressed and explained using the developed model. Also, the experimental results of percolation threshold and conductivity of some samples are compared to the predictions to validate the developed equations. The developed model can replace the conventional approaches for estimation of conductivity in PCNT.
2 Theoretical expressions
A poor interfacial adhesion cannot stand the high interfacial stress during the stress loading, which causes yielding or failing at or near the interface. In this condition, a high portion of nanotubes is not completely loaded weakening the strengthening effect of nanoparticles.37,38 The role of interfacial adhesion in the conductivity of nanocomposites can be described by the similar attitude. An incomplete interfacial adhesion cannot completely transfer the maximum filler conductivity (σf) to surrounding polymer matrix.“Lc” is the minimum length of CNT, which perfectly transfer the maximum conductivity of CNT to neighboring polymer matrix as:
 | (1) |
The profile of normal conductivity (σ) in a nanotube is exhibited in Fig. 1. When 0 ≤ x ≤ 2Lc (the first condition), the entire length of CNT cannot reach “σf”, but in the second case, “σ” can reach “σf” indicating the effective conductivity transferring from nanofiller to near polymer matrix.
The average normal conductivity (![[small sigma, Greek, macron]](https://www.rsc.org/images/entities/i_char_e0d2.gif) ) is identical to “σf” when CNT are perfectly bonded to polymer matrix; but, “
) is identical to “σf” when CNT are perfectly bonded to polymer matrix; but, “![[small sigma, Greek, macron]](https://www.rsc.org/images/entities/i_char_e0d2.gif) ” is less than “σf” in the case of incomplete interfacial adhesion. So, the effective length of CNT (leff) is assumed as:
” is less than “σf” in the case of incomplete interfacial adhesion. So, the effective length of CNT (leff) is assumed as:
![[small sigma, Greek, macron]](https://www.rsc.org/images/entities/i_char_e0d2.gif) l = σfleff l = σfleff
| (2) |
“leff” and effective filler concentration (ϕeff) in the case of x < 2Lc (case 1) are defined37 as:
 | (3) |
 | (4) |
 | (5) |
 | (6) |
Assuming that the CNT include x < 2Lc and x > 2Lc regions, “leff” and “ϕeff” parameters are expressed assuming the latter equations as:
 | (7) |
 | (8) |
The effective factors are suggested as a function of interfacial conductivity by replacing of “Lc” from eqn (1) into eqn (7) and (8) as:
 | (9) |
 | (10) |
However, the significant length of CNT causes the waviness in nanocomposites,39 which lessens their effectiveness. An equivalent length (leq) as the minimum distance between two ends of each nanotube is considered in a waviness parameter as:
 | (11) |
Also, the waviness deteriorates the nature conductivity of CNT.39 Consequently, the conductivity of waved CNT is expressed by:
 | (12) |
Assuming the waviness parameter in eqn (9) and (10) modifies the effective factors to:
 | (13) |
 | (14) |
However, only a fraction of CNT participates in the conductive networks and others are dispersed in the polymer matrix.
The percentage of networked CNT31 is calculated by:
 | (15) |
When the effective filler fraction (eqn (14)) is substituted into the latter equation, “f” is suggested as:
 | (16) |
| ϕN = fϕeff | (17) |
The percolation threshold of casually dispersed CNT in PCNT was assumed40 by:
 | (18) |
“V” and “Vex” in PCNT were suggested40 as:
| V = πR2l | (19) |
 | (20) |
The interphase layer about CNT can hasten the development of conductive networks in nanocomposites.41–43 Also, the interfacial conductivity and waviness change the effective length of CNT (eqn (13)). As a result, the excluded volume develops by the mentioned terms as:
 | (21) |
The percolation threshold of CNT assuming eqn (19) and (21) into eqn (18) is given by:
 | (22) |
When eqn (14) and (22) are replaced into eqn (16) and (17), the volume fraction of networks is calculated.
Deng and Zheng44 suggested a simple model for conductivity of PCNT as:
 | (23) |
Accordingly, this model is developed for conductivity of PCNT assuming the declared terms as:
 | (24) |
3 Results and discussion
3.1 Parametric analysis
The effects of different parameters on the predicted conductivity by the developed model are expressed and justified in this section. 3D and contour plots demonstrate the roles of two parameters in the conductivity at average values of other factors. The average levels are considered as ϕf = 0.01, R = 10 nm, l = 15 μm, σf = 105 S m−1, u = 1.2, t = 10 nm, k = 400 S m−1 and d = 2 nm.Fig. 2 reveals the influences of “l” and “k” parameters on the conductivity of nanocomposites. The maximum conductivity of 0.025 S m−1 is obtained at l > 27 μm and k > 800 S m−1, but the conductivity approaches to 0 at k = 100 S m−1 or l < 15 μm and k < 290 S m−1. As a result, both “l” and “k” parameters as CNT length and interfacial conductivity directly change the conductivity of nanocomposites and the high levels of these parameters are necessary to increase the conductivity. On the other hand, short CNT and poor interfacial conductivity cannot enhance the conductivity of nanocomposites.
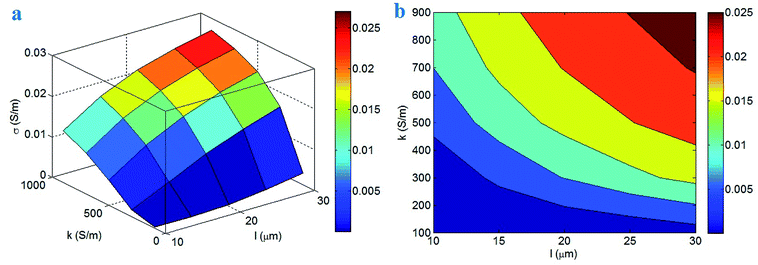 | ||
| Fig. 2 Significances of “l” and “k” parameters on the conductivity of nanocomposites based on the developed model by (a) 3D and (b) contour plots. | ||
The length of CNT affects the effective fraction and percolation threshold of nanofiller in the nanocomposites. The long CNT increase the effective filler concentration and decrease the percolation threshold. So, large CNT produce a high level of “f” (eqn (16)) displaying the large and dense networks in nanocomposite. In fact, the large CNT produce the big conductive networks in the nanocomposites, which effectively improve the conductivity. Therefore, the developed model properly predicts the conductivity at different CNT lengths. Moreover, a high level of interfacial conductivity causes a desirable conductivity, because the filler conductivity can be suitably transferred to the insulated polymer matrix. A high level of “k” decreases the “Lc” term (eqn (1)), which raises the effective concentration (eqn (14)) and effective length (eqn (13)) of CNT. Accordingly, a high level of interfacial conductivity decreases the percolation threshold and enhances the percentages of CNT in the conductive networks. In other words, a high level of interfacial conductivity produces the desirable networks containing CNT and interfacial/interphase regions. According to these evidences, the developed model correctly shows the role of interfacial conductivity in the conductivity of nanocomposites.
Fig. 3 illustrates the roles of “u” and “d” parameters in the conductivity of nanocomposites. The low levels of these parameters significantly improve the conductivity, but the conductivity decreases at high values of “u” and “d”. As observed, the conductivity can reach 0.09 S m−1 at u = 1 and d = 1 nm, but d > 2.3 nm dominantly cause the conductivity of about 0. As a result, low waviness and short tunneling distance increase the conductivity, while the conductivity mainly decreases by large tunneling distance. These results obviously show the detrimental effects of waviness and large tunneling distance on the conductivity of PCNT.
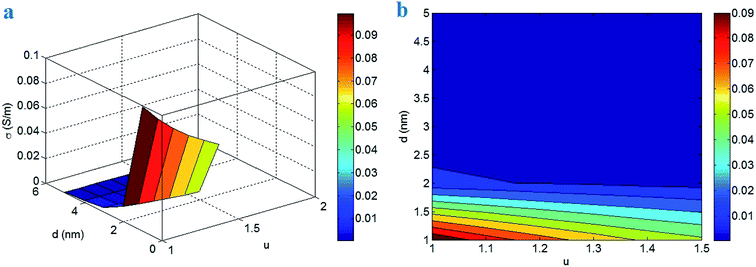 | ||
| Fig. 3 Calculations of conductivity at different levels of “u” and “d” parameters by (a) 3D and (b) contour schemes. | ||
The waviness reduces the equivalent length of CNT in nanocomposites, which undesirably affects the effective CNT length and percolation threshold. So, “f” parameter decreases by waviness causing small networks in nanocomposites. In addition, the nature conductivity of CNT weakens by waviness. As a result, the dimensions and conductivity of networks deteriorate by waviness, which decreases the conductivity of PCNT, as suggested by the developed model. A large tunneling distance also negatively governs the conductivity of nanocomposites, because it decreases the extent of charge transferring thorough tunneling regions. In fact, the electrons cannot pass via large tunneling distance, because the tunneling spaces include the insulated polymer matrix. In other words, a big tunneling distance introduces a high tunneling resistance against the electron transportation, which limits the conductivity of nanocomposites. Other authors also reported the same relation between nanocomposite conductivity and tunneling distance.39,45 So, the developed model properly shows the positive role of short tunneling distance in the conductivity of PCNT.
Fig. 4 depicts the dependencies of conductivity on filler concentration and percolation threshold according to the developed model. ϕf = 0.04 and ϕp = 0.001 produce the highest conductivity of 0.45 S m−1, but the conductivity decreases to about 0 at ϕf < 0.02. Therefore, the conductivity improves by high filler concentration and low percolation threshold, while only low filler concentration can significantly decrease the conductivity. These results are sensible, because these parameters efficiently manipulate the dimensions of conductive networks.
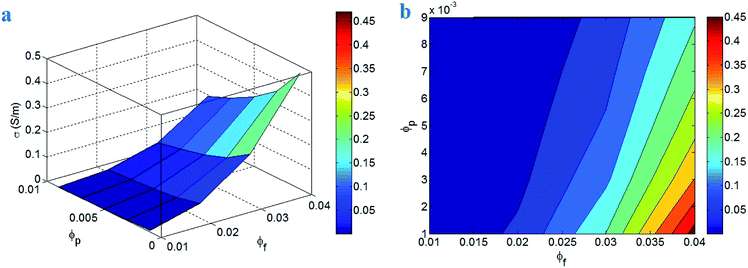 | ||
| Fig. 4 Expression of conductivity at different values of filler concentration and percolation threshold by (a) 3D and (b) contour designs. | ||
A high content of conductive nanoparticles in nanocomposites produces the large networks, which can mainly transfer the electrons and cause the conductivity. However, a low filler concentration creates the small networks, which cannot induce a high conductivity. Moreover, a high filler concentration reduces the tunneling distance in the nanocomposites,46,47 because a large number of nanoparticles produce small inter-particle distance. In addition, a low percolation threshold enhances the percentages of CNT in the conductive networks (eqn (16)). In other words, a poor percolation level contributes a large number of CNT in the networks. However, a high percolation threshold causes the small conductive networks in nanocomposites limiting the conductivity. According to these evidences, the developed model displays the correct outputs at different values of filler concentration and percolation threshold.
Fig. 5 shows the variation of conductivity at dissimilar levels of “σf” and “f” parameters. The maximum value of conductivity as 0.18 S m−1 is observed at σf > 105 S m−1 and f = 0.7, while the conductivity of nanocomposite cannot improve at f < 0.2. As a result, the medium and high levels of CNT conductivity as well as the high percentages of CNT in the networks can mainly improve the conductivity, but a small fraction of CNT in the networks decreases it. In fact, the percentage of CNT in the conductive networks dominantly controls the conductivity of nanocomposites and the CNT conductivity plays a negligible role.
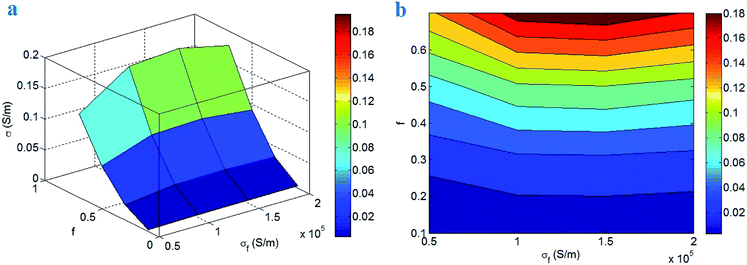 | ||
| Fig. 5 Impacts of “σf” and “f” parameters on the conductivity of nanocomposites by (a) 3D and (b) contour illustrations. | ||
Although the conductivity of nanocomposites directly depends on the filler conductivity (eqn (24)), but the high filler conductivity enlarges the “Lc” term (eqn (1)) assuming imperfect interfacial conductivity. In other words, a high level of CNT conductivity increases the required length of CNT for efficient conductivity transferring. Actually, the high filler conductivity is limitedly transferred to polymer matrix in the case of incomplete interfacial adhesion, which weakens the conductivity of nanocomposites. Accordingly, the filler conductivity insignificantly governs the conductivity, due to the dissimilar roles of this parameter in conductivity transferring and conductivity of networks. However, the conductivity of nanocomposites significantly improves when the big networks are established in the nanocomposites. The networks can provide the charge transportation in nanocomposites and there is a direct correlation between charge transportation and network size.48,49 Therefore, the large networks (high f) can effectively transfer the electrons and improve the conductivity. Based on these explanations, the developed model properly exhibits the roles of “σf” and “f” parameters in the conductivity of PCNT.
Fig. 6 displays the calculations of conductivity at different values of “R” and “t” parameters. The most desirable conductivity of 0.022 S m−1 is achieved by R = 5 nm and t > 16 nm, while the conductivity diminishes to 0 at R > 20 nm. Therefore, the conductivity improves by thin CNT and thick interphase, but only thick CNT can deteriorate the conductivity of nanocomposites. These results indicate that the sizes of CNT and interphase layer surrounding CNT meaningfully govern the conductivity of nanocomposites.
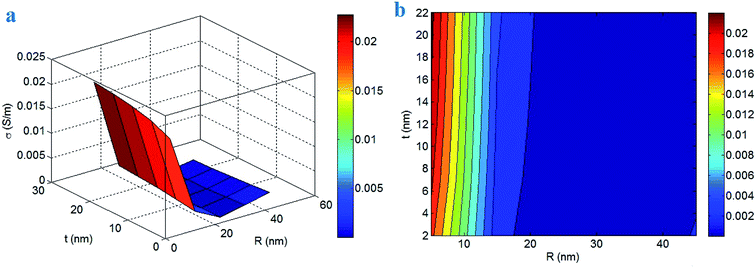 | ||
| Fig. 6 Illustration of the roles of “R” and “t” parameters in the conductivity of nanocomposites by (a) 3D and (b) contour designs. | ||
The thin CNT reduce the level of “Lc” in nanocomposites. It means that thin CNT produce an efficient conductivity transferring between nanoparticles and polymer matrix, which increases the effective filler concentration and effective length. Furthermore, thin CNT drop the percolation threshold. The desirable levels of effective filler concentration, effective length and percolation threshold grow the percentages of CNT in the networks. So, thin CNT can be easily networked in nanocomposites, which improve the conductivity of nanocomposites. Additionally, thick interphase decreases the percolation threshold, because the interphase regions contribute to the conductive networks. As a result, thick interphase increases the dimensions of conductive networks in nanocomposites raising the conductivity. The previous articles also found the direct role of interphase thickness in the percolation threshold.26,50 Conclusively, both “R” and “t” parameters logically control the conductivity of nanocomposites, which validate the developed model.
3.2 Evaluation of predictions by experimental data
The predictions of the developed equations can be compared with the experimental results. The experimental results of percolation threshold and conductivity for four samples including epoxy/single walled CNT (SWCNT) (R = 1 nm, l ≈ 2 μm, u = 1.6 and ϕp = 0.0003)51, polycarbonate (PC)/acrylonitrile butadiene styrene (ABS)/multi walled CNT (MWCNT) (R = 5 nm, l ≈ 1.5 μm, u = 1.2 and ϕp = 0.002),47 poly (vinyl chloride) (PVC)/MWCNT (R = 8 nm, l ≈ 16 μm, u = 1.2 and ϕp = 0.0005)52 and epoxy/MWCNT (R = 8 nm, l ≈ 30 μm, u = 1.2 and ϕp = 0.0002)53 are considered. The values of percolation threshold are compared with eqn (22) to calculate the interphase thickness and interfacial conductivity. The interfacial conductivity changes the “Lc” (σf = 105 S m−1) and the effective length of CNT. Eqn (22) presents the different pairs for “t” and “k”, but we reported the average values for these parameters. In fact, we calculated the different values of these parameters for the samples by eqn (22) and reported the average levels. The average values of (t, k) are calculated as (10, 700), (5, 250), (7, 200) and (2, 280) (nm, S m−1) for epoxy/SWCNT, PC/ABS/MWCNT, PVC/MWCNT and epoxy/MWCNT samples, respectively. Generally, these results demonstrate the proper expression of percolation threshold as a function of filler dimensions, interphase thickness and interfacial conductivity. These outputs also show the formation of different interphase regions in the studied samples. The thickest and the thinnest interphase is observed in epoxy/SWCNT and epoxy/MWCNT samples, respectively. Also, the samples display the different levels for interfacial conductivity depending on the characteristics of interfacial interaction between polymer matrix and nanoparticles. The highest and the lowest levels of interfacial conductivity are obtained for epoxy/SWCNT and PVC/MWCNT nanocomposites, respectively.The calculations of all parameters are considered in the developed model to predict the conductivity of samples at different filler concentrations. Fig. 7 reveals the experimental and theoretical levels of conductivity in epoxy/SWCNT, PC/ABS/MWCNT, PVC/MWCNT and epoxy/MWCNT samples. The predictions show desirable agreement with the experimental results, which approve the developed model. In other words, the calculations of conductivity at different filler concentrations are consistent with the experimental measurements. Therefore, the developed model supposing interfacial conductivity can properly calculate the conductivity of nanocomposites.
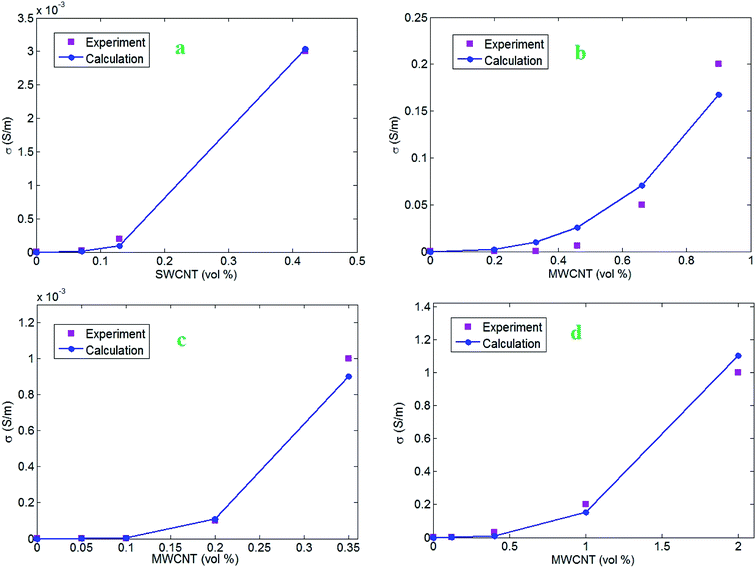 | ||
| Fig. 7 Experimental data of conductivity and the calculations of developed model for (a) epoxy/SWCNT,51 (b) PC/ABS/MWCNT,47 (c) PVC/MWCNT52 and (d) epoxy/MWCNT53 samples. | ||
The values of “d” as tunneling distance are also obtained as 1.3, 0.5, 1.1 and 1 nm for epoxy/SWCNT, PC/ABS/MWCNT, PVC/MWCNT and epoxy/MWCNT nanocomposites, respectively. The shortest and the largest tunneling distance is observed in PC/ABS/MWCNT and epoxy/SWCNT samples, correspondingly. However, these results show a negligible variation in the tunneling distance of reported samples. Conclusively, the developed model can properly calculate the conductivity of nanocomposites assuming the effective parameters for CNT networks, interphase and tunneling regions.
4 Conclusions
A simple model was developed to predict the conductivity of PCNT by CNT dimensions, CNT conductivity, waviness, interphase thickness, interfacial conductivity and tunneling distance. 3D and contour plots expressed the roles of all parameters in the conductivity of PCNT. Also, the experimental results of percolation threshold and conductivity of several samples were compared to the predictions to validate the developed equations. CNT concentration, CNT length, the percentage of CNT in the networks, interfacial conductivity and interphase thickness directly affect the conductivity of nanocomposites. So, the high levels of these parameters are necessary to improve the conductivity. However, thin CNT, low waviness, poor percolation threshold and short tunneling distance can increase the conductivity of PCNT, but the conductivity mainly decreases or an insulated nanocomposite is observed by the high levels of these factors. Additionally, the different levels of CNT conductivity negligibly change the conductivity of PCNT, because it adversely affects the effective length and effective concentration of CNT as well as the conductivity of filler networks. The predictions show desirable agreement with the experimental results of percolation threshold and conductivity. Therefore, the developed equations supposing the interfacial conductivity can appropriately calculate the percolation threshold and conductivity in PCNT.Nomenclature
| σf | CNT conductivity |
| D | CNT diameter |
| R | CNT radius |
| k | Interfacial conductivity |
| σ | Normal conductivity |
![[small sigma, Greek, macron]](https://www.rsc.org/images/entities/i_char_e0d2.gif) | Average normal conductivity |
| l | CNT length |
| leff | Effective length of CNT |
| ϕeff | Effective CNT concentration |
| ϕf | Volume fraction of CNT |
| leq | Equivalent length |
| u | Waviness parameter |
| f | The percentage of networked CNT |
| ϕp | Percolation threshold of CNT |
| ϕN | The volume fraction of networked CNT |
| V | CNT volume |
| Vex | Excluded volume of CNT |
| t | Interphase thickness |
| σ0 | The conductivity of polymer matrix |
| d | Tunneling distance between adjacent CNT |
| z | Tunneling parameter |
Conflicts of interest
There are no conflicts to declare.References
- Y. Hu, P. Tang, L. Li, J. Yang, X. Jian and Y. Bin, High absorption shielding material of poly (phthalazinone etherketone)/multiwall carbon nanotube composite films with sandwich configurations, RSC Adv., 2019, 9, 18758–18766 RSC.
- K. Silakaew and P. Thongbai, Significantly improved dielectric properties of multiwall carbon nanotube-BaTiO 3/PVDF polymer composites by tuning the particle size of the ceramic filler, RSC Adv., 2019, 9, 23498–23507 RSC.
- R. Ma, G. Mu, H. Zhang, J. Liu, Y. Gao, X. Zhao and L. Zhang, Percolation analysis of the electrical conductive network in a polymer nanocomposite by nanorod functionalization, RSC Adv., 2019, 9, 36324–36333 RSC.
- O. Saber, A. Aljaafari, A. Alshoaibi and A. Osama, A low-temperature technique and new strategy for the dual growth of carbon nanotubes and nanorods through the confinement of explosive materials inside a porous structure, RSC Adv., 2019, 9, 30509–30518 RSC.
- Y. Zare and K. Y. Rhee, Expression of normal stress difference and relaxation modulus for ternary nanocomposites containing biodegradable polymers and carbon nanotubes by storage and loss modulus data, Composites, Part B, 2019, 158, 162–168 CrossRef CAS.
- Y. Zare and K. Y. Rhee, Modeling of viscosity and complex modulus for poly (lactic acid)/poly (ethylene oxide)/carbon nanotubes nanocomposites assuming yield stress and network breaking time, Composites, Part B, 2019, 156, 100–107 CrossRef CAS.
- A. Rostami, F. Eskandari, M. Masoomi and M. Nowrouzi, Evolution of Microstructure and Physical Properties of PMMA/MWCNTs Nanocomposites upon the Addition of Organoclay, Journal of Oil, Gas and Petrochemical Technology, 2019 Search PubMed , accepted.
- A. Rostami and M. I. Moosavi, High-performance thermoplastic polyurethane nanocomposites induced by hybrid application of functionalized graphene and carbon nanotubes, J. Appl. Polym. Sci., 2019, 48520 CrossRef.
- Y. Zhang, K. Y. Rhee and S.-J. Park, Nanodiamond nanocluster-decorated graphene oxide/epoxy nanocomposites with enhanced mechanical behavior and thermal stability, Composites, Part B, 2017, 114, 111–120 CrossRef CAS.
- S. Shi, Y. Chen, J. Jing and L. Yang, Preparation and 3D-printing of highly conductive polylactic acid/carbon nanotube nanocomposites via local enrichment strategy, RSC Adv., 2019, 9, 29980–29986 RSC.
- H. Wang, Z. Li, K. Hong, M. Chen, Z. Qiao, Z. Yuan and Z. Wang, Property improvement of multi-walled carbon nanotubes/polypropylene composites with high filler loading via interfacial modification, RSC Adv., 2019, 9, 29087–29096 RSC.
- Y. Zare, S. P. Park and K. Y. Rhee, Analysis of complex viscosity and shear thinning behavior in poly (lactic acid)/poly (ethylene oxide)/carbon nanotubes biosensor based on Carreau–Yasuda model, Results Phys., 2019, 13, 102245 CrossRef.
- A. H. Z. Kalkhoran, O. Vahidi and S. M. Naghib, A new mathematical approach to predict the actual drug release from hydrogels, Eur. J. Pharm. Sci., 2018, 111, 303–310 CrossRef PubMed.
- S. M. Naghib, E. Parnian, H. Keshvari, E. Omidinia and M. Eshghan-Malek, Synthesis, characterization and electrochemical evaluation of polyvinylalchol/graphene oxide/silver nanocomposites for glucose biosensing application, Int. J. Electrochem. Sci., 2018, 13, 1013–1026 CrossRef CAS.
- Y. Zhang and S.-J. Park, Influence of the nanoscaled hybrid based on nanodiamond@ graphene oxide architecture on the rheological and thermo-physical performances of carboxylated-polymeric composites, Composites, Part A, 2018, 112, 356–364 CrossRef CAS.
- A. Roy, S. Dhibar, S. Kundu and S. Malik, Covalently linked benzimidazole-containing reduced graphene oxide/polyaniline nanocomposites as electrode materials, RSC Adv., 2019, 9, 24646–24653 RSC.
- J. Bhadra, A. Popelka, A. Abdulkareem, Z. Ahmad, F. Touati and N. Al-Thani, Fabrication of polyaniline–graphene/polystyrene nanocomposites for flexible gas sensors, RSC Adv., 2019, 9, 12496–12506 RSC.
- S. K. Krishnan, E. Singh, P. Singh, M. Meyyappan and H. S. Nalwa, A review on graphene-based nanocomposites for electrochemical and fluorescent biosensors, RSC Adv., 2019, 9, 8778–8881 RSC.
- R. Salahandish, A. Ghaffarinejad, S. M. Naghib, A. Niyazi, K. Majidzadeh-A, M. Janmaleki and A. Sanati-Nezhad, Sandwich-structured nanoparticles-grafted functionalized graphene based 3D nanocomposites for high-performance biosensors to detect ascorbic acid biomolecule, Sci. Rep., 2019, 9, 1226 CrossRef PubMed.
- E. Askari and S. M. Naghib, A novel approach to facile synthesis and biosensing of the protein-regulated graphene, Int. J. Electrochem. Sci., 2018, 13, 886–897 CrossRef CAS.
- Y. Zare and K. Y. Rhee, Simplification and development of McLachlan model for electrical conductivity of polymer carbon nanotubes nanocomposites assuming the networking of interphase regions, Composites, Part B, 2019, 156, 64–71 CrossRef CAS.
- Y. Zare and K. Rhee, Evaluation and Development of Expanded Equations Based on Takayanagi Model for Tensile Modulus of Polymer Nanocomposites Assuming the Formation of Percolating Networks, Phys. Mesomech., 2018, 21, 351–357 CrossRef.
- F. Du, R. C. Scogna, W. Zhou, S. Brand, J. E. Fischer and K. I. Winey, Nanotube networks in polymer nanocomposites: rheology and electrical conductivity, Macromolecules, 2004, 37, 9048–9055 CrossRef CAS.
- C. Li, E. T. Thostenson and T.-W. Chou, Dominant role of tunneling resistance in the electrical conductivity of carbon nanotube–based composites, Appl. Phys. Lett., 2007, 91, 223114 CrossRef.
- S. Kim, Y. Zare, H. Garmabi and K. Y. Rhee, Variations of tunneling properties in poly (lactic acid)(PLA)/poly (ethylene oxide)(PEO)/carbon nanotubes (CNT) nanocomposites during hydrolytic degradation, Sens. Actuators, A, 2018, 274, 28–36 CrossRef CAS.
- R. Razavi, Y. Zare and K. Y. Rhee, The roles of interphase and filler dimensions in the properties of tunneling spaces between CNT in polymer nanocomposites, Polym. Compos., 2019, 40, 801–810 CrossRef CAS.
- M. Mohiuddin and S. V. Hoa, Estimation of contact resistance and its effect on electrical conductivity of CNT/PEEK composites, Compos. Sci. Technol., 2013, 79, 42–48 CrossRef CAS.
- C. J. Lee, R. Salehiyan, D. S. Ham, S. K. Cho, S.-J. Lee, K. J. Kim, Y. Yoo, K. Hyun, J. H. Lee and W. J. Choi, Influence of carbon nanotubes localization and transfer on electrical conductivity in PA66/(PS/PPE)/CNTs nanocomposites, Polymer, 2016, 84, 198–208 CrossRef CAS.
- Y. Zare and K. Y. Rhee, Development of a conventional model to predict the electrical conductivity of polymer/carbon nanotubes nanocomposites by interphase, waviness and contact effects, Composites, Part A, 2017, 100, 305–312 CrossRef CAS.
- T. Takeda, Y. Shindo, Y. Kuronuma and F. Narita, Modeling and characterization of the electrical conductivity of carbon nanotube-based polymer composites, Polymer, 2011, 52, 3852–3856 CrossRef CAS.
- C. Feng and L. Jiang, Micromechanics modeling of the electrical conductivity of carbon nanotube (CNT)–polymer nanocomposites, Composites, Part A, 2013, 47, 143–149 CrossRef CAS.
- W. Peng, S. Rhim, Y. Zare and K. Y. Rhee, Effect of “Z” factor for strength of interphase layers on the tensile strength of polymer nanocomposites, Polym. Compos., 2019, 40, 1117–1122 CrossRef CAS.
- Y. Zare and K. Y. Rhee, Evaluation of the Tensile Strength in Carbon Nanotube-Reinforced Nanocomposites Using the Expanded Takayanagi Model, JOM, 2019, 1–9 CAS.
- D. N. Bikiaris, A. Vassiliou, E. Pavlidou and G. P. Karayannidis, Compatibilisation effect of PP-g-MA copolymer on iPP/SiO 2 nanocomposites prepared by melt mixing, Eur. Polym. J., 2005, 41, 1965–1978 CrossRef CAS.
- Z. M. Ishak, W. Chow and T. Takeichi, Compatibilizing effect of SEBS-g-MA on the mechanical properties of different types of OMMT filled polyamide 6/polypropylene nanocomposites, Composites, Part A, 2008, 39, 1802–1814 CrossRef.
- Y. Zare and K. Y. Rhee, Effects of interphase regions and filler networks on the viscosity of PLA/PEO/carbon nanotubes biosensor, Polym. Compos., 2019, 40, 4135–4141 CrossRef CAS.
- D. Shia, C. Hui, S. Burnside and E. Giannelis, An interface model for the prediction of Young's modulus of layered silicate-elastomer nanocomposites, Polym. Compos., 1998, 19, 608–617 CrossRef CAS.
- Y. Zare, K. Y. Rhee and S.-J. Park, A modeling methodology to investigate the effect of interfacial adhesion on the yield strength of MMT reinforced nanocomposites, J. Ind. Eng. Chem., 2019, 69, 331–337 CrossRef CAS.
- Y. Zare, K. Y. Rhee and S.-J. Park, A developed equation for electrical conductivity of polymer carbon nanotubes (CNT) nanocomposites based on Halpin-Tsai model, Results Phys., 2019, 102406 CrossRef.
- L. Berhan and A. Sastry, Modeling percolation in high-aspect-ratio fiber systems. I. Soft-core versus hard-core models, Phys. Rev. E: Stat., Nonlinear, Soft Matter Phys., 2007, 75, 041120 CrossRef CAS PubMed.
- Y. Zare, S. Rhim, H. Garmabi and K. Y. Rhee, A simple model for constant storage modulus of poly (lactic acid)/poly (ethylene oxide)/carbon nanotubes nanocomposites at low frequencies assuming the properties of interphase regions and networks, J. Mech. Behav. Biomed. Mater., 2018, 80, 164–170 CrossRef CAS PubMed.
- Y. Zare and K. Y. Rhee, Tensile strength prediction of carbon nanotube reinforced composites by expansion of cross-orthogonal skeleton structure, Composites, Part B, 2019, 161, 601–607 CrossRef CAS.
- R. Qiao and L. C. Brinson, Simulation of interphase percolation and gradients in polymer nanocomposites, Compos. Sci. Technol., 2009, 69, 491–499 CrossRef CAS.
- F. Deng and Q.-S. Zheng, An analytical model of effective electrical conductivity of carbon nanotube composites, Appl. Phys. Lett., 2008, 92, 071902 CrossRef.
- Y. Zare, K. Y. Rhee and S.-J. Park, Modeling the roles of carbon nanotubes and interphase dimensions in the conductivity of nanocomposites, Results Phys., 2019, 15, 102562 CrossRef.
- S. Maiti, S. Suin, N. K. Shrivastava and B. Khatua, Low percolation threshold in polycarbonate/multiwalled carbon nanotubes nanocomposites through melt blending with poly (butylene terephthalate), J. Appl. Polym. Sci., 2013, 130, 543–553 CrossRef CAS.
- S. Maiti, N. K. Shrivastava and B. Khatua, Reduction of percolation threshold through double percolation in melt-blended polycarbonate/acrylonitrile butadiene styrene/multiwall carbon nanotubes elastomer nanocomposites, Polym. Compos., 2013, 34, 570–579 CrossRef CAS.
- F. Dalmas, R. Dendievel, L. Chazeau, J.-Y. Cavaillé and C. Gauthier, Carbon nanotube-filled polymer composites. Numerical simulation of electrical conductivity in three-dimensional entangled fibrous networks, Acta Mater., 2006, 54, 2923–2931 CrossRef CAS.
- M. H. Al-Saleh, Influence of conductive network structure on the EMI shielding and electrical percolation of carbon nanotube/polymer nanocomposites, Synth. Met., 2015, 205, 78–84 CrossRef CAS.
- Y. Zare and K. Y. Rhee, Significances of interphase conductivity and tunneling resistance on the conductivity of carbon nanotubes nanocomposites, Polym. Compos. Search PubMed , in press.
- F. H. Gojny, M. H. Wichmann, B. Fiedler, I. A. Kinloch, W. Bauhofer, A. H. Windle and K. Schulte, Evaluation and identification of electrical and thermal conduction mechanisms in carbon nanotube/epoxy composites, Polymer, 2006, 47, 2036–2045 CrossRef CAS.
- Y. Mamunya, A. Boudenne, N. Lebovka, L. Ibos, Y. Candau and M. Lisunova, Electrical and thermophysical behaviour of PVC-MWCNT nanocomposites, Compos. Sci. Technol., 2008, 68, 1981–1988 CrossRef CAS.
- Y. J. Kim, T. S. Shin, H. Do Choi, J. H. Kwon, Y.-C. Chung and H. G. Yoon, Electrical conductivity of chemically modified multiwalled carbon nanotube/epoxy composites, Carbon, 2005, 43, 23–30 CrossRef CAS.
| This journal is © The Royal Society of Chemistry 2020 |

