DOI:
10.1039/C9RA08629C
(Paper)
RSC Adv., 2020,
10, 2944-2951
Platinized agarose microspheres as a new modifier in graphite paste electrodes for the electrochemical determination of 4-aminophenol
Received
22nd October 2019
, Accepted 15th December 2019
First published on 16th January 2020
Abstract
In the environment, 4-aminophenol (4-AP) is present as a highly toxic compound and water pollutant. In this study, platinized agarose microspheres (PtAM) were used for the first time, for the preparation of a novel, modified graphite paste electrode (GPE/PtAM) for the electrochemical determination of 4-AP. PtAM was characterized using transmission electron microscopy, field emission scanning electron microscopy and energy dispersive X-ray analysis. The electrochemical response characteristics of GPE/PtAM towards 4-AP were investigated via electrochemical impedance spectroscopy, cyclic voltammetry, differential pulse voltammetry and chronoamperometry. The value of the charge transfer resistance obtained for GPE/PtAM was 27.3 Ω. Microscopic surface areas and the surface concentration of the electroactive species for GPE/PtAM were calculated to be 0.077 cm2 and 1.13 × 10⁻³ mol cm−2, respectively. The electron transfer coefficient, diffusion coefficient and standard heterogeneous rate constants of 4-AP were calculated as 0.274, 4.56 × 10⁻⁴ cm2 s−1, and 3.32 × 10⁻¹ cm s−1, respectively. The influence of pH on the oxidation of 4-AP was investigated and a pH value of 2.0 (using a phosphate buffer solution) was selected as the optimum pH. Under optimum conditions, the calibration was linear between 0.8 and 87 μM with a detection limit of 45 nM. Moreover, GPE/PtAM was applied to determine the concentrations of 4-AP in water samples with satisfactory results.
1 Introduction
Phenol compounds such as aminophenols are dangerous environmental contaminants which are used extensively as industrial raw or processed materials in cosmetics, photograph development, dyestuffs, chemical inhibitors, and petroleum additives. Most of them can remain in the environment for a long time with high toxicity and carcinogenicity, because of their stability and bio-accumulation. Among them, 4-AP is also used in the pharmaceutical industry for the production of paracetamol, but it is highly toxic. The maximum content of 4-AP in pharmaceuticals is limited to 50 ppm (0.005%, w/w) by the standards of the European, United States, and Chinese pharmacopoeias.1 Phenols are ubiquitous environmental pollutants.2 In particular, 4-AP is considered to be one of priority toxic pollutants.3 Therefore, it is necessary to develop simple and reliable methods for determination of 4-AP, for environmental protection and food security. Many attempts, therefore, have been made to develop an efficient and selective way of determining 4-AP, such as liquid chromatography,4,5 spectrophotometry,6 sequential injection analysis,7 capillary electrophoresis,8 and micellar electrokinetic chromatography.9 However, use of these techniques suffer because they are expensive and have a long analysis time. An electrochemical technique, with a low cost, simplicity, and high selectivity and sensitivity, is a desired method for 4-AP detection. Different electrodes have been made to identify and measure aminophenol.1,10–13 An agarose is a polysaccharide polymer material, commonly extracted from seaweed (Scheme 1). Agarose, a kind of natural polysaccharide, has been widely used for immobilization of enzymes, antibodies and chemical molecules due to its attractive properties of excellent film-forming ability, biocompatibility, non-toxicity, high mechanical strength and inexpensiveness.14–16 Agarose is an ideal biopolymer to use for immobilization of materials on solid substrates. Its application in direct electrochemistry was reported previously.17 Metal nanoparticles such as platinum nanoparticles (PtNPs) offer a wide range of chemo-physical properties that can be of interest for many technological applications due to their catalytic activity, electrochemical applications, and chemical sensing.18 So, Pt is used in electrochemical measurements.19,20 In previous research, Pt or its composite with different supports were used for oxidation of low molecular fuels and in fuel cells.21–24 In the present study, platinized agarose microspheres (PtAM) were used for the first-time as a novel modifier for the preparation of a modified graphite paste electrode for the electrochemical determination of 4-AP. As far as is known, no previous study has reported using PtAM in any electrochemical determination. Platinized microspheres can act as tiny conduction centers to facilitate electron transfer by giving more freedom to the immobilized biomolecules, which brings the active sites closer to the electrode surface.25,26 This polymer is a bio-molecular polymer with a high mechanical strength and has been used for sensitive and selective determination of these analytes.27 The results showed low detection limits and excellent selectivity. In addition, the proposed method was successfully applied for the determination of 4-AP in water samples.
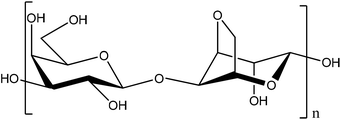 |
| | Scheme 1 The structure of agarose. | |
2 Experimental
2.1. Reagents
Agarose, 4-AP, ethanol, hexachloroplatinic acid hexahydrate, hydrazine hydrochloride, sodium hydroxide, hydrogen chloride, phosphoric acid, potassium dihydrogen phosphite, potassium hydrogen phosphite, graphite powder and paraffin oil were purchased from the Merck Company. All reagents were analytical grade and were used as received without any purification. All solutions were prepared with ultra-pure Milli-Q water (UPM-Q) with a resistivity of 18.2 mW cm and purged with pure nitrogen gas (99.999%) before the investigations.
2.2. Apparatus
Cyclic voltammetry (CV), and differential pulse voltammetry (DPV) were carried out on a potentiostat/galvanostat (SAMA 500 electroanalyzer system, Iran) with a three-electrode system that use a modified electrode as the working electrode, a Pt electrode as the counter electrode and a saturated calomel electrode as the reference electrode. Electrochemical impedance spectroscopy (ESI) was performed with a potentiostat/galvanostat (Autolab/PGSTAT128N, Eco Chemie, Netherlands) controlled by NOVA 1.11 software (Metrohm Autolab). Electrochemical impedance measurements were performed in 5 mM [Fe(CN)6]3−/4− prepared in 0.1 M KCl. The EIS was performed over a frequency range of 10 kHz to 0.1 Hz with a 10 mV amplitude and it was superimposed on the formal potential of the redox probe ( when Dox = Dred) which was calculated from the cyclic voltammograms. The field emission scanning electron microscopy (FESEM) was carried out using an electron microscope (MIRA3, Tescan) and energy dispersive X-ray analysis (EDX) was carried out using an electron microscope (SAMx, France). Transmission electron microscopy (TEM) images were taken using a transmission electron microscope (CM120, Philips) with 2.5 Å resolution. The pH measurements were made using a pH meter (model 744, Metrohm). All experiments were performed at room temperature (RT).
2.3. Preparation of experimental solutions
The solution of Pt4+ (0.01 M) was prepared by dissolving the hexachloroplatinic acid hexahydrate in UPM-Q. The hydrazine solution (0.01 M) was prepared by dissolving hydrazine in UPM-Q. The stock solutions of 4-AP (0.01 M) were prepared by dissolving the solid in a small volume of 0.1 mol L−1 ethanol solution then diluted with UPM-Q to give the final concentration. Phosphate buffer solution (PBS) was prepared from phosphoric acid (0.2 M), and the pH range was adjusted to 2.0–9.0 with 0.2 M phosphoric acid and 0.2 M sodium hydroxide solutions and these PBS solutions were used as the supporting electrolytes. All experiments were performed under a nitrogen atmosphere at RT.
2.4. Preparation of a modified graphite paste electrode with PtAM
The PtAM was prepared by mixing 0.09 g agarose with 2.5 ml of a 0.01 M Pt4+ solution. The mixture was stirred for 20 min and then a solution of 0.01 M hydrazine was added to this mixture at RT. With addition of hydrazine, the solution color changed from orange to black, which represented a reduction of the platinum ions to platinum (eqn (1)). The platinum atoms sit around the hydroxyl agarose groups, which caused nucleation and lead to the small, spherical nanoparticles shown in Fig. 1.| | |
Pt4+ + N2H5+ → Pt + N2 + 5H+
| (1) |
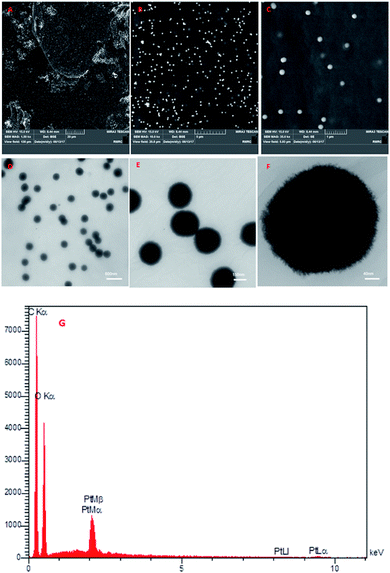 |
| | Fig. 1 (A–C) FESEM images of PtAM, (D–F) TEM images of PtAM, and (G) EDX analysis of PtAM. | |
Then PtAM solution was centrifuged, and the black precipitate was washed with deionized water and air dried for 24 h. The GPE/PtAM was prepared by mixing 0.006 g of PtAM, 0.194 g of graphite powder and 0.4 mL paraffin oil using a mortar and pestle. The mixture was ground for 20 min until a uniform paste was obtained. The resulting paste was then inserted into the bottom of a glass tube with an internal diameter of 4 mm and a length of 8 cm. Electrical connection was implemented by a copper wire lead fitted into the glassy tube. When necessary, a new surface was obtained by pushing some of the paste out of the tube and polishing the end with a weighing paper. Moreover, the GPE/A was prepared in the same way without adding Pt to the mixture and unmodified GPE was prepared in the same way without adding PtAM to the mixture. These GPEs were used for comparison with the GPE/PtAM.
3 Results and discussion
3.1. Morphological and energy dispersive X-ray analysis of the PtAM
The morphology of PtAM was appraised using FESEM and TEM and the results are shown in Fig. 1. From Fig. 1, the FESEM (Fig. 1A–C) and TEM (Fig. 1D–F) images of PtAM show that the mono dispersible microspheres were indeed microspherical in shape. The EDX data for PtAM revealed the presence of the expected elements, namely C, O and Pt, in the structure of PtAM (Fig. 1G). Based on the EDX and TEM results, the platinum particles were present, and doped and dispersed in the agarose microspheres with a size between 150 and 200 nm.
3.2. Electrochemical impedance spectroscopy (ESI) study
Fig. 2A shows the CVs of GPE, GPE/A and GPE/PtAM in 0.1 M KCl containing 5 mM Fe(CN)63−/4−. The CV of GPE showed a ΔEP(EPa − EPc) of 0.638 V and oxidation and reduction peak currents of 7.11 μA and −7.83 μA, respectively, and the CV of GPE/A showed ΔEP of 0.274 V and oxidation and reduction peak currents of 8.67 μA and −9.65 μA, respectively. Comparatively, the GPE/PtAM showed ΔEP of 0.104 V and oxidation and reduction peak currents of 11.75 and −14.11 μA, respectively. This decrease in the ΔEp and increase in the peak currents of the GPE/PtAM compared to GPE were due to the electrocatalytic activity of the hydroxyl groups which were free and unreacted in the agarose and the presence of the hydroxyl groups functionalization with Pt on the surface agarose via electrochemical reactions. Supporting evidence for this modified electrode was found from the EIS study, which is a powerful technique for studying electrode–electrolyte interfacial features. As shown in Fig. 2B, the Nyquist plots of these electrodes comprise two parts, one semicircle at higher frequencies which indicated charge transfer limitations and its diameter was equal to the charge transfer resistance (Rct) whereas the second part of the Nyquist plot was a straight line which appeared in low frequencies and indicated the mass transfer limitations.28 The NOVA software was used for fitting and simulation of the EIS data whereas the modified Randles equivalent circuit, which is illustrated in the inset of Fig. 2B was selected as the equivalent circuit for fitting and simulation of the EIS data. The lower value of Rct shows the easier electron transfer between the electrode surface and the probe ions (Fe(CN)63−/4−). The values of Rct obtained for GPE, GPE/A and GPE/PtAM were: 128.42, 53.96 and 27.32 Ω, respectively. The lower value of Rct for GPE/PtAM compared to GPE was attributed to the electrocatalytic activity of the hydroxyl functional groups in agarose and the presence of Pt.
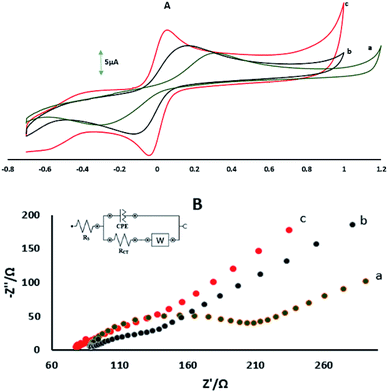 |
| | Fig. 2 (A) CVs of (a) GPE, (b) GPE/A, and (c) GPE/PtAM in 1 mM Fe(CN)63−/4− prepared in 0.1 M KCl, measured at a scan rate 100 mV s−1. (B) Nyquist plots showing the step-wise modification of (a) GPE, (b) GPE/A and (c) GPE/PtAM. Electrochemical measurements were performed in 10 mM Fe(CN)63−/4− prepared in 0.1 M KCl. The EIS data was obtained over a frequency range of 0.1 Hz to 10 kHz. The inset shows the equivalent circuit. CPE: constant phase element, Rct: charge transfer resistance, Rs: solution resistance, and W: Warburg element. | |
3.3. Electrochemical behaviour of the electrodes
The microscopic surface areas of GPE, GPE/A and GPE/PtAM were determined by using the Randles–Sevcik equation:29| | |
IPa = 2.96 × 10⁵n3/2AC0DR1/2ν1/2
| (2) |
where IPa (μA) is the anodic peak current, n is the number of transferring electrons, A is the microscopic area (cm2), C0 (mM) is the bulk concentration of the probe ion, DR is the diffusion coefficient (cm2 s−1) and ν (V s−1) is the scan rate. For 1 mM Fe(CN)63−/4− in 0.1 M KCl the number of transferring electrons equals one (n = 1) and DR = 7.6 cm2 s−1.30 Fig. 3 shows the CVs and the plots of IPa vs. ν1/2 for GPE, GPE/A and GPE/PtAM in the presence of 1 mM of Fe(CN)63−/4− in 0.1 M of KCl supporting electrolyte. From the slopes of the trend lines, the microscopic surface areas obtained were: 0.035, 0.042 and 0.077 cm2 for GPE, GPE/A and GPE/PtAM, respectively. The highest microscopic surface area for GPE/PtAM was due to the presence of Pt in the microspheres. Fig. 4 shows the CVs in PBS of pH 2.0 for GPE, GPE/A and GPE/PtAM. For GPE/PtAM the field current was greater than that of both GPE/A and GPE. Fig. 4c shows the oxidation and reduction peaks of platinum.31 An approximate amount of the electroactive species31 can be estimated by the Sharp equation.32 The peak current is related to the surface concentration of electroactive species, Γ, by eqn (3):where n represents the number of electrons involved in the reaction, A is the geometric surface area of the electrode (0.1256 cm2), Γ is the surface concentration of the electroactive species (mol cm−2), ν is the scan rate (V s−1), R (8.314 J mol−1 K−1), F (96![[thin space (1/6-em)]](https://www.rsc.org/images/entities/char_2009.gif) 485 C mol−1) and T (298 K) denote the gas constant, the Faraday constant, and the temperature, respectively. From the slope of the plot of the anodic peak currents vs. scan rates, the surface concentration of electroactive species for the GPE/PtAM was calculated to be 2.8 × 10⁻⁴ mol cm−2 for n = 2 (see Fig. 5).
485 C mol−1) and T (298 K) denote the gas constant, the Faraday constant, and the temperature, respectively. From the slope of the plot of the anodic peak currents vs. scan rates, the surface concentration of electroactive species for the GPE/PtAM was calculated to be 2.8 × 10⁻⁴ mol cm−2 for n = 2 (see Fig. 5).
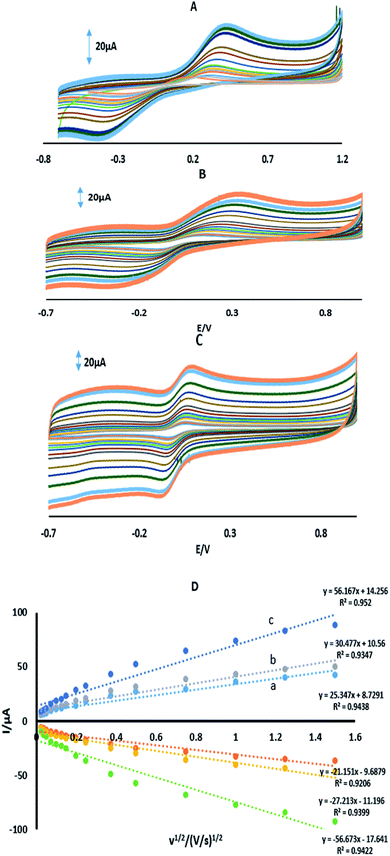 |
| | Fig. 3 CVs of (A) GPE, (B) GPE/A, and (C) GPE/PtAM in 1 mM Fe(CN)63−/4− prepared in 0.1 M KCl, and (D) the plot of peak current vs. the square root of scan rate for (a) GPE, (b) GPE/A and (c) GPE/PtAM. | |
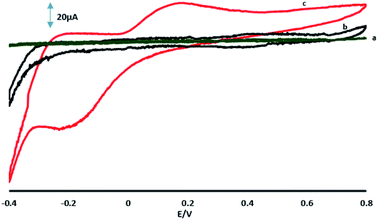 |
| | Fig. 4 CVs measured in PBS with a pH of 2.0: (a) GPE, (b) GPE/A and (c) GPE/PtAM. | |
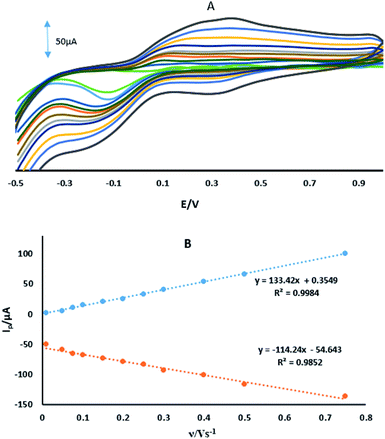 |
| | Fig. 5 (A) CVs of GPE/PtAM at different scan rates of 0.01, 0.05, 0.075, 0.1, 0.15, 0.2, 0.25, 0.3, 0.4, 0.5 and 0.75 V s−1. (B) Variation of Ip vs. the ν. | |
3.4. Electrochemical behavior of 4-AP at different electrodes
Fig. 6A shows the CVs of 70 μM 4-AP at the surface of GPE, GPE/A and GPE/PtAM in PBS at pH 2.0. Based on the results for the electrodes, there was a higher peak current with a lower oxidation potential for 4-AP at the surface of GPE/PtAM, so GPE/PtAM was selected for the determination of 4-AP. The effect of scan rate on the electrochemical oxidation of 4-AP at GPE/PtAM was investigated by CV (Fig. 6B). Based on the results shown in this figure, the oxidation peak potentials for 4-AP were shifted to positive values with increasing scan rates, confirming the kinetic limitations of the electrochemical reaction. The plot of EP vs. ln(v) was a straight line with a slope:33| |
 | (4) |
where α stands for the electron transfer coefficient, and the slope form plot EP vs. ln(ν) for 4-AP was 0.0354 V (Fig. 6C). The α value for n = 1 and T = 298 K was calculated to be 0.274 for 4-AP. A linear increase in anodic peak current was observed with the increase in scan rate. A straight-line graph was obtained when the logarithms of the peak currents were plotted against the logarithms of the scan rates (Fig. 6D).| |
log![[thin space (1/6-em)]](https://www.rsc.org/images/entities/char_2009.gif) IPa (μA) = 0.6594 IPa (μA) = 0.6594![[thin space (1/6-em)]](https://www.rsc.org/images/entities/char_2009.gif) log log![[thin space (1/6-em)]](https://www.rsc.org/images/entities/char_2009.gif) ν + 0.5984 (R2 = 0.9789) ν + 0.5984 (R2 = 0.9789)
| (5) |
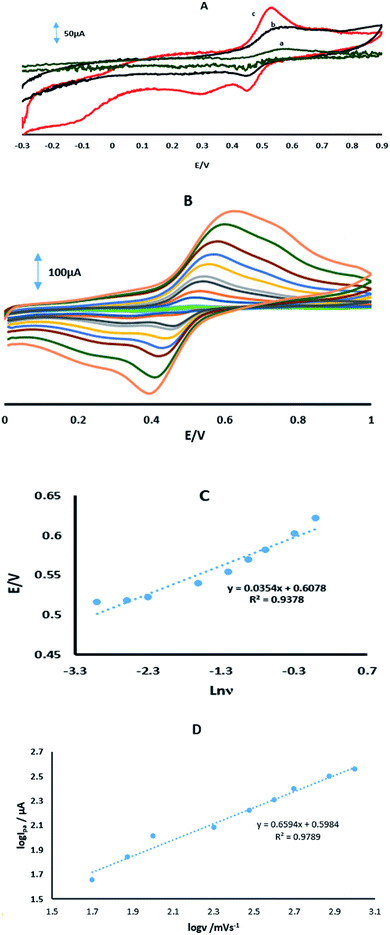 |
| | Fig. 6 (A) CVs in PBS with a pH of 2 in the presence of 70 μM 4-AP for (a) GPE, (b) GPE/A and (c) GPE/PtAM. (B) CVs of GPE/PtAM in the presence of 70 μM 4-AP at different scan rates of 0.05, 0.075, 0.1, 0.2, 0.3, 0.4, 0.5, 0.75 and 1 V s−1. (c) Variation of Ep vs. ln![[thin space (1/6-em)]](https://www.rsc.org/images/entities/char_2009.gif) ν. (D) A plot of the logarithm of the anodic peak currents vs. the logarithm of the scan rates. ν. (D) A plot of the logarithm of the anodic peak currents vs. the logarithm of the scan rates. | |
The results indicated that the electrode process was adsorption controlled rather than diffusion controlled. This could also be confirmed by the observed positive shift in the anodic peak potential with an increase in scan rate.
3.5. Chronoamperometric study
The chronoamperometry study of 4-AP at GPE/PtAM is shown in Fig. 7. As shown in this figure, the diffusion coefficients of 4-AP can be calculated by the Cottrell equation. This equation describes the variation of current with time for a diffusion controlled process:33| | |
IP = nFCD1/2π−1/2t−1/2
| (6) |
where D and C are the diffusion coefficient (cm2 s−1) and the concentration (mol cm−3), respectively, A and F are the surface area of the working electrode (0.1256 cm2) and the Faraday constant (96![[thin space (1/6-em)]](https://www.rsc.org/images/entities/char_2009.gif) 485 C mol−1), respectively. Under diffusion control (mass transport), a plot of I vs. t−1/2 was linear, and the value of D could be obtained from its slope. The value of D was found to be 4.56 × 10⁻⁴ cm2 s−1 for 4-AP. The standard heterogeneous rate constant (Ks) for the electrochemical reactions of 4-AP at the surface of GPE/PtAM, were evaluated by CV according to the Velasco equation, as given by eqn (7):34
485 C mol−1), respectively. Under diffusion control (mass transport), a plot of I vs. t−1/2 was linear, and the value of D could be obtained from its slope. The value of D was found to be 4.56 × 10⁻⁴ cm2 s−1 for 4-AP. The standard heterogeneous rate constant (Ks) for the electrochemical reactions of 4-AP at the surface of GPE/PtAM, were evaluated by CV according to the Velasco equation, as given by eqn (7):34| | |
Ks = 1.11 D01/2(EP − EP1/2)−1/2ν1/2
| (7) |
where Ks refers to the standard heterogeneous rate constant (cm s−1), D0 is the diffusion coefficient (cm2 s−1), EP and EP1/2 refer to potential peak and potential in half of peak currents (V), respectively, and v is the scan rate (V s−1). The value of Ks was found to be 3.32 × 10⁻¹ cm s−1 for 4-AP at GPE/PtAM. The Ks for GPE, was calculated to be 1.49 × 10⁻³ cm s−1. Based on these results, the Ks value for GPE/PtAM was 222.8 times higher than that obtained with GPE. Higher Ks values gave faster electron transfer for the electrochemical reaction of 4-AP molecules at GPE/PtAM.
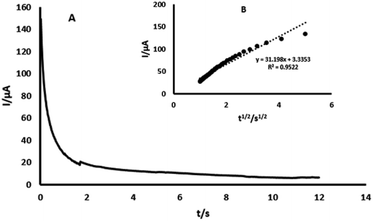 |
| | Fig. 7 (A) Chronoamperogram obtained from GPE/PtAM with PBS with a pH of 2.0 for a concentration of 0.2 mM 4-AP, (B) plots of I vs. t−1/2 obtained from the chronoamperogram of 4-AP. | |
3.6. Influence of pH on the oxidation of 4-AP
Fig. 8A shows the effect of pH of 70 μM 4-AP in 0.1 M PBS on the GPE/PtAM with PBS at a range of pH (2.0–9.0), Fig. 8B shows the plot of oxidation peak current of analytes vs. pH. Based on this figure, PBS with a pH of 2.0 exhibited the maximum peak current. Therefore, pH 2.0 was selected as optimum pH for PBS. The potentials of 4-AP followed the linear regression equations (Fig. 8C) with:| | |
Ep = −0.0742 pH + 0.6164 (R2 = 0.9978)
| (8) |
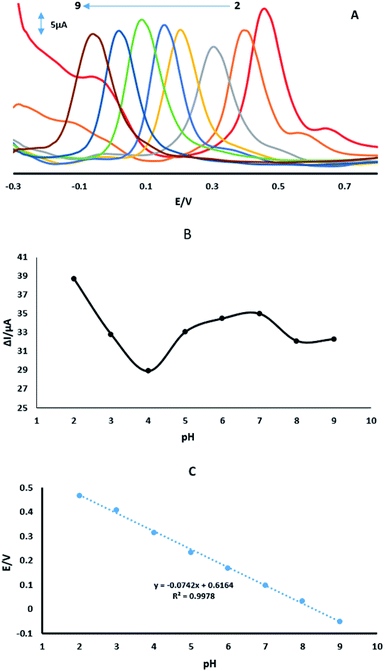 |
| | Fig. 8 (A) DPVs of GPE/PtAM with 70 μM 4-AP at a scan rate of 50 mV s−1 with PBS with pH values of 2.0 to 9.0. (B) Variation of ΔIp vs. buffered pH. (C) Variation of Ep vs. buffered pH. | |
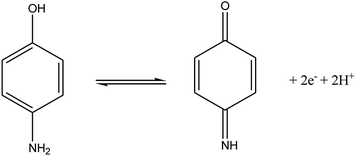
According to the formula: dEp/dpH = 2.303 (mRT/nF), where m and n were the number of protons and electrons, respectively.30 The slope of the equation of 4-AP was close to the theoretical value of 0.059 V pH−1, indicating that the electrochemical redox of 4-AP should be the same number of electrons and proton processes. This conclusion was in accordance with the known electrochemical reaction of 4-AP at the surface of GPE/PtAM with PBS at a pH of 2, which is illustrated in eqn (9):
| |
 | (9) |
3.7. Linear range and detection limit oxidation of 4-AP
Differential pulse voltammetry was used for the determination of 4-AP (Fig. 9A). In order to obtain the best sensitivity under the specific conditions used, an amplitude scan rate of 50 mV s−1 and PBS with a pH of 2.0 were used. The response was linear with the 4-AP concentration which consisted of two linear segments with slopes of 1.6419 and 0.6804 μA μM−1 in the concentration ranges from 0.8 μM to 16.6 μM and 16.6 μM to 87 μM, respectively (Fig. 9B). At the low and high concentrations of the 4-AP, the surface activity of the modified electrode was different, which was responsible for the observed difference in the slopes of the two linear segments. A high number of active sites were available on the electrode surface at lower concentrations of the analytes. However, the number of active sites decreased at higher concentrations of the analytes. The different number of active sites and likely kinetic limitation resulted in the decreased sensitivity of the slope in the second linear segments for 4-AP. The detection limit was determined to be 45 nM for 4-AP on surface of GPE/PtAM. In Table 1, the results of a comparison study of the present work with some different modified electrodes1,10–13,35–37 and different chromatography methods,4,5,9,38–42 which show acceptable performance according to the tabulated data of this electrode. Furthermore, the interfering effects of other probable coexisting ions such as Ca2+, Cl−, Cr3+, Cu2+, K+, Mg2+, Na+, NO3−, PO43−, SO42− and Zn2+, were investigated and the results showed that the maximum interfering effects for these ions were seen with the determination of 4-AP (5% tolerable molar ratio >100). Moreover, no significant interfering effects were seen for these ions.
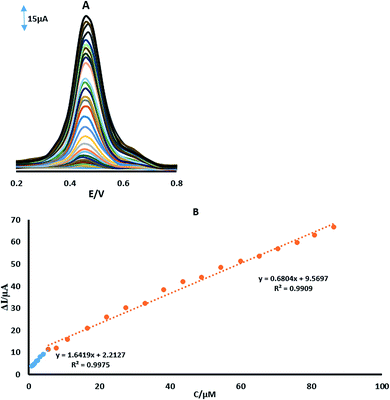 |
| | Fig. 9 (A) DPVs of GPE/PtAM in PBS with a pH of 2 containing different concentrations of 4-AP. (B) Plots of ΔI vs. concentration of 4-AP. | |
Table 1 Comparison of the manufactured electrode for 4-AP detection with electrodes used by other researchers
| Entry |
DLa (nM) |
LRb (μM) |
Ref. |
| Detection limit. Linear range. β-[3-(Dimethylamine)phenoxy] phthalocyanine cobalt(II)-multiwalled carbon nanotube hybrid/glassy carbon electrode. Graphene–chitosan/glassy carbon electrode. Graphene-polyaniline/glassy carbon electrode. Carbon fibre microelectrodes. Carbon ionic liquid electrode. Horseradish peroxidase-nanoporous gold co-catalytic strategy/carbon paste electrode. Graphene-polyaniline modified carbon paste electrode. Carboxyl multi walled carbon nanotube-cyclodextrin-edge functionalized graphene composite. Liquid chromatography. Micellar electrokinetic chromatography. High-performance liquid chromatography. Solid phase extraction-high-performance chromatography coupled to diode array detection. Solid phase extraction-fast-high-performance chromatography coupled to diode array detection. Anion exchange capillary liquid chromatography coupled to amperometric detection. High-performance liquid chromatography/amperometric detection. |
| PcCo/CNT/GCEc |
300 |
0.5–800 |
1 |
| Graphene–chitosan/GCEd |
57 |
0.2–550 |
10 |
| GR–PANI/GCEe |
65 |
0.2–100 |
11 |
| CFMEsf |
1000 |
— |
12 |
| CILEg |
100 |
0.3–1000 |
13 |
| HRP/NPG/CPEh |
110 |
5–60 |
35 |
| G-PANI/CPEi |
15![[thin space (1/6-em)]](https://www.rsc.org/images/entities/char_2009.gif) 680 680 |
50–500 |
36 |
| GN-CD-cMWCNTj |
19 |
0.2–125 |
37 |
| LCk |
4580 |
45.8–366.5 |
5 |
| MEKCl |
54![[thin space (1/6-em)]](https://www.rsc.org/images/entities/char_2009.gif) 970 970 |
183.2–1374.4 |
9 |
| HPLCm |
460 |
0.92–247.9 |
38 |
| SPE-HPLC/DADn |
0.6 |
0.46–13.7 |
4 |
| SPE-fast-HPLC/DADo |
2.5 |
4.6–11.4 |
4 |
| IECLC/ADp |
45 |
4.5–45 |
43 |
| Paper-based column/ADq |
10![[thin space (1/6-em)]](https://www.rsc.org/images/entities/char_2009.gif) 000 000 |
50–2000 |
40 |
| LC |
640 |
0.92–183.3 |
41 |
| MEKC |
1920 |
4.5–549.7 |
41 |
| HPLC/AD |
9 |
0.009–18.32 |
42 |
| GPE/PtAM |
45 |
0.8–87 |
This work |
3.8. Analytical application
The practical application of GPE/PtAM was examined for the determination of 4-AP in tap water and well water. The samples were diluted with PBS (pH 2.0) and DPVs were used for the determination of 4-AP using the standard addition method. Based on the results in Table 2, the recoveries for three water samples were 98–104.2% for 4-AP. These recovery amounts were acceptable for the determination of 4-AP.
Table 2 Determination of 4-AP in water samples (n = 3)
| Sample |
Added (μM) |
Found (μM) |
Recovery (%) |
RSD (%) |
| Tap water |
1 |
33 |
50 |
33.2 |
52.1 |
100.6 |
104.2 |
1.92 |
2.85 |
| 2 |
33 |
50 |
33.9 |
51.4 |
102.7 |
102.8 |
1.86 |
2.62 |
| Well water |
1 |
33 |
50 |
32.5 |
48 |
98.4 |
98 |
2.93 |
1.94 |
| 2 |
33 |
50 |
34.1 |
51.6 |
103.3 |
103.2 |
1.79 |
2.74 |
4 Conclusions
In this work, Pt was included on the surface of agarose and was used in GPEs. A modified GPE with PtAM was used for the determination of 4-AP as a water pollutant. Depending on the hydroxide groups present in the agarose structure, and the presence of Pt, the sensitivity of the electrode towards 4-AP increases. Some electrochemical measurements of the modified electrode and analyte on the surface modified electrode were studied. A value of 27.32 Ω was obtained for the charge transfer resistance of GPE/PtAM. Microscopic surface areas and the surface concentration of electroactive species for GPE/PtAM were calculated to be 0.077 cm2 and 1.13 × 10⁻³ mol cm−2, respectively. The electron transfer coefficient, the diffusion coefficient and the standard heterogeneous rate constant of 4-AP on GPE/PtAM were calculated as 0.274, 4.56 × 10⁻⁴ cm2 s−1 and 3.32 × 10⁻¹ cm s−1, respectively. The influence of pH on the oxidation of 4-AP was investigated and PBS with a pH of 2.0 was selected as the optimum pH. Under optimum conditions, a 45 nM detection limit was obtained. The preparation method is simple and cheap, and the proposed modified electrode is very stable. Finally, GPE/PtAM was successfully used for the determination of 4-AP in real samples.
Conflicts of interest
There are no conflicts to declare.
Acknowledgements
We appreciate and acknowledge financial support from the University of Sistan and Baluchestan (USB).
References
- L. Guo, Z. Chen, J. Zhang, H. Wu, F. Wu, C. He, B. Wang and Y. J. R. A. Wu, RSC Adv., 2015, 5, 23283–23290 RSC.
- T. Saitoh, K. Asano and M. Hiraide, J. Hazard. Mater., 2011, 185, 1369–1373 CrossRef CAS PubMed.
- H. Kool, C. Van Kreijl, B. Zoeteman and R. Tardiff, Crit. Rev. Environ. Sci. Technol., 1982, 12, 307–357 CAS.
- L. H. Santos, P. Paíga, A. N. Araújo, A. Pena, C. Delerue-Matos and M. Montenegro, J. Chromatogr. B: Anal. Technol. Biomed. Life Sci., 2013, 930, 75–81 CrossRef CAS PubMed.
- L. Monser and F. Darghouth, J. Pharm. Biomed. Anal., 2002, 27, 851–860 CrossRef CAS.
- G. D. Rodrigues, L. R. de Lemos, P. da Rocha Patrício, L. H. M. da Silva and M. da Silva, J. Hazard. Mater., 2011, 192, 292–298 CAS.
- A. B. Vishnikin, M. K. Al-Shwaiyat, G. A. Petrushina, L. P. Tsiganok, V. Andruch, Y. R. Bazel, H. Sklenářová and P. J. T. Solich, Talanta, 2012, 96, 230–235 CrossRef CAS PubMed.
- Q. Chu, L. Jiang, X. Tian and J. Ye, Anal. Chim. Acta, 2008, 606, 246–251 CrossRef CAS PubMed.
- T. Németh, P. Jankovics, J. Németh-Palotás and H. Kőszegi-Szalai, J. Pharm. Biomed. Anal., 2008, 47, 746–749 CrossRef PubMed.
- H. Yin, Q. Ma, Y. Zhou, S. Ai and L. Zhu, Electrochim. Acta, 2010, 55, 7102–7108 CrossRef CAS.
- Y. Fan, J. Liu, C. Yang, M. Yu and P. Liu, Sens. Actuators, B, 2011, 157, 669–674 CrossRef CAS.
- M. Jamal, A. S. Sarac and E. J. S. Magner, Sens. Actuators, B, 2004, 97, 59–66 CrossRef CAS.
- A. Safavi, N. Maleki and O. Moradlou, Electroanalysis, 2008, 20, 2158–2162 CrossRef CAS.
- M. Khayyami, M. T. P. Pita, N. P. Garcia, G. Johansson, B. Danielsson and P. O. Larsson, Talanta, 1998, 45, 557–563 CrossRef CAS PubMed.
- X. H. Zhang, S. F. Wang, M. Hu and Y. Xiao, Biosens. Bioelectron., 2006, 21, 2180–2186 CrossRef CAS PubMed.
- L. Shen and P. L. He, Electrochem. Commun., 2007, 9, 657–662 CrossRef CAS.
- G. Zhao, F. Xing and Sh. Deng, Electrochem. Commun., 2007, 9, 1263–1268 CrossRef CAS.
- G. Testa, L. Fontana, I. Venditti and I. Fratoddi, Beilstein J. Nanotechnol., 2016, 7, 1822 CrossRef CAS PubMed.
- G. Gerent and A. Spinelli, J. Hazard. Mater., 2017, 330, 105–115 CrossRef CAS PubMed.
- Q. Wang, C. Yang, Q. Yang, S. Yu and H. Yang, Anal. Chim. Acta, 2018, 1046, 93–98 CrossRef PubMed.
- M.-S. Ekrami-Kakhki, M. Khorasani-Motlagh and M. Noroozifar, J. Appl. Electrochem., 2011, 41, 527–534 CrossRef CAS.
- F. Kaedi, Z. Yavari, M. Noroozifar and H. Saravani, J. Electroanal. Chem., 2018, 827, 204–212 CrossRef CAS.
- A. S. Douk, H. Saravani and M. Noroozifar, Int. J. Hydrogen Energy, 2018, 43, 7946–7955 CrossRef.
- Z. Yavari, M. Noroozifar and M. Khorasani-Motlagh, J. Appl. Electrochem., 2015, 45, 439–451 CrossRef CAS.
- L. Wang and E. K. Wang, Electrochem. Commun., 2004, 6, 225–229 CrossRef CAS.
- S. Q. Liu, D. Leech and H. X. Ju, Anal. Lett., 2003, 36, 1–19 CrossRef CAS.
- M. Shahbakhsh and M. Noroozifar, Biosens. Bioelectron., 2018, 102, 439–448 CrossRef CAS PubMed.
- A. J. Bard, L. R. Faulkner, J. Leddy and C. G. Zoski, Electrochemical methods: fundamentals and applications, Wiley, New York, 1980 Search PubMed.
- V. Gau, S.-C. Ma, H. Wang, J. Tsukuda, J. Kibler and D. A. J. M. Haake, Methods, 2005, 37, 73–83 CrossRef CAS PubMed.
- M. Tohidinia, M. Farsadrooh, S. Bahmanzadeh, N. Sabbaghi and M. J. R. A. Noroozifar, RSC Adv., 2018, 8, 1237–1245 RSC.
- J. Liu, D. Takeshi, K. Sasaki and S. Lyth, J. Electrochem. Soc., 2014, 161, F838–F844 CrossRef CAS.
- M. Sharp, M. Petersson and K. Edström, J. Electroanal. Chem., 1979, 95, 123–130 CrossRef CAS.
- M. Tohidinia and M. Noroozifar, Int. J. Electrochem. Sci., 2018, 13, 2310–2328 CrossRef CAS.
- J. Velasco, Electroanalysis, 1997, 9, 880–882 CrossRef.
- C. Wu, Z. Liu, H. Sun, X. Wang and P. J. B. Xu, Biosens. Bioelectron., 2016, 79, 843–849 CrossRef CAS PubMed.
- P. Rattanarat, A. Suea-Ngam, N. Ruecha, W. Siangproh, C. S. Henry, M. Srisa-Art and O. Chailapakul, Anal. Chim. Acta, 2016, 925, 51–60 CrossRef CAS PubMed.
- J. Gao, M. Liu, H. Song, S. Zhang, Y. Qian and A. Li, J. Hazard. Mater., 2016, 318, 99–108 CrossRef CAS PubMed.
- N. A. Penner and P. N. J. A. Nesterenko, Analyst, 2000, 125, 1249–1254 RSC.
- M. Zheng, Y. Wu, L. Lu, K. Ding, F. Tang, Z. Lin and X. Wu, J. Sep. Sci., 2011, 34, 2072–2078 CAS.
- L. Y. Shiroma, M. Santhiago, A. L. Gobbi and L. Kubota, Anal. Chim. Acta, 2012, 725, 44–50 CrossRef CAS PubMed.
- S.-P. Wang and T.-H. Huang, Anal. Chim. Acta, 2005, 534, 207–214 CrossRef CAS.
- E. Wyszecka-Kaszuba, M. Warowna-Grześkiewicz and Z. Fijałek, J. Pharm. Biomed. Anal., 2003, 32, 1081–1086 CrossRef CAS PubMed.
- M. Zheng, Y. Wu, L. Lu, K. Ding, F. Tang, Z. Lin and X. Wu, J. Sep. Sci., 2011, 34, 2072–2078 CAS.
|
| This journal is © The Royal Society of Chemistry 2020 |
Click here to see how this site uses Cookies. View our privacy policy here.  Open Access Article
 *a,
A. Biabangarda and
M. Noroozifarb
 when Dox = Dred) which was calculated from the cyclic voltammograms. The field emission scanning electron microscopy (FESEM) was carried out using an electron microscope (MIRA3, Tescan) and energy dispersive X-ray analysis (EDX) was carried out using an electron microscope (SAMx, France). Transmission electron microscopy (TEM) images were taken using a transmission electron microscope (CM120, Philips) with 2.5 Å resolution. The pH measurements were made using a pH meter (model 744, Metrohm). All experiments were performed at room temperature (RT).
![[thin space (1/6-em)]](https://www.rsc.org/images/entities/char_2009.gif) 485 C mol−1) and T (298 K) denote the gas constant, the Faraday constant, and the temperature, respectively. From the slope of the plot of the anodic peak currents vs. scan rates, the surface concentration of electroactive species for the GPE/PtAM was calculated to be 2.8 × 10⁻⁴ mol cm−2 for n = 2 (see Fig. 5).
485 C mol−1) and T (298 K) denote the gas constant, the Faraday constant, and the temperature, respectively. From the slope of the plot of the anodic peak currents vs. scan rates, the surface concentration of electroactive species for the GPE/PtAM was calculated to be 2.8 × 10⁻⁴ mol cm−2 for n = 2 (see Fig. 5).


![[thin space (1/6-em)]](https://www.rsc.org/images/entities/char_2009.gif) IPa (μA) = 0.6594
IPa (μA) = 0.6594![[thin space (1/6-em)]](https://www.rsc.org/images/entities/char_2009.gif) log
log![[thin space (1/6-em)]](https://www.rsc.org/images/entities/char_2009.gif) ν + 0.5984 (R2 = 0.9789)
ν + 0.5984 (R2 = 0.9789)
![[thin space (1/6-em)]](https://www.rsc.org/images/entities/char_2009.gif) 485 C mol−1), respectively. Under diffusion control (mass transport), a plot of I vs. t−1/2 was linear, and the value of D could be obtained from its slope. The value of D was found to be 4.56 × 10⁻⁴ cm2 s−1 for 4-AP. The standard heterogeneous rate constant (Ks) for the electrochemical reactions of 4-AP at the surface of GPE/PtAM, were evaluated by CV according to the Velasco equation, as given by eqn (7):34
485 C mol−1), respectively. Under diffusion control (mass transport), a plot of I vs. t−1/2 was linear, and the value of D could be obtained from its slope. The value of D was found to be 4.56 × 10⁻⁴ cm2 s−1 for 4-AP. The standard heterogeneous rate constant (Ks) for the electrochemical reactions of 4-AP at the surface of GPE/PtAM, were evaluated by CV according to the Velasco equation, as given by eqn (7):34


![[thin space (1/6-em)]](https://www.rsc.org/images/entities/char_2009.gif) 680
680![[thin space (1/6-em)]](https://www.rsc.org/images/entities/char_2009.gif) 970
970![[thin space (1/6-em)]](https://www.rsc.org/images/entities/char_2009.gif) 000
000


