 Open Access Article
Creative Commons Attribution 3.0 Unported Licence
The influence of the sacrificial agent nature on transformations of the Zn(OH)2/Cd0.3Zn0.7S photocatalyst during hydrogen production under visible light†
Dina V. Markovskayaab,
Svetlana V. Cherepanovaab,
Evgeny Yu. Gerasimov ab,
Angelina V. Zhurenoka,
Aleksandra V. Selivanova
 a,
Dmitry S. Selishchevab and
Ekaterina A. Kozlova
 *ab
*ab
aBoreskov Institute of Catalysis SB RAS, Lavrentieva Ave., 5, Novosibirsk, 630090, Russia. E-mail: kozlova@catalysis.ru; Fax: +7-383-333-16-17; Tel: +7-383-333-16-17
bNovosibirsk State University, Pirogova Str., 2, Novosibirsk, 630090, Russia
First published on 8th January 2020
Abstract
Photocatalysts based on zinc hydroxide and a solid solution of CdS and ZnS were prepared via the precipitation method and used for photocatalytic hydrogen production from aqueous solutions of inorganic (Na2S/Na2SO3) and organic (ethanol) sacrificial agents. The photocatalysts were tested in cyclic experiments for hydrogen evolution and studied using X-ray diffraction (XRD), UV-Vis diffuse reflectance spectroscopy, high-resolution transmission electron microscopy (HRTEM), energy-dispersive X-ray spectroscopy (EDX), and X-ray photoelectron spectroscopy (XPS) techniques. Different transformations of the β-Zn(OH)2 co-catalyst were observed in the presence of inorganic and organic sacrificial agents; namely, ZnS was formed in Na2S/Na2SO3 solution, whereas the formation of ε-Zn(OH)2 was detected in solution with ethanol. The composite Zn(OH)2/Cd1−xZnxS photocatalysts have great potential in various photocatalysis processes (e.g., hydrogen production, CO2 reduction, and the oxidation of organic contaminants) under visible light.
1. Introduction
Photocatalytic hydrogen evolution is known to be an environmentally friendly approach to the synthesis of H2 for various energy applications.1,2 From a practical point of view, the photocatalysts for hydrogen production should be active under visible light, because the solar radiation spectrum has ca. 40% of photons in the visible region of the spectrum.3 The materials based on CdS,4 ZnS,4 and their solid solution Cd1−xZnxS (ref. 5) have great promise for this purpose. Unfortunately, the activity and stability of the Cd and Zn sulfide photocatalysts are quite low owing to the intense recombination of charge carriers and photocorrosion. The deposition of co-catalysts, such as oxides,6–9 hydroxides10–12 or other sulfides,12–17 can substantially improve the target parameters of the photocatalyst and enhance its activity. The photocatalysts based on the composition of Cd1−xZnxS and Zn(OH)2 show a higher activity and stability compared to Cd1−xZnxS alone and are attractive for the photocatalytic hydrogen evolution from water–alcohol solutions.18In the 1950s, G. K. Boreskov stated that the chemical and phase composition of the heterogeneous catalyst was changed during the reaction owing to its interaction with the reagents.19 Studying the effect of the reagent nature on the catalyst composition and its catalytic activity is an important task from a fundamental point of view to discover the mechanism of the catalytic action. In a previous study,18 we demonstrated that the activation of the Zn(OH)2/Cd0.3Zn0.7S photocatalyst occurs during the photocatalytic hydrogen production from both the Na2S/Na2SO3 and ethanol aqueous solutions. This study aims to investigate in detail the changes in the composition of the Zn(OH)2/Cd0.3Zn0.7S photocatalyst during its activation in this process and to establish the role of the sacrificial agent on the transformation of the photocatalyst. In this paper, we show that for the Na2S/Na2SO3 aqueous solution the enhancement in the catalytic activity of the Zn(OH)2/Cd0.3Zn0.7S composite is due to the sulfurization of Zn(OH)2, while in the aqueous solution of ethanol the activation of the photocatalyst is associated with the formation of ε-Zn(OH)2. These results indicate great potential for Zn(OH)2/Cd1−xZnxS photocatalysts, because a rather simple technique can be used for their synthesis, and for different sacrificial agents the co-catalyst would transform to the desired form in situ during the process of hydrogen evolution and would provide a high photocatalytic activity.
2. Experimental
2.1. Photocatalyst synthesis
The y% Zn(OH)2/Cd0.3Zn0.7S photocatalysts with a Zn(OH)2 weight content (y) from 10 to 30% were prepared via the precipitation of Zn(OH)2 by sodium hydroxide from an aqueous solution of zinc nitrate Zn(NO3)2, which contains suspended Cd0.3Zn0.7S nanoparticles, and was performed in accordance with the technique described in our previously published paper.18 The y% ZnS/Cd0.3Zn0.7S photocatalysts with a ZnS weight content (y) from 0.5 to 10% were prepared via the precipitation of ZnS by sodium sulfide from an aqueous solution of zinc nitrate Zn(NO3)2, which contains suspended Cd0.3Zn0.7S nanoparticles. Also, β-Zn(OH)2 was also prepared by a simple interaction of Zn(NO3)2 with NaOH followed by soft drying for several days. Note that the hydrogen evolution from the ethanol solution was a slow process, and to increase the photocatalytic activity in these experiments, the composite photocatalysts were additionally modified with platinum (1 wt%). Pt deposition was performed via the chemical reduction of H2PtCl6 with NaBH4 according to the previously published technique.18 The Pt-loaded photocatalysts are named in this paper as 1% Pt/y% Zn(OH)2/Cd0.3Zn0.7S. All of the reagents used during the synthesis were of analytic grade and were used as supplied without further purification.2.2. Photocatalyst characterization
The photocatalysts were characterized before and after the catalytic tests using X-ray diffraction (XRD), UV-Vis diffuse reflectance spectroscopy (UV-Vis DRS), and transmission electron microscopy (TEM) techniques. The XRD patterns were recorded on a D8 Advance diffractometer (Bruker, Germany) using Cu Kα radiation. The scanning was performed in the 2θ range from 15 to 65° with a step of 0.05° and an acquisition time of 10 s at each point. The peak deconvolution was carried out using two Gaussian functions, and the composition of Cd1−xZnxS was determined from the angular positions of the functions. The content of the ε-Zn(OH)2 phases was calculated with the TOPAS package (General Profile and Structure Analysis Software for Powder Diffraction Data, Bruker AXS GmBH, Germany). The weight content of Cd0.3Zn0.7S was assumed to be a constant. The hydrozincite (Zn5(CO3)2(OH)6) and β-Zn(OH)2 phases were not suitable for quantitative analysis with the TOPAS package owing to their imperfect structure and insufficient data. Therefore, their total content was estimated to be the difference between 100% and the calculated contents of Cd1−xZnxS and ε-Zn(OH)2. The UV-Vis diffuse reflectance spectra of the photocatalysts were recorded at room temperature in the range of 250–850 nm with a resolution of 1 nm using a Cary 300 UV-Vis spectrophotometer from Agilent (USA) equipped with a DRA-30I diffuse reflectance accessory. Special pre-packed polytetrafluoroethylene (PTFE) from Agilent (USA) was used as a reflectance standard. The high resolution TEM (HRTEM) images were obtained with a JEM-2010 transmission electron microscope (JEOL, Japan) operated at an accelerating voltage of 200 kV which provides a lattice resolution of 0.14 nm. The local elemental composition was analyzed using a Phoenix energy-dispersive spectrometer (EDAX, USA) equipped with a Si(Li) detector with an energy resolution of 130 eV. X-ray photoelectron spectroscopy (XPS) measurements were performed using a SPECS photoelectron spectrometer (SPECS Surface Nano Analysis GmbH, Germany) equipped with an XR-50M X-ray source, a FOCUS-500 ellipsoidal crystal monochromator, and a PHOIBOS-150 hemispherical electron energy analyzer. The valence band and core-level spectra were obtained using monochromatic Al Kα radiation.2.3. Photocatalytic activity measurement
The synthesized catalysts were studied for photocatalytic hydrogen evolution from an aqueous solution of inorganic or organic sacrificial agents according to the technique described elsewhere.18 In the case of the inorganic agent, 50 mg of y% Zn(OH)2/Cd0.3Zn0.7S photocatalyst was suspended in 100 mL of 0.1 M Na2S/0.1 M Na2SO3 aqueous solution, purged with argon for 30 min, and illuminated with a 450-LED (30 W, China). In the case of the organic donor, 50 mg of 1% Pt/y% Zn(OH)2/Cd0.3Zn0.7S was suspended in the solution, which contained 10 mL of ethanol, 90 mL of water, and 400 mg of NaOH. Then, the suspension was purged with argon for 30 min and illuminated with a 450-LED (30 W, China). The amount of evolved hydrogen was measured with a Khromos GCh-1000 gas chromatograph (Khromos, Russia) equipped with a zeolite column and a thermal conductivity detector. Argon was used as the carrier gas. The photocatalytic activity of the pristine Cd0.3Zn0.7S and synthesized composites was estimated as the rate of hydrogen evolution (μmol min−1). Note that the photocatalytic activity of the samples without any sacrificial agents was very low (e.g. 0.008 ± 0.002 μmol min−1 for Cd0.3Zn0.7S).3. Results and discussion
Co-catalysts in composite photocatalysts may provide a substantial increase in the rate of photocatalytic hydrogen evolution from aqueous solutions of various sacrificial agents. The photocatalysts based on the composition of Cd1−xZnxS and Zn(OH)2 show a high activity in this process. Earlier, we studied the photocatalytic activity of the y% Zn(OH)2/Cd0.3Zn0.7S and 1% Pt/y% Zn(OH)2/Cd0.3Zn0.7S composites for hydrogen production from aqueous solutions of Na2S/Na2SO3 and ethanol, respectively.18 The reaction rate increased as the Zn(OH)2 content was increased up to 10–20 wt% owing to the formation of heterojunctions between the components of the photocatalyst. In the case of the Na2S/Na2SO3 sacrificial agent, the maximum reaction rate was observed for the 20% Zn(OH)2/Cd0.3Zn0.7S sample. In the case of the ethanol sacrificial agent, a much lower rate of hydrogen production was observed, and the composites were additionally modified with platinum (1 wt%) to increase the photocatalytic activity. For ethanol as a sacrificial agent, the maximum reaction rate was observed for the 1% Pt/10% Zn(OH)2/Cd0.3Zn0.7S sample. In addition to the fact that Zn(OH)2 itself is not active in hydrogen production under visible light (Table 1), it may be considered as an active component of the composite photocatalyst.18 The level of the conduction band (CB) for Zn(OH)2 is close to −0.3 V versus normal hydrogen electrode (NHE), whereas for Cd0.3Zn0.7S, which is a light absorbing phase, the CB level is located at −0.6 V versus NHE. Therefore, the photogenerated electrons can transfer from the sulfide to the hydroxide nanoparticles,2 and the increased activity of the Zn(OH)2/Cd0.3Zn0.7S composites is due to the heterojunctions between the components of the photocatalyst and the improved separation of the charge carriers.| Sample | Reaction rate (μmol min−1) achieved during the corresponding run | |||
|---|---|---|---|---|
| 1 | 2 | 3 | 4 | |
| a Hydrogen was produced from 0.1 M Na2S/0.1 M Na2SO3 solution.b Hydrogen was produced from 10 vol% ethanol aqueous solution. | ||||
| 0.1 M Na2S/0.1 M Na2SO3 solution | ||||
| Cd0.3Zn0.7Sa | 3.2 ± 0.3 | 3.3 ± 0.3 | 2.8 ± 0.3 | 2.4 ± 0.2 |
| 10% Zn(OH)2/Cd0.3Zn0.7Sa | 3.3 ± 0.2 | 4.3 ± 0.4 | 5.1 ± 0.4 | 5.6 ± 0.3 |
| 20% Zn(OH)2/Cd0.3Zn0.7Sa | 3.5 ± 0.4 | 5.5 ± 0.5 | 7.4 ± 0.7 | 6.8 ± 0.7 |
| 30% Zn(OH)2/Cd0.3Zn0.7Sa | 3.1 ± 0.3 | 5.3 ± 0.5 | 6.2 ± 0.6 | 5.7 ± 0.6 |
| 0.5% ZnS/Cd0.3Zn0.7Sa | 3.4 ± 0.2 | Experiments not carried out | ||
| 1% ZnS/Cd0.3Zn0.7Sa | 3.7 ± 0.3 | 4.2 ± 0.4 | 4.4 ± 0.5 | 4.0 ± 0.4 |
| 5% ZnS/Cd0.3Zn0.7Sa | 2.9 ± 0.3 | Experiments not carried out | ||
| 10% ZnS/Cd0.3Zn0.7Sa | 1.9 ± 0.2 | |||
| ZnSa | 0.30 ± 0.03 | |||
| Zn(OH)2a | No hydrogen is detected | 0.14 ± 0.01 | 0.11 ± 0.03 | 0.14 ± 0.02 |
![[thin space (1/6-em)]](https://www.rsc.org/images/entities/char_2009.gif) |
||||
| 10 vol% ethanol aqueous solution | ||||
| 1% Pt/Zn(OH)2b | No hydrogen is detected | |||
| 1% Pt/Cd0.3Zn0.7Sb | 0.48 ± 0.05 | 0.36 ± 0.04 | 0.24 ± 0.02 | 0.12 ± 0.01 |
| 1% Pt/10% Zn(OH)2/Cd0.3Zn0.7Sb | 0.94 ± 0.09 | 1.4 ± 0.1 | 2.3 ± 0.2 | 2.7 ± 0.3 |
| 1% Pt/30% Zn(OH)2/Cd0.3Zn0.7Sb | 0.10 ± 0.01 | 0.12 ± 0.01 | 0.63 ± 0.06 | 0.71 ± 0.07 |
At the same time for both agents, a further increase in the content of Zn(OH)2 to greater than 10–20 wt% led to a decrease in the hydrogen production rate. The band gaps of Cd0.3Zn0.7S and Zn(OH)2 are ∼2.7 and 5.1 eV, respectively, and only Cd0.3Zn0.7S can be activated under visible light. Therefore, the low activity of the composite at a high content of Zn(OH)2 is due to a decrease in the amount of the Cd0.3Zn0.7S phase, which can absorb visible light.
Based on the points mentioned above, the composite Zn(OH)2/Cd0.3Zn0.7S photocatalysts with a content of Zn(OH)2 from 10 to 30% were selected for the experiments and detailed investigations in this study. The y% Zn(OH)2/Cd0.3Zn0.7S and 1% Pt/y% Zn(OH)2/Cd0.3Zn0.7S composites were tested in the cyclic experiments for hydrogen production with two sacrificial agents (Na2S/Na2SO3 and ethanol) under the same conditions to compare the transformation mechanism. For both sacrificial agents, the pristine Cd0.3Zn0.7S and 1% Pt/Cd0.3Zn0.7S samples lost their catalytic activity after several runs of hydrogen production (Table 1). This behavior may be due to the self-oxidation of the sulfide surface by the photogenerated holes.20 In contrast, the strong activation of the composite Zn(OH)2/Cd0.3Zn0.7S photocatalysts was achieved during three catalytic runs for both the inorganic and organic sacrificial agents (Table 1).
We have previously shown that the activation of 1% Pt/y% Zn(OH)2/Cd0.3Zn0.7S photocatalysts in the case of hydrogen evolution from aqueous ethanol solution is caused by the transformation of β-Zn(OH)2 to ε-Zn(OH)2.18,21 The linear correlation between the reaction rate and the content of ε-Zn(OH)2 in the composite photocatalyst was found.22 Based on these results, the same transformation may be suggested for the photocatalytic hydrogen evolution from the Na2S/Na2SO3 aqueous solution. To check this suggestion, a detailed analysis of the photocatalyst composition during long-term hydrogen evolution was performed using several characterization methods. It should be noted that the 20% Zn(OH)2/Cd0.3Zn0.7S and 1% Pt/10% Zn(OH)2/Cd0.3Zn0.7S samples had the maximum activity for Na2S/Na2SO3 and ethanol sacrificial agents, respectively, but these samples were not suitable for correct identification using XRD analysis owing to the low content of Zn(OH)2. This was the reason for the selection of the 30% Zn(OH)2/Cd0.3Zn0.7S and 1% Pt/30% Zn(OH)2/Cd0.3Zn0.7S samples with a Zn(OH)2 content of 30 wt% for detailed analysis of the phase transformation. To support the findings and to extend them to the samples with a reduced content of Zn(OH)2, the 10% Zn(OH)2/Cd0.3Zn0.7S and 20% Zn(OH)2/Cd0.3Zn0.7S samples were also tested in four consecutive runs for hydrogen evolution from the Na2S/Na2SO3 aqueous solution. However, only the phase compositions of the fresh samples and the samples after the fourth photocatalytic run were analyzed.
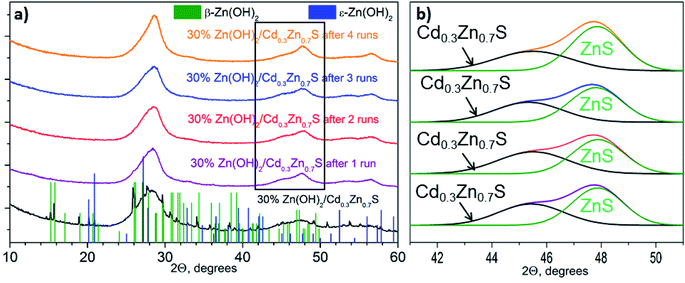
Fig. 1a shows the XRD patterns for the 30% Zn(OH)2/Cd0.3Zn0.7S photocatalyst before and after the hydrogen evolution runs. Three broad peaks located at 25–30, 42–50, and 52–60° are observed for the fresh photocatalyst. These peaks can be attributed to the Cd1−xZnxS solid solution of x ∼ 0.7. Narrow peaks for the β-Zn(OH)2 and ε-Zn(OH)2 phases are also observed. At the same time, no peaks attributed to Zn(OH)2 can be identified in the XRD patterns for the 30% Zn(OH)2/Cd0.3Zn0.7S photocatalysts after several runs of hydrogen evolution (Fig. 1a). An amorphization of zinc hydroxide or a decrease in its content during the runs may be the reason for this. Additionally, after the first run, the broad peaks attributed to the Cd1−xZnxS solid solution became asymmetrical owing to the appearance of a signal from the ZnS phase (Fig. 1b). The formation of ZnS may result from the sulfurization of Zn(OH)2 in the Na2S/Na2SO3 aqueous solution, because the area of the ZnS peak grew after each run of hydrogen evolution (Fig. 1b). The same behavior was observed for the 10% Zn(OH)2/Cd0.3Zn0.7S and 20% Zn(OH)2/Cd0.3Zn0.7S photocatalysts after the fourth run (Fig. S1 in the ESI†). This statement also supported the experiments on Zn(OH)2 alone, after four runs in the Na2S/Na2SO3 aqueous solution the pristine Zn(OH)2 underwent partial sulfurization (see Fig. S2 in ESI†). Unfortunately, we cannot exactly calculate the ratio of Cd0.3Zn0.7S to ZnS, because both phases have a disordered structure.
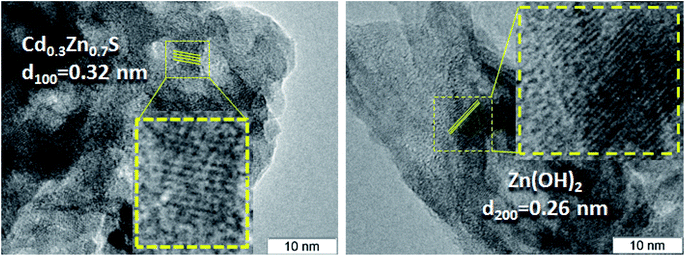
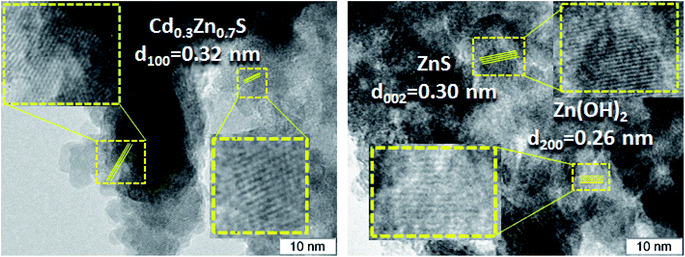
The TEM and HRTEM images of the 30% Zn(OH)2/Cd0.3Zn0.7S before and after two irradiation runs were used to evaluate the degree of transformation of Zn(OH)2 to ZnS (Fig. 2 and 3). Fig. 2 shows that the fresh 30% Zn(OH)2/Cd0.3Zn0.7S photocatalyst consists of two different phases, namely, the Cd0.3Zn0.7S solid solution (d100 = 0.32 nm) and Zn(OH)2 (d200 = 0.32 nm). Fig. 3 shows that the same phases are presented in the photocatalyst after two runs of hydrogen evolution. In addition to these phases, the lattice fringe of 0.30 nm can be attributed to the (002) plane of ZnS. It indicates that zinc hydroxide is present in the sample, but the size of the Zn(OH)2 particle is much smaller.
The lattice fringes corresponding to Cd1−xZnxS and ZnS are close to each other, and to confirm the presence of the ZnS phase the samples were additionally investigated using the EDX technique (Fig. 4). The lines of Cd, Zn, and S are observed in the EDX spectrum of the fresh 30% Zn(OH)2/Cd0.3Zn0.7S sample, while the line for O is very low (Fig. 4a). These data are attributed to the solid solution of Cd1−xZnxS. Fig. 4b shows the EDX spectrum for the domains depicted in Fig. 2 (right) and confirms the presence of zinc hydroxide only. The lines, which can be attributed to Zn and S (Fig. 4c), as well as to Zn, Cd, and S (Fig. 4d), were observed for the sample after two runs of hydrogen evolution. In both cases, the content of oxygen was very low. Therefore, the area in Fig. 4c can be attributed to the ZnS phase, while the area in Fig. 4d corresponds to Cd1−xZnxS. The data from the EDX analysis for the studied samples are summarized in Table 2. They confirm the presence of two types of domains, as mentioned above. It should be noted that the O content for the fresh photocatalyst varied from 9 to 54 at%, while for the sample after two runs of hydrogen evolution this value was in the range of 3–33 at%. Simultaneously, the S content increased during the long-term photocatalytic hydrogen production. The lowest S content was equal to 2 at% for the fresh photocatalyst and 25 at% for the photocatalyst after long-term hydrogen production. The highest S content also grew from 42 to 52 at%. This increase in the S content with a simultaneous decrease in the O content confirms the partial sulfurization of zinc hydroxide during the photocatalytic hydrogen production.
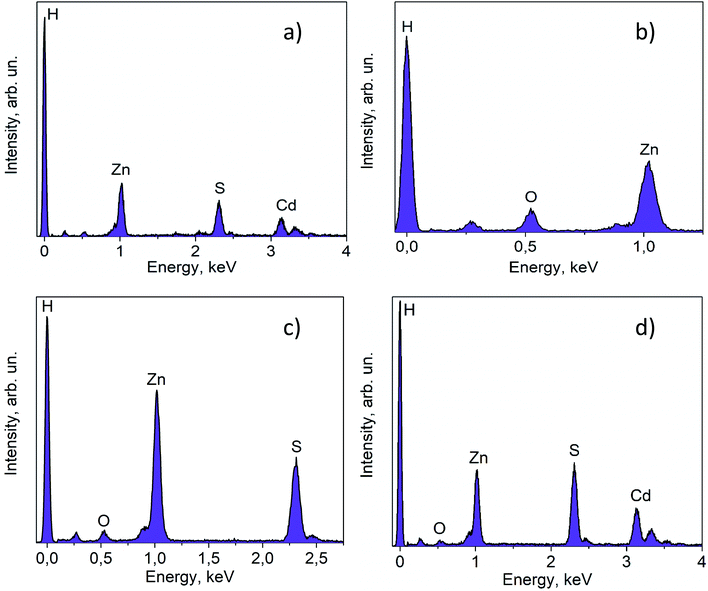 | ||
| Fig. 4 EDX spectra for fresh 30% Zn(OH)2/Cd0.3Zn0.7S (a) and (b); and for 30% Zn(OH)2/Cd0.3Zn0.7S after two irradiation runs (c) and (d). | ||
| Number of the analyzed area | Atomic content of corresponding element, % | |||
|---|---|---|---|---|
| Cd | Zn | S | O | |
| 30% Zn(OH)2/Cd0.3Zn0.7S | ||||
| 1 | 4 | 45 | 32 | 19 |
| 2 | 6 | 37 | 28 | 29 |
| 3 | 3 | 40 | 36 | 21 |
| 4 | 21 | 30 | 40 | 9 |
| 5 | 2 | 45 | 3 | 50 |
| 6 | 1 | 43 | 2 | 54 |
| 7 | 13 | 32 | 42 | 13 |
![[thin space (1/6-em)]](https://www.rsc.org/images/entities/char_2009.gif) |
||||
| 30% Zn(OH)2/Cd0.3Zn0.7S after two irradiation runs | ||||
| 8 | 1 | 42 | 37 | 20 |
| 9 | 1 | 40 | 40 | 19 |
| 10 | 2 | 36 | 52 | 10 |
| 11 | 1 | 41 | 25 | 33 |
| 12 | 20 | 25 | 51 | 4 |
| 13 | 1 | 40 | 49 | 10 |
| 14 | 22 | 22 | 52 | 4 |
Fig. 5a shows the diffuse reflectance spectra of the fresh photocatalyst and the sample after the first and fourth runs of hydrogen evolution. The fresh photocatalyst had a spectrum that is typical of materials based on a Cd0.3Zn0.7S solid solution.4 No peaks that are typical of Zn(OH)2 were observed for this photocatalyst. The spectra of the composite samples after the first and fourth runs were similar, which corresponds to the light absorption by the Cd0.3Zn0.7S phase (Fig. 4). According to the spectra for individual phases (Fig. 5b), an additional shoulder at ∼340 nm in these spectra can be attributed to the ZnS phase.23 The DRS data confirm the sulfurization of the co-catalyst and completely agrees with the data from other methods.
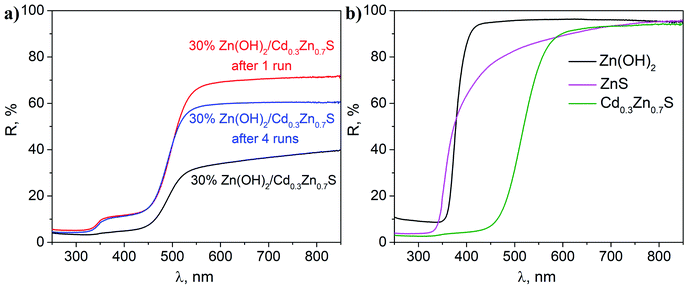 | ||
| Fig. 5 DRS analysis of (a) a fresh 30% Zn(OH)2/Cd0.3Zn0.7S sample and 30% Zn(OH)2/Cd0.3Zn0.7S samples after the first and fourth irradiation runs; and (b) single-phase Cd0.3Zn0.7S, Zn(OH)2, and ZnS. | ||
Therefore, the sulfurization of the Zn(OH)2/Cd0.3Zn0.7S photocatalysts occurs during the photocatalytic hydrogen production from the Na2S/Na2SO3 aqueous solution under visible light. The XRD patterns of the 30% Zn(OH)2/Cd0.3Zn0.7S sample after the second to the fourth photocatalytic runs in Fig. 1b are quite similar and confirm the presence of ZnS and Cd0.3Zn0.7S only. Also, Table 1 shows that the rate of hydrogen evolution almost doubles after the first run, and then it does not change significantly. Based on these results, we can conclude that the transformation of β-Zn(OH)2 to ZnS is quite a fast process. In addition to the fact that zinc hydroxide nanoparticles are present in the sample (Fig. 3), their amount is probably small. ZnS is known to have a weak absorption in the visible region,23 and both Cd0.3Zn0.7S and ZnS can be activated under visible light. However, we believe that the heterojunctions between ZnS and Cd0.3Zn0.7S are probably realized in the multiphase sample and are responsible for the improvement of the photocatalytic activity. The kinetic data (Table 1) confirms this statement, because the hydrogen production rate for the 20 or 30% Zn(OH)2/Cd0.3Zn0.7S samples, which transforms to the form of ZnS/Cd0.3Zn0.7S during the reaction, is higher than the rate for Cd0.3Zn0.7S (3.2 μmol min−1) or ZnS (0.3 μmol min−1).
To confirm the high activity of the ZnS/Cd1−xZnxS heterostructures, the photocatalytic activity of the y% ZnS/Cd0.3Zn0.7S samples, prepared via a simple deposition of ZnS onto the surface of Cd0.3Zn0.7S, was also studied and is listed in Table 1. The reaction rate slightly increased as the ZnS content was increased up to 1 wt%. The further increase in the ZnS content led to a decrease in the reaction rate (Table 1). This observation confirms that the formation of ZnS from Zn(OH)2 in situ during the process of hydrogen production is beneficial to a high photocatalytic activity compared to the direct synthesis of the ZnS/Cd0.3Zn0.7S composites. This is probably due to the closer contact between the formed nanoparticles in the first case.
In addition to Na2S/Na2SO3, we also checked the data for ethanol as a sacrificial agent, and the transformations of the 1% Pt/30% Zn(OH)2/Cd0.3Zn0.7S photocatalyst under irradiation in an aqueous solution of ethanol were studied in detail. Fig. 6 shows the XRD patterns of 1% Pt/30% Zn(OH)2/Cd0.3Zn0.7S before and after the second to the fourth runs of hydrogen evolution. Cd0.3Zn0.7S and a mixture of the β-Zn(OH)2 and ε-Zn(OH)2 phases were detected in the composition of the fresh photocatalyst. During the photocatalytic hydrogen production, the intensity of the peaks, which correspond to β-Zn(OH)2, decreased, whereas the intensity of the ε-Zn(OH)2 peaks increased in contrast, and the reaction rate also increased (see Fig. 7 and Table 1). Quantitative analysis of the XRD data confirms this observation (see Table 3). 11 wt% β-Zn(OH)2 and 11 wt% ε-Zn(OH)2 was detected in the fresh photocatalyst, whereas only the ε-Zn(OH)2 phase (22 wt%) was detected in the photocatalyst after four runs of hydrogen evolution. Additionally, the hydrozincite-like phase Zn5(CO3)2−x(OH)6+2x·yH2O, which is referred to as HZ, was detected after the first run, but it completely disappeared at the end of the fourth run. The HZ phase may be formed during the wet stage of the synthesis owing to the presence of dissolved CO2 in solution and/or during drying of the samples in air.24 We have previously shown that the presence of the ε-Zn(OH)2 phase is beneficial for H2 production, whereas both β-Zn(OH)2 and HZ are inactive in this process.22 As further support for this statement, the reaction rate of the hydrogen production in this study monotonically increased as the content of ε-Zn(OH)2 increased (see Fig. 7).
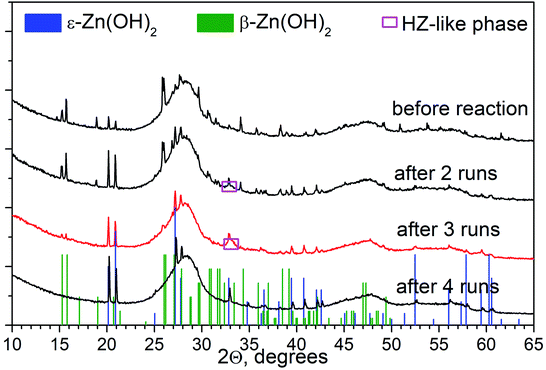 | ||
| Fig. 6 XRD patterns of 1% Pt/30% Zn(OH)2/Cd0.3Zn0.7S before and after photocatalytic hydrogen production from aqueous ethanol solutions. | ||
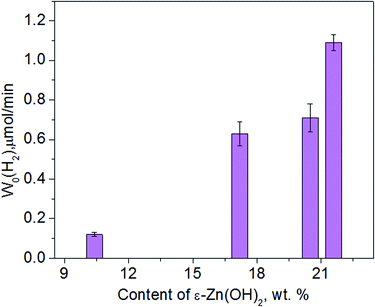 | ||
| Fig. 7 Dependence of the photocatalytic hydrogen production rate on the ε-Zn(OH)2 weight percentage obtained in ethanol solution in the presence of 1% Pt/30% Zn(OH)2/Cd0.3Zn0.7S. | ||
The most active photocatalyst, 1% Pt/30% Zn(OH)2/Cd0.3Zn0.7S, was also characterized using an XPS technique before and after four runs of hydrogen evolution (Table 4). After the long-term photocatalytic process, the surface ratio of cadmium to zinc fell from 3.9 to 1.8. At the same time, the surface ratio of sulfur to oxygen increased in contrast. Therefore, β-Zn(OH)2, which according to the synthesis technique probably covers the surface of Cd0.3Zn0.7S, transforms to ε-Zn(OH)2 with a high crystalline size and releases from the surface of the Cd0.3Zn0.7S sulfide. The surface ratio and oxidation state of the deposited platinum (Pt0/Pt2+) were similar before and after four runs (Table 4). This result indicates that the change in activity of the composite photocatalysts is caused by bulk transformations rather than the surface transformations.
| Sample | [Zn]/[Cd] | [O]/[Cd + Zn] | [S]/[Cd + Zn] | [Pt]/[Zn + Cd] | Pt 4f7/2 | |
|---|---|---|---|---|---|---|
| Pt0 | Pt2+ | |||||
| 1% Pt/30% Zn(OH)2/Cd0.3Zn0.7S (fresh) | 3.9 | 1.91 | 0.48 | 0.014 | 71.1 (75%) | 72.4 (25%) |
| 1% Pt/30% Zn(OH)2/Cd0.3Zn0.7S (after four runs) | 1.8 | 1.15 | 0.69 | 0.017 | 71.1 (80%) | 72.4 (20%) |
Therefore, the transformation of 1% Pt/β-Zn(OH)2/Cd0.3Zn0.7S to 1% Pt/ε-Zn(OH)2/Cd0.3Zn0.7S leads to a significant growth in the H2 production rate from the ethanol aqueous solution. It is important to note that up to a seven-fold increase in the rate of the photocatalytic hydrogen evolution was achieved in the case of the ethanol donor during the four catalytic runs, whereas for the hydrogen evolution from the Na2S/Na2SO3 aqueous solution the rate increased only twice (Table 1). Therefore, the heterojunctions between ε-Zn(OH)2 and Cd0.3Zn0.7S can be concluded to be more efficient than those between ZnS and Cd0.3Zn0.7S.
To summarize, the zinc hydroxide co-catalyst in the Zn(OH)2/Cd0.3Zn0.7S composite photocatalysts undergoes sulfurization during the photocatalytic hydrogen production from Na2S/Na2SO3 solution, whereas during the hydrogen evolution from ethanol aqueous solution the transformation of the β-Zn(OH)2 co-catalyst to ε-Zn(OH)2 was realized. A significant increase in the activity accompanies both types of transformations. The highest hydrogen production rates are 3200 μmol g−1 h−1 for 1% Pt/10% Zn(OH)2/Cd0.3Zn0.7S photocatalyst (ethanol) and 8900 μmol g−1 h−1 for the 20% Zn(OH)2/Cd0.3Zn0.7S photocatalyst (Na2S/Na2SO3) which are comparable with recently published data (see Table 5).25–35 Therefore, the sacrificial agent as a reaction media plays a key role in the photocatalyst transformation and affects its catalytic activity (see graphical abstract). This is a very promising result, because it is possible to synthesize a composite photocatalyst by a rather simple technique, and the co-catalyst could be tuned in situ during the process of photocatalytic hydrogen evolution. In our previous works, we made a significant efforts to obtain a system with zinc hydroxide for the desired ε-modification.21 The present study shows that the initial state of the photocatalyst is not as important for its activity.
| Photocatalyst | Sacrificial agent | Light source | Catalytic activity, μmol g−1 h−1 | Ref. |
|---|---|---|---|---|
| Inorganic sacrificial agents | ||||
| ZnS/hydrogel | 0.1 M Na2S, 0.1 M Na2SO3 | Xe lamp | 400 | 1 |
| 30% CdS/Zn2GeO4 | 0.35 M Na2S, 0.25 M Na2SO3 | Xe lamp, λ > 420 nm | 1720 | 2 |
| 0.3% NiS/30% CdS/TiO2 | 0.35 M Na2S, 0.25 M Na2SO3 | Xe lamp, λ > 420 nm | 2159 | 3 |
| 3D CdS/graphene | 0.5 M Na2S, 0.5 M Na2SO3 | Xe lamp, λ > 400 nm | 2310 | 4 |
| 3% Pt/10% CdS/Ti3+/TiO2 | 0.35 M Na2S, 0.25 M Na2SO3 | Xe lamp, λ > 420 nm | 4474 | 5 |
| 5% NC@Mo2N/CdS | 0.25 M Na2S, 0.35 M Na2SO3 | Xe lamp, λ > 400 nm | 7294 | 6 |
| 20% Zn(OH)2/Cd0.3Zn0.7S | 0.1 M Na2S, 0.1 M Na2SO3 | 450-LED | 8900 | This paper |
| 0.5% Pt/CdS/Cu2ZnSnS4 | 0.4 M Na2S, 0.3 M Na2SO3 | Xe lamp, λ > 420 nm | 11![[thin space (1/6-em)]](https://www.rsc.org/images/entities/char_2009.gif) 540 540 |
7 |
![[thin space (1/6-em)]](https://www.rsc.org/images/entities/char_2009.gif) |
||||
| Organic sacrificial reagents | ||||
| 0.2% NiS/CdS | Lignin, lactic acid | Xe lamp, λ > 400 nm | 1086 | 8 |
| CdS/MoS2 QDs/ZnIn2S4 | 20% vol. lactic acid | Xe lamp, λ > 420 nm | 2108 | 9 |
| 5% MoS2/Co0.2Cd0.8S | 10% vol. lactic acid | Xe lamp, λ > 400 nm | 2836 | 10 |
| 1% Pt/10% Zn(OH)2/Cd0.3Zn0.7S | 10% vol. ethanol | 450-LED | 3200 | This paper |
| Co4S3/CdS | 10% vol. lactic acid | Xe lamp, λ > 420 nm | 5893 | 11 |
4. Conclusions
In this study, we have shown for the first time that the nature of the sacrificial agent strongly affects the transformation of the composite photocatalyst during photocatalytic hydrogen production. The composites, which consist of a Cd0.3Zn0.7S photocatalyst and a Zn(OH)2 co-catalyst, are active during the photocatalytic hydrogen evolution under visible light with both inorganic (Na2S/Na2SO3) and organic (ethanol) sacrificial agents, but in Na2S/Na2SO3 solution, the Zn(OH)2 co-catalyst transforms to zinc sulfide, whereas in ethanol solution, β-Zn(OH)2 transforms to ε-Zn(OH)2. Both transformations are accompanied by a significant increase in the photocatalytic activity that is probably due to heterojunctions in the formed pairs of ZnS/Cd0.3Zn0.7S and ε-Zn(OH)2/Cd0.3Zn0.7S, respectively.Conflicts of interest
There are no conflicts of interest to declare.Acknowledgements
The studies were conducted using the equipment at the Center of Collective Use “National Center of Catalyst Research”. This work was supported by the Ministry of Science and Higher Education of the Russian Federation (project AAAA-A17-117041710087-3), by the Russian Foundation for Basic Research (project 18-03-00775), and by the President of the Russian Federation (grant 075-15-2019-1086 (MK-3483.2019.3)).References
- K. I. Zamaraev and V. N. Parmon, Potential methods and perspectives of solar-energy conversion via photocatalytic processes, Catal. Rev.: Sci. Eng., 1980, 22, 261–324, DOI:10.1080/03602458008066536.
- E. A. Kozlova and V. N. Parmon, Heterogeneous semiconductor photocatalysts for hydrogen production from aqueous solutions of electron donors, Russ. Chem. Rev., 2017, 86(9), 870–906, DOI:10.1070/RCR4739.
- Y. Liu, L. Guo, W. Yan and H. Liu, A composite visible-light photocatalyst for hydrogen production, J. Power Sources, 2006, 159, 1300–1304, DOI:10.1016/j.jpowsour.2005.11.105.
- C. Xing, Y. Zhang, W. Yan and L. Guo, Band structure-controlled solid solution of Cd1−xZnxS photocatalyst for hydrogen production by water splitting, Int. J. Hydrogen Energy, 2006, 31, 2018–2024, DOI:10.1016/j.ijhydene.2006.02.003.
- J. Wang, B. Li, J. Chen, N. Li, J. Zheng, J. Zhao and Z. Zhu, Enhanced photocatalytic H2-production activity of CdxZn1−xS nanocrystals by surface loading MS (M = Ni, Co, Cu) species, Appl. Surf. Sci., 2012, 259, 118–123, DOI:10.1016/j.apsusc.2012.07.003.
- D. Ma, J.-W. Shi, Y. Zou, Z. Fan, X. Ji, C. Niu and L. Wang, Rational design of CdS@ZnO core-shell structure via atomic layer deposition for drastically enhanced photocatalytic H2 evolution with excellent photostability, Nano Energy, 2017, 39, 183–191, DOI:10.1016/j.nanoen.2017.06.047.
- D. Ma, J.-W. Shi, D. Sun, Y. Zou, L. Cheng, C. He, H. Wang, C. Niu and L. Wang, Au decorated hollow ZnO@ZnS heterostructure for enhanced photocatalytic hydrogen evolution: the insight into the roles of hollow channel and Au nanoparticles, Appl. Catal., B, 2019, 244, 748–757, DOI:10.1016/j.apcatb.2018.12.016.
- H. Ge, F. Xu, B. Cheng, J. Yu and W. Ho, S-scheme heterojunction TiO2/CdS nanocomposite nanofiber as H2-production photocatalyst, ChemPhotoChem, 2019, 11, 6301–6309, DOI:10.1002/cctc.201901486.
- P. Xing, Z. Chen, P. Chen, H. Lin, L. Zhao, Y. Wu and Y. He, Effectively H2 generation over CdS/KTa0.75Nb0.25O3 composite via water splitting, J. Colloid Interface Sci., 2019, 552, 622–632, DOI:10.1016/j.jcis.2019.05.098.
- Z. Yan, X. Yu, A. Han, P. Xu and P. Du, Noble-metal-free Ni(OH)2-modified CdS/reduced graphene oxide nanocomposite with enhanced photocatalytic activity for hydrogen production under visible light irradiation, J. Phys. Chem. C, 2014, 118, 22896–22903, DOI:10.1021/jp5065402.
- Q. Li, T. Shi, X. Li, K. Lv, M. Li, F. Liu, H. Li and M. Le, Remarkable positive effect of Cd(OH)2 on CdS semiconductor for visible-light photocatalytic H2 production, Appl. Catal., B, 2018, 229, 8–14, DOI:10.1016/j.apcatb.2018.01.078.
- D. Lang, F. Cheng and Q. Xiang, Enhancement of photocatalytic H2 production activity of CdS nanorods by cobalt-based cocatalyst modification, Catal. Sci. Technol., 2016, 6, 6207–6216, 10.1039/C6CY00753H.
- G. Sun, S. Mao, D. Ma, Y. Zou, Y. Lv, Z. Li, C. He, Y. Chengs and J.-W. Shi, One-step vulcanization of Cd(OH)Cl nanorods to synthesize CdS/ZnS/PdS nanotubes for highly efficient photocatalytic hydrogen evolution, J. Mater. Chem. A, 2019, 7, 15278–15287, 10.1039/c9ta03862k.
- L. Zhang, B. Tian, F. Chen and J. Zhang, Nickel sulfide as co-catalyst on nanostructured TiO2 for photocatalytic hydrogen evolution, Int. J. Hydrogen Energy, 2012, 37, 17060–17067, DOI:10.1016/j.ijhydene.2012.08.120.
- J. Zhang, Q. Xu, S. Z. Qiao and J. Yu, Enhanced visible-light hydrogen-production activity of copper-modified ZnxCd1−xS, ChemSusChem, 2013, 6, 2009–2015, DOI:10.1002/cssc.201300409.
- S. Zang, G. Zhang, Z.-A. Lan, D. Zheng and X. Wang, Enhancement of photocatalytic H2 evolution on pyrene-based polymer promoted by MoS2 and visible light, Appl. Catal., B, 2019, 251, 102–111, DOI:10.1016/j.apcatb.2019.03.061.
- F. Zhang, H.-Q. Zhuang, W. Zhang, J. Yin, F.-H. Cao and Y.-X. Pan, Noble-metal-free CuS/CdS photocatalyst for efficient visible-light-driven photocatalytic H2 production from water, Catal. Today, 2019, 330, 203–208, DOI:10.1016/j.cattod.2018.03.060.
- D. V. Markovskaya, E. A. Kozlova, S. V. Cherepanova, A. A. Saraev, E. Yu. Gerasimov and V. N. Parmon, Synthesis of Pt/Zn(OH)2/Cd0.3Zn0.7S for the photocatalytic hydrogen evolution from aqueous solutions of organic and inorganic electron donors under visible light, Top. Catal., 2016, 59, 1297–1304, DOI:10.1007/s11244-016-0656-1.
- G. K. Boreskov, Heterogeneous Catalysis, Nauka, Moscow, 1986 Search PubMed.
- L. Wang, W. Wang, M. Shang, W. Yin, S. Sun and L. Zhang, Enhanced photocatalytic hydrogen evolution under visible light over Cd1−xZnxS solid solution with cubic zinc blend phase, Int. J. Hydrogen Energy, 2010, 35, 19–25, DOI:10.1016/j.ijhydene.2009.10.084.
- E. A. Kozlova, S. V. Cherepanova, D. V. Markovskaya, A. A. Saraev, E. Yu. Gerasimov and V. N. Parmon, Novel photocatalysts Pt/Cd1−xZnxS/ZnO/Zn(OH)2: activation during hydrogen evolution from aqueous solutions of ethanol under visible light, Appl. Catal., B, 2016, 183, 197–205, DOI:10.1016/j.apcatb.2015.10.042.
- E. A. Kozlova, D. V. Markovskaya, S. V. Cherepanova, A. A. Saraev, E. Yu. Gerasimov, T. V. Perevalov, V. V. Kaichev and V. N. Parmon, Novel photocatalysts based on Cd1−xZnxS/Zn(OH)2 for the hydrogen evolution from water solutions of ethanol, Int. J. Hydrogen Energy, 2014, 39, 18758–18769, DOI:10.1016/j.ijhydene.2014.08.145.
- E. A. Kozlova, M. N. Lyulyukin, D. V. Markovskaya, D. S. Selishchev, S. V. Cherepanova and D. V. Kozlov, Synthesis of Cd1−xZnxS Photocatalysts for Gas-Phase CO2 Reduction Under Visible Light, Photochem. Photobiol. Sci., 2019, 18, 871–877, 10.1039/c8pp00332g.
- S. Cherepanova, D. Markovskaya and E. Kozlova, Identification of a deleterious phase in photocatalyst based on Cd1−xZnxS/Zn(OH)2 by simulated XRD patterns, Acta Crystallogr., Sect. B: Struct. Sci., Cryst. Eng. Mater., 2017, 73, 360–368, DOI:10.1107/S2052520617001664.
- Z. Jiang, X. Zhang, G. Yang, Z. Yuan, X. Ji, F. Kong, B. Huang, D. D. Dionysiou and J. Chen, Hydrogel as a miniature hydrogen production reactor to enhance photocatalytic hydrogen evolution activities of CdS and ZnS quantum dots derived from modified gel crystal growth method, Chem. Eng. J., 2019, 373, 814–820, DOI:10.1016/j.cej.2019.05.112.
- Z. Hou, X. Zou, X. Song, X. Pu, Y. Geng and L. Wang, Fabrication of CdS/Zn2GeO4 heterojunction with enhanced visible-light photocatalytic H2 evolution activity, Int. J. Hydrogen Energy, 2019, 44, 28649–28655, DOI:10.1016/j.ijhydene.2019.08.232.
- N. X. Li, H. L. Huang, R. Bibi, Q. S. Shen, R. Ngulube, J. C. Zhou and M. C. Liu, Noble-metal-free MOF derived hollow CdS/TiO2 decorated with NiS cocatalyst for efficient photocatalytic hydrogen evolution, Appl. Surf. Sci., 2019, 476, 378–386, DOI:10.1016/j.apsusc.2019.01.105.
- Z. Wang, Z. Liu, J. Chen, H. Yang, J. Luo, J. Gao, J. Zhang, C. Yang, S. Jia and B. Liu, Self-assembly of three-dimensional CdS nanosphere/graphene networks for efficient photocatalytic hydrogen evolution, J. Energy Chem., 2019, 31, 34–38, DOI:10.1016/j.jechem.2018.05.006.
- Y. Qin, H. Li, J. Lu, F. Meng, C. Ma, Y. Yan and M. Meng, Nitrogen-doped hydrogenated TiO2 modified with CdS nanorods with enhanced optical absorption, charge separation and photocatalytic hydrogen evolution, Chem. Eng. J., 2020, 384 DOI:10.1016/j.cej.2019.123275.
- R. Mu, Y. Ao, T. Wu, C. Wang and P. Wang, Synergistic effect of molybdenum nitride nanoparticles and nitrogendoped carbon on enhanced photocatalytic hydrogen evolution performance of CdS nanorods, J. Alloys Compd., 2020, 812, 151990, DOI:10.1016/j.jallcom.2019.151990.
- M. Yuan, W.-H. Zhou, D.-X. Kou, Z.-J. Zhou, Y.-N. Meng and S.-X. Wu, Cu2ZnSnS4 decorated CdS nanorods for enhanced visible-light-driven photocatalytic hydrogen production, Int. J. Hydrogen Energy, 2018, 43, 20408–20416, DOI:10.1016/j.ijhydene.2018.09.161.
- C. Li, H. Wang, S. B. Naghadeh, J. Z. Znang and P. Fang, Visible light driven hydrogen evolution by photocatalytic reforming of lignin and lactic acid using one-dimensional NiS/CdS nanostructures, Appl. Catal., B, 2018, 227, 229–239, DOI:10.1016/j.apcatb.2018.01.038.
- W. Chen, R.-Q. Yan, J.-Q. Zhu, G.-B. Huang and Z. Chen, Highly efficient visible-light-driven photocatalytic hydrogen evolution by all-solid-state Z-scheme CdS/QDs/ZnIn2S4 architectures with MoS2 quantum dots as solid-state electron mediator, Appl. Surf. Sci., 2020, 504, 144406, DOI:10.1016/j.apsusc.2019.144406.
- Q. Deng, T. Miao, Z. Wang, Y. Xu and X. Fu, Compositional regulation and modification of the host CdS for efficient photocatalytic hydrogen production: case study on MoS2 decorated Co0.2Cd0.8S nanorods, Chem. Eng. J., 2019, 378, 122139, DOI:10.1016/j.cej.2019.122139.
- R. Huang, W. Chen, Y. Zhang, Z. Huang, Y. Zhou, Y. Wu and X. Lv, Two dimensional metal–organic frameworks-derived leaf-like Co4S3/CdS composite for enhancing photocatalytic water evolution, J. Colloid Interface Sci., 2019, 554, 39–47, DOI:10.1016/j.jcis.2019.06.098.
Footnote |
| † Electronic supplementary information (ESI) available. See DOI: 10.1039/c9ra08833d |
| This journal is © The Royal Society of Chemistry 2020 |

