 Open Access Article
A centrifugation-assisted visual detection of SNP in circulating tumor DNA using gold nanoparticles coupled with isothermal amplification†
Yusong Wang‡
 *a,
Say Li Kong*b and
Xiao Di Suacd
aInstitute of Materials Research and Engineering (IMRE), Agency for Science, Technology and Research (A*STAR), 2 Fusionopolis Way, Innovis, #08-03, Singapore 138634. E-mail: Wang_Yusong@sbic.a-star.edu.sg; xd-su@imre.a-star.edu.sg
bGenome Institute of Singapore (GIS), Agency for Science, Technology and Research (A*STAR), 60 Biopolis Street, #02-01, Genome, Singapore 138672. E-mail: kongsl@gis.a-star.edu.sg
cDepartment of Chemistry, National University of Singapore, Block S8, Level 3, 3 Science Drive 3, Singapore 117543
dSchool of Engineering and Science, University of the Sunshine Coast, 90 Sippy Downs Dr, Sippy Downs QLD 4556, Australia
First published on 8th January 2020
Abstract
Detection of single-nucleotide polymorphism (SNP) in circulating tumor DNA (ctDNA) is challenging because of the large DNA fragmentation (∼150 nt) and the strong background of normal cell free DNA (cfDNA). Here we developed a rapid centrifugation-assisted colorimetric assay using gold nanoparticles (AuNPs) coupled with isothermal amplification to detect a SNP (G to C mutation) in KRAS, p.G13D in ctDNA. Compared to conventional AuNP aggregation assays, our assay contains four unique design concepts. Firstly, a centrifugation step is introduced at the end of the reaction that significantly enhances the colorimetric readout by providing visually distinct precipitation for the SNP ctDNA. Secondly, to achieve a fast turnover rate for clinical pM demand, a “critical linker concentration” concept is introduced to the assay. Thirdly, in order to achieve an unambiguous differentiation of the SNP ctDNA from wild type cfDNA and the control sample without DNA, a “color code conversion” strategy is employed, where a complementary sequence of the linker DNA is introduced to manipulate the AuNP aggregation. Finally, ethylenediaminetetraacetic acid is used for enzyme inactivation only at room temperature while stabilizing the AuNP solution from unwanted aggregation. Our assay coupling two amplification strategies (isothermal amplification and centrifugation-assisted assembly) is capable of both quantitative and qualitative differentiation of SNP in ctDNA of ∼150 nt at a clinically relevant concentration and 67 pM limit of detection and in the presence of 99% normal cfDNA background. This assay can be used for point-of-care colon cancer diagnosis and prognosis with a fast turnover time (<2 h).
1 Introduction
Circulating tumor DNA (ctDNA) is an important biomarker for non-invasive cancer diagnosis. KRAS oncogene mutation has been found in about 35–45% of colorectal cancer cases,1 with the majority of the single nucleotide point mutations typically occurring in codon 12 and 13. As such, detection of KRAS single-nucleotide polymorphism (SNP) mutations in circulation can provide useful information related to tumor burden and patient's response to therapy. However, detection of ctDNA SNP is challenging because of the long ctDNA strains, typically around 150 bp, and the presence of a large quantity of normal cell free DNA (cfDNA). Currently, ctDNA detection mostly employs digital droplet PCR-based or next-generation sequencing method with capability to detect a few copies of DNA, which relies on repeated thermal cycles, and typically takes more than 2–14 days for a readout. The instrument-intensive and time-consuming process hampers the point-of-care (POC) assay application.Gold nanoparticles (AuNPs) based DNA colorimetric assay has been implemented as POC detection without sophisticated instruments and rapid turnaround time.2 However, these AuNPs-based DNA detection suffer from relatively poor limit of detection (LOD) (∼nM), and most assays are designed for short DNA of ∼20–30 bp. In the meantime, isothermal amplification has also emerged as an alternative to PCR process for trace amount of DNA detection with PCR-like sensitivity,3 without using thermal cycle process. Various isothermal amplification strategies are available, such as the loop-mediated isothermal amplification (LAMP), hybridization chain reaction (HCR), strand-displacement amplification, and exonuclease-based cyclic amplification, to enhance detection signal in linear and or exponential amplification way.3,4 However, most isothermal amplification assays need fluorophore labeling, and expensive reagent.3–5
Integration of AuNP-based color detection with isothermal amplification has been reported for DNA detection, aiming to achieve POC application with clinically relevant high sensitivity.3,6 For example, by coupling Exonuclease III (ExoIII) recycling cleavage reaction into AuNPs colorimetric assay, one can detect SNP in a 32 nucleotide (nt) KRAS with 20 pM LOD at 37 °C,7 and in a 33 nt DNA with a 2 nM LOD at room temperature (RT).8 Enzyme-free hybridization chain reaction has also been developed with colorimetric AuNP assembly to detect Ebola all four virus subtypes DNA biomarker (24 nt).9 Most of these reports are for short DNA biomarkers (20–30 bp).7–9 It has been very challenging for SNP detection in clinical ctDNA (average of 150 bp length, more diverse conformation and secondary structure in need of assay consideration) with high detection sensitivity, and more importantly in the complicated high background interference. These are, however, essential for circulating DNA biomarker detection for diagnosis and prognosis.
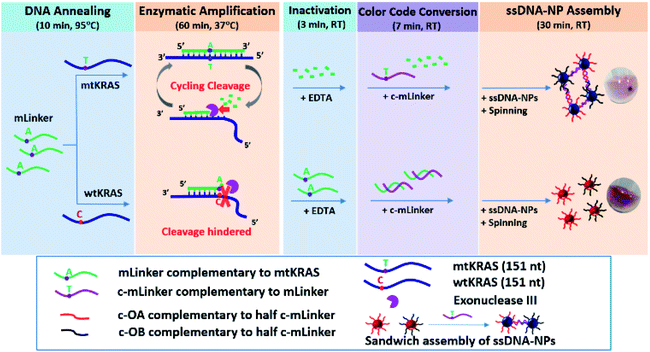
To address the above mentioned challenges, we redesigned the AuNPs-based colorimetric assay for ctDNA using the ExoIII-based amplification (Fig. 1). It is a dual signal amplification strategy, combining DNA isothermal amplification and centrifugal assisted DNA–NPs assembly at the end of the enzymatic reaction. The assay contains four unique assay design and condition concepts: (1) introduction of a centrifugation step that significantly enhances the colorimetric readout by providing visually distinct precipitation for SNP ctDNA; (2) application of “critical linker concentration” concept in the first time to achieve a fast turnover rate at pM sensitivity; (3) employment of “color code conversion” strategy to achieve an unambiguous differentiation of the mutant ctDNA from all reference samples, i.e. wild type cfDNA sample, the one without DNA and the original sensing materials; (4) introduction of a room temperature (RT) enzyme inactivation by ethylenediaminetetraacetic acid (EDTA), in which EDTA serves an additional role to stabilize the AuNP solution from unwanted aggregation in the enzymatic reaction buffer.
With these assay development and findings, our sensing platform enables a rapid POC visual detection of SNP in ctDNA (67 pM LOD, 1% mutant KRAS (mtKRAS) in 99% of wildtype KRAS (wtKRAS), <2 h). This work has significantly improved the AuNP aggregation-based colorimetric assay, and hence leading to a step closer towards POC application.
2 Experiment section
2.1 Materials
AuNPs (∼13 nm in diameter) were synthesized in aqueous solution using standard citrate reduction procedure.10 Tris(2-carboxyethyl)phosphine hydrochloride (TCEP), Tris–HCl buffer (1.0 M), ethylenediaminetetraacetic acid (EDTA), CaCl2, MgCl2, and centrifugal filter device (PALL, Nanosep 3K Omega) were purchased from Sigma-Aldrich. HCl (37% concentrate in water), NaOH, and NaCl were purchased from Merck. Exonuclease III (ExoIII) was purchased from New England Biolabs. Enzyme reaction buffer (20 mM Tris–HCl, 75 mM NaCl, 20 mM CaCl2, 3 mM MgCl2, pH = 7.9) and HEPES buffer (5 mM) were prepared in our laboratory. PBS buffer (150 mM, pH = 7.4) was obtained from 1st base. Elution buffer (Buffer AVE, 10 mM Tris–HCl, pH 8.5) was purchased from Qiagen.All DNA oligonucleotides including the modified sequences were purchased from IDT Company. The sequences are shown in Table S1 (ESI†). The “wtKRAS” and “mtKRAS” are cfDNA targets of 151 nt long without or with a T to C base substitution, respectively. The “mLinker” is 18mer oligo fully complementary to the mtKRAS at the region containing the point mutation. The “OA” and “OB” are disulphide-protected single stranded DNA (ssDNA), each being complementary to half of the mLinker. OA and OB were used to prepare two sets of conjugates with the AuNPs for sandwich assembly induced by the mLinker (See Fig. S1, ESI†). The “c-mLinker” is complementary to the mLinker, and serves the color conversion. The “c-OA” and “c-OB” are DNA oligos, each being complementary to half of the c-mLinker.
2.2 Preparation of single stranded DNA–nanoparticle (ssDNA–NPS)
The ssDNA–NPs were prepared by low pH conjugation with slight modifications.11,12 Typically, disulphide-protected OA or OB ssDNA was firstly activated by adding 4.2 μL TCEP (60 mM) into 100 μL of ssDNA (100 μM) solution and mixing for 20 minutes. The solution was further diluted to 700 μL with HEPES buffer and centrifuged using centrifugal filter device (PALL, Nanosep 3K Omega). The purified ssDNA sample was then tested by UV-vis absorbance spectrophotometer (Shimadzu, UV2450) to determine ssDNA concentration using Beer's Lambert law.After that, the activated ssDNA (10 μL, 50 μM) was mixed with TCEP (1 μL, 60 mM) for 10 minutes followed by addition of AuNP solution (265 μL, 9.43 nM) and topping up to the total volume of 500 μL with 5 mM HEPES buffer. After incubation for 5 minutes, solution pH was lowered to 3 by adding HCl (1 M), and salt concentration was increased to 30 mM by adding NaCl (2 M). After incubation for 20 minutes, NaOH (1 M) was added into the above solution to neutralize the solution pH. Finally, the prepared ssDNA–NPs conjugates were purified by centrifugation. The supernatant was collected for UV-vis measurement to indirectly determine the DNA surface density on AuNP.13 The collected ssDNA–NPs were purified by centrifugation one more time and redispersed in PBS buffer and stored at 4 °C until further use.
2.3 Sandwich ssDNA–NP assembly and determination of “critical linker concentration”
The sandwich ssDNA–AuNP assembly was done by mixing equal amount of ssDNA–NP conjugates and mLinker probe in PBS buffer, and incubating at RT for 30 minutes. The “OA” and “OB” are disulphide-protected single stranded DNA (ssDNA), each being complementary to half of the mLinker, and used to immobilized onto AuNP to form a pair of ssDNA–NP conjugates.This sandwich assembly was used to determine the critical linker concentration/minimum linker (mLinker probe) concentration, which can induce aggregation of the OA–NP and OB–NP after 30 minutes incubation, by giving three times of the ratio of absorbance at 700 and 520 nm (A700/A520) relative to the reference DNA–NPs in the absence of mLinker, and a visually obvious precipitation following a brief spinning at 6000 rpm for ∼10 seconds (s).
2.4 Assay procedures
The assay includes five steps: (1) DNA annealing. In a reaction tube, mLinker probe solution was mixed with wtKRAS or mtKRAS of different concentration in the enzyme reaction buffer, and incubated at a heating block (Eppendorf) at 95 °C for 10 minutes. The sample tubes were removed from heating block, and suspended on a vial rack to cool down to RT. (2) Enzymatic amplification. ExoIII (final concentration with 10 U enzyme in ∼15 μL total reaction solution) was added to pre-annealed DNA tubes, followed by incubation at the heating block pre-set nominal 37 °C for 1 hour. (3) Inactivation of enzyme. 3 μL EDTA (500 mM) was added into the above enzyme reaction solution (∼15 μL) at RT, and incubating for 3 minutes. The effect of EDTA on inactivation of the enzymatic reaction was confirmed by experiments with (3a) mLinker probe only; (3b) mLinker probe and ExoIII enzyme; and (3c) mLinker probe, ExoIII and EDTA. (4) Color code conversion. The same amount of c-mLinker as the mLinker used in the DNA annealing, was added into the previous reaction solution and stand still at room temperature for 7 min to allow full hybridization between c-mLinker and left amount of mLinker. (5) Au NPs assembly for the ctDNA detection. After enzyme inactivation and color code conversion when applicable, 8 μL PBS buffer (150 mM), and ssDNA–NP (OA–NP and OB–NP, each with 5 μL) was subsequently added into the above 13.6 μL enzyme-inactivated NP solution and with a brief mixing. Samples were then incubated for 30 minutes at RT before UV-vis characterization. Camera images were taken for the incubated samples after a brief spinning (6000 rpm, ∼10 s) using a portable microcentrifuge.The effect of EDTA on colloidal stability was studied by mixing equal amount of ssDNA–NP conjugates (OA–NP and OB–NP) with different buffer solutions including (1) 8 μL water, (2) 8 μL reaction buffer, (3) 2 μL EDTA (500 mM), and (4) 8 μL reaction buffer and 2 μL EDTA (500 mM). After incubation for 30 minutes, UV-vis spectra was recorded. In addition, camera image was recorded after a brief spinning (6000 rpm, ∼10 s) for each incubation solution.
2.5 Detection of mtKRAS in wild type cfDNA background
To test the clinical relevance of the assay, a mixture of wtKRAS and mtKRAS with different mtKRAS percentages ranging from 0% to 100% mtKRAS were used as the test sample. Signals of these mixture were recorded relative to control sample (no KRAS). All ctDNA samples were diluted in elution buffer (AVE buffer, Qiagen) which was used in the DNA cleanup and purification from clinical patient samples.2.6 Instrumentations and methods
UV-vis absorbance measurement was perfromed by BioTek platereader (Synergy 2, Multi-Mode Reader), Tecan platereader (M200), or Shimadzu UV 2450 Spectrophotometer. Standard 384-well plates (PS, transparent, Corning®) were used for absorbance measurement on all plater reader machines. Background signal was subtracted before obtaining each sample spectrum. All images of DNA–Au NP solution were taken using mobile camera (Apple iPhone), which were done after applying to the sample solutions with a brief spinning at 6000 rpm (∼10 s) in a portable microcentrifuge (Cole-Parmer Personal Microcentrifuge).3 Results and discussion
3.1 Strategy of the centrifugation-assisted isothermal amplification colorimetric ctDNA assay
Fig. 1 shows our SNP ctDNA assay procedure, including five major steps: (1) linker probe and target DNA annealing (10 min at 95 °C), (2) enzymatic amplification reaction (1 h at 37 °C), (3) inactivation of enzymatic activity by EDTA (3 min at RT), (4) color code conversion by adding a DNA probe complementary to the mLinker (7 min at RT), and (5) ssDNA–AuNPs assembly (30 min at RT) assisted by a brief centrifugation (6000 rpm, ∼10 s).The assay starts from the annealing of the probe DNA (mLinker, fully complementary to the mtKRAS) with target DNA (mtKRAS or wtKRAS), which is followed by enzymatic cleavage reaction by the structure-selective exonuclease Exo III (10 units in ∼15 μL enzyme reaction buffer). The enzymatic reaction amplifies the difference between mtKRAS and wtKRAS by selectively digesting the mLinker in the mLinker–mtKRAS duplexes, via a typical isothermal cyclic cleavage reaction. As a result the mLinker probe are digested from the recessed 3′ to 5′-termini of the mLinker–mtKRAS duplex in a cyclic way, leaving behind the cleaved residue DNA fragments. In contrast, for wtKRAS, the mLinker–wtKRAS duplex structure carries a mismatch nucleotide site that inhibits the ExoIII cleavage. The partial digested duplex remain stable in the enzyme reaction buffer containing divalent ions (Mg2+ and Ca2+).14,15 Thus, a large amount of mLinker will remain in the solution.
After the enzymatic selective digestion using mLinker, EDTA is added to inactivate the enzyme. This makes sure that the linker-induced ssDNA–AuNP sandwich assembly will not be disturbed by the ExoIII digestion, which is effective for any DNA duplex from 3′ to 5′. At the end of inactivation, c-mLinker (the ssDNA probe fully complementary to the mLinker) is introduced. After 7 min of attempted hybridization (if mLinker remains present), followed by addition of two sets of ssDNA–AuNPs conjugates (c-OA–AuNPs and c-OB–AuNPs), each carrying a ssDNA that is complementary to half of the c-mLinker. For the mtKRAS, where mLinker is fully digested, the c-mLinker is available to assembly the c-OA–AuNPs and c-OB–AuNPs conjugates. In contrast, for wild-type DNA, the c-mLinker will form duplex with the mLinker remaining in the solution, leaving red disperse ssDNA–AuNP solution. The use of the c-mLinker allows mtKRAS “light-on” response standing out all other samples. A brief spinning/centrifugation step is then introduced for fast formation of AuNPs precipitation in mtKRAS, which further amplify the mutation differentiation between mtDNA and wtDNA. This leads to an unambiguous naked eye inspection of the presence of SNP in the ctDNA sample.
For the above assay strategy, a range of design parameters and procedure conditions (e.g. critical linker concentration, enzyme inactivation strategy, color conversion approach, and brief centrifugation assistance) were studied and optimized, to fulfill: (1) a quantitative measurement of three times of the (A700/A520) ratio of the mtKRAS relative to the wtKRAS in 30 min incubation, and (2) visual detection of precipitation after a brief spinning. Details are given in the following sessions.
3.2 Assay development
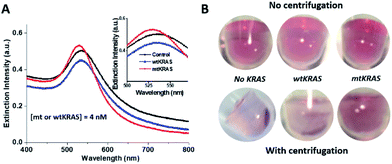 | ||
| Fig. 2 Centrifugation-amplified specific ssDNA–NP assembly for ctDNA mutation differentiation. (A) UV-vis spectra of the ssDNA–NP assembly after 30 min incubation in the enzyme reaction solution, for the mtKRAS, wtKRAS and control sample (no KRAS, or absence of DNA). (B) Corresponding color images of the ssDNA–NP assembly solutions without (upper panel) and with a brief spinning at 6000 rpm for 10 s (lower panel). Note that all sequences of OA, OB, mLinker, wtKRAS and mtKRAS refer to Table S1 (ESI†), and [mt or wtKRAS] = 4 nM during enzyme reaction. | ||
The centrifugation-facilitated OA–NP and OB–NP assembly for both wtKRAS and the control (no KRAS) samples is presumably due to several factors favorable for the hybridization. Specifically, the centrifugation would drag DNA-NPs towards the bottom of reaction vial, and increase local concentration of DNA–NPs. This higher concentration leads to a faster on-particle DNA hybridization kinetic process to form bigger DNA–NP cluster or promote the mLinker-induced AuNP aggregation. This process repeats and eventually leads to a large DNA–NP networks. Secondly, centrifugal force will harvest as-formed small DNA–NP clusters and concentrate them in the bottom of reaction vial, increasing the contrast between NPs and the background. Without the centrifugation, the DNA sandwich assembly takes longer time and appear stable in a short time scale.
The above results clearly shown that a brief spinning step can amplify the difference between mtKRAS and wtKRAS. Together with enzyme-based isothermal amplification, the developed dual signal amplifications (isothermal amplification and centrifugal amplification) enabled a naked-eye SNP detection of KRAS (151 nt) with a simple precipitate qualitative assay. To develop a sensitive and fast ctDNA SNP detection for POC application (simple & cost-effective assay without sophisticated instruments/expensive reagent), we set this condition (30 min ssDNA–NP incubation followed by a brief centrifugation) as the final assay step. Other parameter optimizations were then performed with the visual outcome as reference.
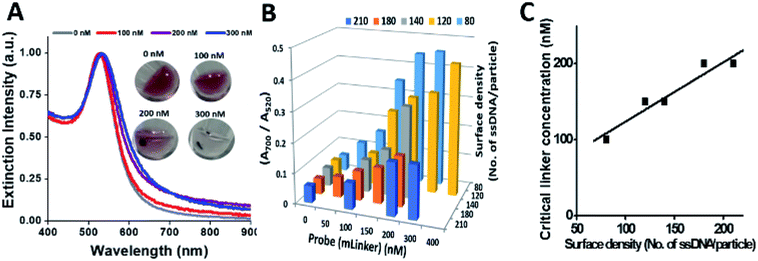
Fig. 3A shows the UV-vis spectra of ssDNA–NP sandwich assembly (DNA density of 210 ssDNA per NP) by different concentration of mLinker (0–300 nM) after 30 min incubation. In the presence of 100 nM, 200 nM, and 300 nM linker, a peak shift of 1 nm, 6 nm and 9 nm relative to the conjugates alone (0 nM linker) were observed, respectively. After a spinning for ∼10 s at 6000 rpm, precipitation appears obviously at 200 nM and above (color photo in Fig. 3A). Hence, 200 nM is termed as critical linker concentration for the ssDNA–NP pair (210 ssDNA/NP). At this critical linker concentration, the ratio of A700/A520 is 0.174, being ∼3 times of that for the reference sample (0.052 for 0 nM linker). We have set this value of three times of the control as another criteria for critical linker concentration determination. This criteria and visual precipitation correspond with each other well.
Similarly, for ssDNA–NPs with different surface density (80–210 ssDNA/NP) (Fig. 3B), using the criteria of A700/A520 value being 3 times higher than the control (no linker) and brief spinning could give the distinct NP aggregate states from the control (images data not shown) as measures, respective critical linker concentrations are derived (Fig. 3C). It is found that an increased surface density of ssDNA–NP results in an increased critical linker concentration. Considering colloidal stability and minimum nonspecific adsorption, the ssDNA–NP pair of ∼200 ssDNA/NP (with the corresponding 200 nM critical linker concentration) was used for the following assay development and optimization.
Additional role of EDTA was identified when we studied the colloidal stability in the enzyme reaction buffer. It is found that the reaction buffer medium can cause ssDNA–NP aggregation (redshift of LSPR band in reaction buffer relative to that in water, and significant precipitates after a briefing spinning; see Fig. S3, ESI†). This is probably due to the high ionic strength of reaction buffer, which containing 20 mM Tris–HCl buffer 20 mM, 20 mM Ca2+ and 3 mM Mg2+, conducive for ExoIII structure-selective digestion.8 Interestingly, applying EDTA into the enzyme reaction buffer enables the ssDNA–NP to remain stable (overlapped UV-vis spectrum of “reaction buffer + EDTA” with that in water or EDTA aqueous solution, and red stable colloid solution after spinning; see Fig. S3, ESI†).
The above observations reveal interesting roles of EDTA in the enzyme-based amplified AuNP ctDNA detection. The simple addition of EDTA can serve the purposes of both enzyme inactivation and maintaining colloidal stability. The stabilization effect could be explained by the chelating capability of EDTA that can remove divalent ion such as Mg2+ and Ca2+, the causes of both structure-selective digestion of ExoIII and ssDNA–NP aggregation.
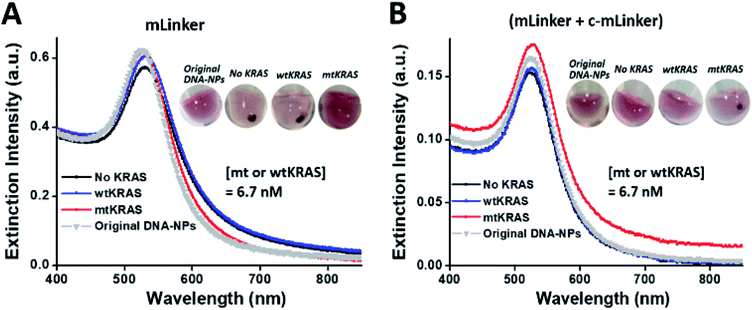
To address this concern, we introduced an additional DNA probe (i.e. c-mLinker) that is fully complementary to the linker DNA (i.e. mLinker) at the end of enzymatic reaction before the ssDNA assembly and redesigned the c-OA–NP and c-OB–NP (the ssDNA on the two sets of AuNPs conjugates each complementary to half of the c-mLinker). This DNA probe together with the new ssDNA–AuNP pairs can enable the color conversion. Typically, peak right shift (∼3 nm) is observed now for the mtKRAS sample, relative to the control (no KRAS), wild-type, and original sensing materials (Fig. 4B). A further briefing spinning (6000 rpm, ∼10 s) brings us a visual differentiation for the mtKRAS relative to other samples, i.e. precipitate status for mtKRAS but red disperse status for the wtKRAS, control (no KRAS), and original DNA–NP sensing materials (see the inset in Fig. 4B). These results clearly show that by adding the additional c-mLinker, color code of visual ctDNA detection has been conversed, led to mtKRAS analyte standing out from all the others in a “light on” mode.
3.3 SNP detection of the KRAS point mutation in the background of wtKRAS
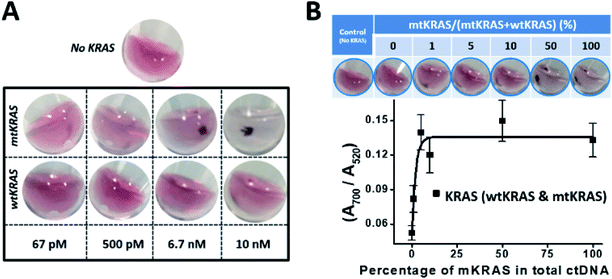
With the above optimized assay design and assay conditions, using the mLinker as probe targeting a point mutation in 151 nt mtKRAS ctDNA (p.G13D) and adding a step of c-mLinker color convertion (totally 5 steps of the assay as shown in Fig. 1), we have then determined the LOD of the assay with the concentration ranging from 10 nM down to 67 pM. Control sample (no KRAS) is used as a reference to validate the assay, particularly to ensure the enzymatic reaction works.As seen from images of the wild type and mutant type KRAS in Fig. 5A, the assay can differentiate the mtKRAS from wtKRAS for all tested concentrations. Fig. S4 (ESI†) presents detection spectra before the brief spinning, which also show detectable spectrum difference between mtKRAS and wtKRAS sample at concentration above 6.7 nM. Lower than this concentration, UV-vis spectra can't resolve the difference or the difference is too small to be reliably distinguishable. Upon a brief spinning, a drastical difference between wtKRAS and mtKRAS could be unambiguously identified at 500 pM and even at 67 pM (Fig. 5A). The current LOD of 67 pM is equivalent to 1% mutant KRAS in 30 μL of elution buffer of 20 ng DNA for ctDNA of ∼150 bp, which occurs in most colon cancer patients.16
In actual patient sample, mutant KRAS often presents in a large background of normal DNA. Thus, we have validated the assay for detection of the mtKRAS in the presence of wtKRAS background (Fig. 5B). A mixed KRAS ctDNA was prepared with different percentage of mtKRAS and wtKRAS, ranging from 0%, 1%, 5%, 10%, 50%, and 100% mtKRAS relative to the total ctDNA. A control experiment with sample containing no KRAS DNA was performed. Focusing on the ssDNA–NPs assembly solution before spinning, UV-vis spectrum shows that the ratio of A700/A520 increases when mtKRAS percentage increases (Fig. S5, ESI† and 5B). This trend follows our expectation because with more mtKRAS in the mixture, the ssDNA–NPs solution is more aggregated (larger ratio of A700/A520). The curve can serve as a quantitative measurement of the percentage of mtKRAS at as little as 1%. After spinning, the trend is visually more obvious, i.e. higher percentage of mtKRAS comes with more pronounced DNA–NP precipitation, and show visually distinguishable at 1% mtKRAS. These results clearly demonstrate that our c-mLinker assay system is effective to differentiate the mtKRAS in the presence of wtKRAS background. The unambiguous POC readout (precipitates only for mKRAS sample vs. red dispersion for all others) will be appreciated by resource-limited setting for cancer diagnosis and prognosis.
4 Conclusions
In summary, we have developed a method for rapid POC visual detection of SNP in ctDNA (151 nt KRAS) as a liquid biopsy tool. It is an AuNP-based colorimetric method combining enzymatic isothermal amplification (ExoIII-based isothermal cyclic cleavage reaction) and centrifugal amplification. Different from conventional AuNP colorimetric assay, a centrifugation step by a brief spinning using a portable microcentrifuge was introduced in the assay development. This step significantly amplifies the mutation difference by providing visually distinct precipitation for mtKRAS down to 67 pM LOD, and in a 99% background of normal ctDNA.For better POC application, we have also introduced a few critical design concepts to make the assay more robust and operation convenient at clinical setting with a fast turn over time. These design concepts include the definition of “critical linker concentration” for fast turn over (<2 h) and more sensitive mtKRAS (151 nt) assay, RT enzyme inactivation without conventional heating by using EDTA which is also contributing to the colloid stabilization from unwanted aggregation in the enzymatic reaction buffer, and a color code conversion allowing mtKRAS unambiguously standing out of all reference samples (wtKRAS, no KRAS, and the original ssDNA–NPs). This work demonstrates critical improvements of AuNP aggregation-based ExoIII isothermal assay, allowing for non-invasive cancer diagnosis and prognosis towards POC applications.
Conflicts of interest
There are no conflicts to declare.Acknowledgements
We would like to thank Axel M. Hillmer for providing the facility and Huay Mei Poh for technical assistance in GIS in this project. This work was conducted in both GIS and IMRE. This work was supported by the Career Development Award (14302FG096) by Joint Council Office (JCO), Agency for Science, Technology and Research (A*STAR), Singapore.References
- A. Lievre, J. B. Bachet, V. Boige, A. Cayre, D. Le Corre, E. Buc, M. Ychou, O. Bouché, B. Landi, C. Louvet, T. André, F. Bibeau, M. D. Diebold, P. Rougier, M. Ducreux, G. Tomasic, J. F. Emile, F. Penault-Llorca and P. Laurent-Puig, J. Clin. Oncol., 2008, 26, 374–379 CrossRef CAS PubMed.
- J. J. Storhoff and C. A. Mirkin, Chem. Rev., 1999, 99, 1849–1862 CrossRef CAS PubMed.
- Y. Zhao, F. Chen, Q. Li, L. Wang and C. Fan, Chem. Rev., 2015, 115, 12491–12545 CrossRef CAS PubMed.
- R. Duan, X. Lou and F. Xia, Chem. Soc. Rev., 2016, 45, 1738–1749 RSC.
- X. Zuo, F. Xia, Y. Xiao and K. W. Plaxco, J. Am. Chem. Soc., 2010, 132, 1816–1818 CrossRef CAS PubMed.
- X. Xie, W. Xu and X. Liu, Acc. Chem. Res., 2012, 45, 1511–1520 CrossRef CAS.
- L. Cui, G. Ke, W. Y. Zhang and C. J. Yang, Biosens. Bioelectron., 2011, 26, 2796–2800 CrossRef CAS PubMed.
- S. Wu, P. Liang, H. Yu, X. Xu, Y. Liu, X. Lou and Y. Xiao, Anal. Chem., 2014, 86, 3461–3467 CrossRef CAS PubMed.
- M. Balcioglu, M. Rana, M. S. Hizir, N. M. Robertson, K. Haque and M. V. Yigit, Adv. Healthcare Mater., 2017, 6, 1600739 CrossRef PubMed.
- J. Liu and Y. Lu, Nat. Protoc., 2006, 1, 246–252 CrossRef CAS PubMed.
- X. Zhang, M. R. Servos and J. Liu, J. Am. Chem. Soc., 2012, 134, 7266–7269 CrossRef CAS PubMed.
- S. Lukman, L. Sutarlie, N. Li and X. Su, Part. Part. Syst. Charact., 2014, 31, 1281–1290 CrossRef CAS.
- Y. Wang and B. Liu, Chem. Commun., 2007, 3553–3555 RSC.
- J. G. Duguid and V. A. Bloomfield, Biophys. J., 1995, 69, 2642–2648 CrossRef CAS PubMed.
- DNA melting temperature, http://www.biophp.org/minitools/melting_temperature/demo.php, accessed 1 September 2019 Search PubMed.
- J. Phallen, M. Sausen, V. Adleff, A. Leal, C. Hruban, J. White, V. Anagnostou, J. Fiksel, S. Cristiano, E. Papp, S. Speir, T. Reinert, M.-B. Worm Orntoft, B. D. Woodward, D. Murphy, S. Parpart-Li, D. Riley, M. Nesselbush, N. Sengamalay, A. Georgiadis, Q. K. Li, M. R. Madsen, F. V. Mortensen, J. Huiskens, C. Punt, N. v. Grieken, R. Fijneman, G. Meijer, H. Husain, R. B. Scharpf, L. A. Diaz Jr, S. Jones, S. Angiuoli, T. Ørntoft, H. J. Nielsen, C. L. Andersen and V. E. Velculescu, Sci. Transl. Med., 2017, 9, eaan2415 CrossRef PubMed.
Footnotes |
| † Electronic supplementary information (ESI) available. See DOI: 10.1039/c9ra09029k |
| ‡ Present address: Singapore Bioimaging Consortium (SBIC), Agency for Science, Technology and Research (A*STAR), 11 Biopolis Way, Helios, #01-02, Singapore 138667. |
| This journal is © The Royal Society of Chemistry 2020 |

