 Open Access Article
Separation and identification of an impurity from the istradefylline intermediate†
Haojie Xuab,
Yiyun Wangab,
Hongyi Wangab,
Zhonghui Zhengb,
Zihui Meng *a,
Min Xuea and
Zhibin Xua
aSchool of Chemistry and Chemical Engineering, Beijing Institute of Technology, 102488, Beijing, China. E-mail: mengzh@bit.edu.cn
bShandong Xinhua Pharmaceutical Co., Ltd., No.1 Lutai Avenue, 255086, Zibo, Shandong, China
First published on 8th April 2020
Abstract
Istradefylline is a selective adenosine antagonist for the A2a receptor, and it is used to treat the Parkinson's disease and improve dyskinesia in the early stage of the Parkinson's disease. An impurity in the istradefylline intermediate A1 (6-amino-1,3-diethyl-2,4-(1H,3H)-pyrimidinedione) was identified by high performance liquid chromatography (HPLC); it was separated by preparative HPLC and further characterized by UV, IR, MS, NMR, 2D NMR and single-crystal XRD analyses. The impurity was identified as (E)-N-ethyl-2-cyano-3-ethylamino-2-butenamide, which originated from the synthetic process of the intermediate A1. The structure of this impurity might affect the efficiency and safety of istradefylline; therefore, the research and control of this impurity are necessary for ensuring the quality of istradefylline.
1. Introduction
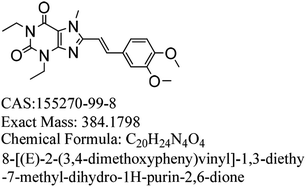
Parkinson's disease is a common progressive neurological disease, where the lesions are mainly located in substantia nigra, striatum and globus pallidus.1,2 Ageing is the most important known risk, and the incidence of Parkinson's disease rises dramatically with age. The incidence rates for people aged 50 to 59 and 70 to 79 are 17.4 and 93.1 per 100 thousand people, respectively.3,4 There are individual differences in the Parkinson's disease and patients with hyperactivity as the main symptom might be diagnosed in the early stage.5 The initial symptoms in sequence are tremors, stiffness or slow movement, gait disorder, myalgia and spasm, mental disorders such as depression and stress, language disorder and myasthenia, and drooling and mask-like face. Currently, the main therapeutic medicines can relieve the clinical symptoms of PD.6–9 However, a single treatment method may not be completely effective, and the entire treatment process should be targeted according to the different stages and severity of the disease.10Istradefylline (KW-6002, (E)-8-(3,4-dimethoxystyryl)-1,3-diethyl-7-methyl-3,7-dihydro-1H-purine-2,6-dione), a selective adenosine A2a receptor antagonist (Fig. 1), was developed by Kyowa Hakko Kirin, Japan.11 It is used to treat Parkinson's disease; it can improve the motor function of PD patients by altering the activity of neurons and can also improve early dyskinesia.12–14 During phase I and phase II clinical trials, adjunct with L-dopa and other anti-Parkinson drugs, istradefylline was used for patients whose symptoms were not well controlled, and it showed good safety and efficiency.15,16
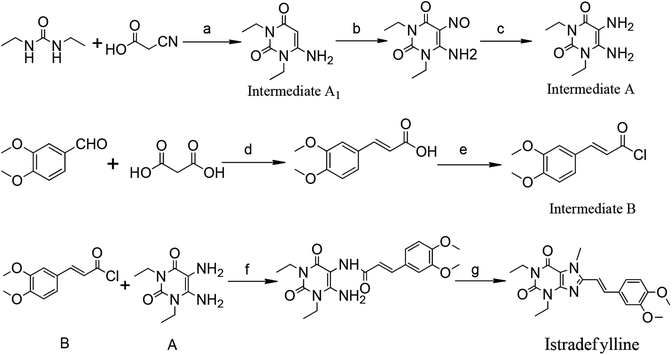
Currently, istradefylline is synthesized by the amidation, cyclization and methylation of intermediates A and B.17 Intermediate A was synthesized from 1,3-diethylurea via cyclization with cyanoacetic acid, nitrosation and reduction. Intermediate B was prepared from veratraldehyde by condensation with malonic acid and acyl chlorination (Fig. 2).
Impurities including organics, inorganics and solvent residuals can be usually found in the final drugs, and they might originate from the starting materials, intermediates, production processes and storage.18 Organics are the most common impurities in pharmaceutical products, especially unreacted intermediates, by-products or degradation products that occur during storage. B. W reported the HPLC analysis of istradefylline by isocratic elution using acetonitrile-phosphate buffer as the mobile phase.19 However, no other studies related to the analysis of istradefylline have been reported.
By-products usually have similar physical and chemical properties to those of drugs due to their similar chemical structures. In order to ensure that the drugs do not have adverse effects, it is extremely important to control the impurities, which might affect the efficiency and safety of the drugs.20
The istradefylline intermediate A1 (Fig. 2) is the active fragment in the intermediate A, and its impurities are directly related to the impurities of istradefylline. The purpose of this study is to separate the impurities of the istradefylline intermediates by prep-HPLC and confirm their structure by UV, IR, NMR, MS and single-crystal X-ray diffraction analyses.
2. Experiment and methods
2.1. Materials
Istradefylline intermediate A1 was obtained from Shandong Xinhua Pharmaceutical Co., Ltd. (Zibo, China). Acetonitrile and purified water were used for sample preparation and mobile phase. HPLC grade acetonitrile was purchased from Merck (Darmstadt, Germany). Water was purified through a Milli-Q water purification system (Millipore, USA).2.2. HPLC analysis of the impurity
HPLC analyses were performed on an LC-20AD system (SHIMADZU, Kyoto, Japan) equipped with an SPD-10 Avp detector. The impurity was prepared by dilution into the mobile phase and then was filtered through a 0.45 μm organic membrane. The impurity was analyzed by HPLC on Agilent ZORBOX equipped with a C18 chromatographic column (150 × 4.6 mm, 5 μm). Mobile phase A (acetonitrile) and mobile phase B (purified water) were used for HPLC. The separation was accomplished by a gradient elution according to the program (Tmin/A![[thin space (1/6-em)]](https://www.rsc.org/images/entities/char_2009.gif) :
:![[thin space (1/6-em)]](https://www.rsc.org/images/entities/char_2009.gif) B): T0/20
B): T0/20![[thin space (1/6-em)]](https://www.rsc.org/images/entities/char_2009.gif) :
:![[thin space (1/6-em)]](https://www.rsc.org/images/entities/char_2009.gif) 80, T15/60
80, T15/60![[thin space (1/6-em)]](https://www.rsc.org/images/entities/char_2009.gif) :
:![[thin space (1/6-em)]](https://www.rsc.org/images/entities/char_2009.gif) 40 and T20/90
40 and T20/90![[thin space (1/6-em)]](https://www.rsc.org/images/entities/char_2009.gif) :
:![[thin space (1/6-em)]](https://www.rsc.org/images/entities/char_2009.gif) 10 to T50 at the flow rate of 1.0 mL min−1. The column temperature was set at 35 °C and the detector wavelength operated at 268 nm (Fig. S1†).
10 to T50 at the flow rate of 1.0 mL min−1. The column temperature was set at 35 °C and the detector wavelength operated at 268 nm (Fig. S1†).
2.3. Separation of impurity
A prep-HPLC method was developed for the separation of the impurity present in the istradefylline intermediate A1. Intermediate A1 (0.4 g), water (8 mL) and acetonitrile (8 mL) were dissolved in an ultrasonic water bath. Preparative performance liquid chromatography was carried out on KNAUER-AZURA (Knauer, Germany). The impurity was separated and purified by prep-HPLC on Ceres B equipped with a preparation column (250 × 30 mm, 7 μm) using acetonitrile/water (30/70, v/v) as the mobile phase at a flow rate of 30 mL min−1 and detected at a UV wavelength of 268 nm.2.4. Characterization and analysis of the impurity
The separated impurity was characterized by UV, IR, MS, NMR, 2D NMR and single-crystal X-ray diffraction. Ultraviolet absorption spectra were recorded on UV-2550 (SHIMADZU, Kyoto, Japan). Infrared absorption spectra were recorded on Vertex-70 FT-IR (Bruker, Germany) over the range of 4000–400 cm−1 by the pressed tablet method using KBr.For NMR analysis, we used deuterated dimethylsulfoxide (DMSO-d6) as the solvent and tetramethylsilane (TMS) as the internal standard. 2D NMR correlation spectra (Correlated Spectroscopy (COSY)), 1H Detected Heteronuclear Single Quantum Coherence (HSQC), 1H Detected Heteronuclear Multiple Bond Correlation (HMBC) and Distortionless Enhancement by Polarization Transfer Spectroscopy (DEPT) were recorded on INOVA-600 (Varian, USA) for the assignment of the related chemical groups.
The high-resolution mass spectrum (HRMS) was detected on 1200RRLC-6520 Accurate-Mass Q-TOF (Agilent, USA) with ESI in positive ion mode.
Single crystals were picked and analysed for X-ray structural analysis on a Bruker apex2 X-ray diffractometer with Mo-Kα radiation (λ = 0.71073 Å) at 296 K. The parameters of crystals are summarized in Table 3. The single crystal X-ray diffraction spectrum is shown in Fig. S11.†
3. Results and discussion
3.1. Separation of the impurity by prep-HPLC
To obtain a sufficient amount of the impurity for characterizations, prep-HPLC was used to obtain the impurity. The HPLC protocol including the elution method, mobile phase and injection volume was optimized and the results are shown in Fig. 3.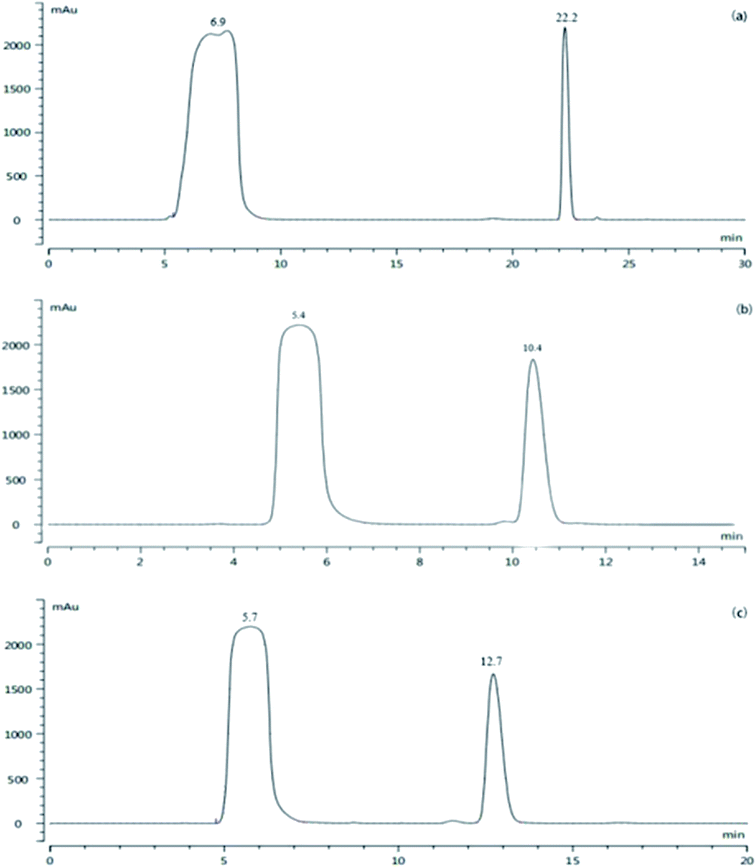 | ||
Fig. 3 HPLC chromatogram of (a) gradient elution, (b) acetonitrile/water (35![[thin space (1/6-em)]](https://www.rsc.org/images/entities/char_2009.gif) : :![[thin space (1/6-em)]](https://www.rsc.org/images/entities/char_2009.gif) 65, v/v), and (c) acetonitrile/water (30 65, v/v), and (c) acetonitrile/water (30![[thin space (1/6-em)]](https://www.rsc.org/images/entities/char_2009.gif) : :![[thin space (1/6-em)]](https://www.rsc.org/images/entities/char_2009.gif) 70, v/v). 70, v/v). | ||
According to Fig. 3, good separation can be achieved by gradient elution, and the peak of the intermediate A1 is far away from the impurity peak (α = 4.1); however, the column balance required a long time with a large solvent demand in the preparative mode. Therefore, isocratic elution was applied. When acetonitrile/water (35![[thin space (1/6-em)]](https://www.rsc.org/images/entities/char_2009.gif) :
:![[thin space (1/6-em)]](https://www.rsc.org/images/entities/char_2009.gif) 65, v/v) was applied (α = 2.47), there was a small impurity peak in the front of the target impurity peak, which might be included by the impurity peak when a large amount of the sample was injected. Consequently, acetonitrile/water (30/70, v/v) was further investigated; the impurity and intermediate A1 could be separated well (α = 2.89), and the small impurity peak before the target impurity could also be separated well. Then, a larger injection volume (4 mL) was tested further, and the small impurity peak before that of the intermediate A1 could still be completely separated. Thus, the prep-HPLC conditions were set as follows: acetonitrile/water (30
65, v/v) was applied (α = 2.47), there was a small impurity peak in the front of the target impurity peak, which might be included by the impurity peak when a large amount of the sample was injected. Consequently, acetonitrile/water (30/70, v/v) was further investigated; the impurity and intermediate A1 could be separated well (α = 2.89), and the small impurity peak before the target impurity could also be separated well. Then, a larger injection volume (4 mL) was tested further, and the small impurity peak before that of the intermediate A1 could still be completely separated. Thus, the prep-HPLC conditions were set as follows: acetonitrile/water (30![[thin space (1/6-em)]](https://www.rsc.org/images/entities/char_2009.gif) :
:![[thin space (1/6-em)]](https://www.rsc.org/images/entities/char_2009.gif) 70, v/v), isocratic elution, and 4 mL injection volume. Under these conditions, the separation was satisfactory, and economical solvent demand and short run time were achieved. The final pale yellow impurity product was extracted with dichloromethane and concentrated to dryness under a reduced pressure.
70, v/v), isocratic elution, and 4 mL injection volume. Under these conditions, the separation was satisfactory, and economical solvent demand and short run time were achieved. The final pale yellow impurity product was extracted with dichloromethane and concentrated to dryness under a reduced pressure.
3.2. Characterization of the obtained impurity
The impurity obtained from prep-HPLC was characterized by UV, IR, MS, NMR, 2D NMR and proton correlation spectroscopy. The UV absorption spectra of the obtained impurity in H2O, HCl (0.1 mol L−1), NaOH (0.1 mol L−1) and methanol solutions are shown in Fig. S2.† There is an absorption peak at 285 nm, which is the K-band transition peak of the carbonyl group. The K band is characteristic of a π–π* transition, and it can be deduced that the impurity contains the structure of a conjugated group.The IR spectrum of the impurity is shown in Fig. S3† and the absorption bands at 3361 cm−1, 2963 cm−1, 2929 cm−1, 2187 cm−1, 1699 cm−1, 1624 cm−1, 1453 cm−1 and 1376 cm−1 correspond to the functional groups, namely, NH, CH3, CH2, CO, CONH and CN. It can be deduced that the impurity has similar functional groups to that of intermediate A1.
The 1H NMR, 13C NMR and DEPT data of the impurity are shown in Table 1 and the proton correlation data are shown in Table 2. In the 1H NMR spectrum of the impurity (Fig. S4†), there are seven groups of hydrogen with the integral ratio of 1![[thin space (1/6-em)]](https://www.rsc.org/images/entities/char_2009.gif) :
:![[thin space (1/6-em)]](https://www.rsc.org/images/entities/char_2009.gif) 1
1![[thin space (1/6-em)]](https://www.rsc.org/images/entities/char_2009.gif) :
:![[thin space (1/6-em)]](https://www.rsc.org/images/entities/char_2009.gif) 2
2![[thin space (1/6-em)]](https://www.rsc.org/images/entities/char_2009.gif) :
:![[thin space (1/6-em)]](https://www.rsc.org/images/entities/char_2009.gif) 2
2![[thin space (1/6-em)]](https://www.rsc.org/images/entities/char_2009.gif) :
:![[thin space (1/6-em)]](https://www.rsc.org/images/entities/char_2009.gif) 3
3![[thin space (1/6-em)]](https://www.rsc.org/images/entities/char_2009.gif) :
:![[thin space (1/6-em)]](https://www.rsc.org/images/entities/char_2009.gif) 3
3![[thin space (1/6-em)]](https://www.rsc.org/images/entities/char_2009.gif) :
:![[thin space (1/6-em)]](https://www.rsc.org/images/entities/char_2009.gif) 3 from low field to high field. It can be deduced that the impurity contains three methyl groups, two methylene groups and two hydrogens. In addition to the two methylene groups and two methyl groups, the impurity has one more methyl group than the intermediate A1. In the 13C NMR spectrum of the impurity (Fig. S5†), the molecular backbone of the impurity has nine carbons, which is inconsistent with that of A1, which has eight carbons. According to the chemical shift and DEPT data, the impurity contains three primary carbons, two secondary carbons and four quaternary carbons. It can be deduced that the structure might contain two methylene groups, three methyl groups, one secondary amine, a cyano-bonded ketone and a carbon–carbon double bond.
3 from low field to high field. It can be deduced that the impurity contains three methyl groups, two methylene groups and two hydrogens. In addition to the two methylene groups and two methyl groups, the impurity has one more methyl group than the intermediate A1. In the 13C NMR spectrum of the impurity (Fig. S5†), the molecular backbone of the impurity has nine carbons, which is inconsistent with that of A1, which has eight carbons. According to the chemical shift and DEPT data, the impurity contains three primary carbons, two secondary carbons and four quaternary carbons. It can be deduced that the structure might contain two methylene groups, three methyl groups, one secondary amine, a cyano-bonded ketone and a carbon–carbon double bond.
| Position | Impurity chemical shifts (ppm) | DEPT | |||
|---|---|---|---|---|---|
| 13C | 1H | No. of H | Multiplicity | ||
| a Highlighted: a position part in the molecule, a-negative peaks in DEPT, b-positive peaks in DEPT, * four quaternary carbons. | |||||
| 1 | 167.68 | — | — | — | * |
| 2 | 70.13 | — | — | — | * |
| 3 | 167.78 | — | — | — | * |
| 4 | 17.34 | 2.17 | 3H | — | b |
| 5 | 120.81 | — | — | * | |
| 6 | 37.97 | 3.32 | 2H | Overlap | a |
| 7 | 14.90 | 1.14 | 3H | J = 7.2 Hz | b |
| 8 | 33.49 | 3.10 | 2H | J = 7.1, 5.8 Hz | a |
| 9 | 15.18 | 1.00 | 3H | J = 7.1 Hz | b |
| Parameter | Content |
|---|---|
| Empirical formula | C9H15N3O |
| Formula weight | 181.24 |
| Temperature/K | 150 |
| Crystal system | Monoclinic |
| Space group | P21/c |
| a/Å | 8.28(4) |
| b/Å | 12.60(6) |
| c/Å | 9.92(5) |
| α/° | 90 |
| β/° | 105.94(10) |
| γ/° | 90 |
| Volume/Å3 | 995.63(8) |
| Z | 4 |
| ρcalc g cm−3 | 1.21 |
| Reflections collected | 11![[thin space (1/6-em)]](https://www.rsc.org/images/entities/char_2009.gif) 037 037 |
| Goodness-of-fit on F2 | 1.06 |
| R indexes | R1 = 0.0883, wR2 = 0.1261 |
The MS spectrum of the impurity shows a protonated molecule [M + H]+ at m/z 182.1 in Fig. S6,† which is significantly different from that for the intermediate A1 (m/z 183.1008).
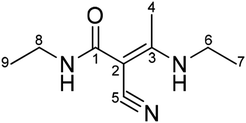
Therefore, it can be deduced according to the above-mentioned characterization that the impurity is a by-product of intermediate A1 and is identified as (E)-N-ethyl-2-cyano-3-ethylamino-2-butenamide, as shown in Fig. 4.
In order to further confirm the deduced structure of the impurity, the DEPT spectrum (Fig. S7†), 1H–1H correlation spectrum (COSY) (Fig. S8†), 13C–1H correlation spectrum (HMQC) (Fig. S9†) and remote 13C–1H correlation spectrum (HMBC) (Fig. S10†) were obtained to characterize hydrogen and carbon. The structure was confirmed again as (E)-N-ethyl-2-cyano-3-ethylamino-2-butenamide.
According to the COSY spectrum, combined with the HSQC and DEPT spectra, H (δ1.00) is a set of three peaks with three protons related to H-8 (δ3.10) and correlated to C-9 (δ15.18), which is confirmed to be H-9. H (δ1.14) is a set of three peaks with three protons related to H-6 (δ3.32) and correlated to C-7 (δ14.90), which is confirmed to be H-7. H (δ2.17) is a set of single peaks with three protons correlated to C-4 (δ17.34) and remotely related to C-1(167.68), C-2(70.13), C-3(167.78) and C-5(120.81), which is confirmed to be H-4. H (δ3.10) is related to H-9 (δ1.00) and correlated to C-8 (δ33.49), which is confirmed to be H-8. H (δ3.32) is related to H-7 (δ1.14) and correlated to C-6 (δ37.97), which is confirmed to be H-6.
The DEPT spectrum shows the presence of three sets of primary carbon peaks. The primary carbon peak (δ14.90) is related to H-7 (δ1.14) and remotely related to H-6 (δ3.32), which is confirmed to be methyl C-7. The primary carbon peak (δ15.18) is related to H-9 (δ1.00) and remotely related to H-8 (δ3.10), which is confirmed to be methyl C-9. The primary carbon peak (δ17.34) is related to H-4 (δ2.17) and not remotely related to the HSQC spectrum, which is assigned to C-4. Two sets of secondary carbon peaks can be observed in the DEPT spectrum. The secondary carbon peak (δ37.97) is related to H-6 (δ3.32) and is remotely related to H-4 (δ2.17), which is confirmed to be methylene C-6. The secondary carbon peak (δ33.49) is related to H-8 (δ3.10) and remotely related to H-9 (δ1.00), which is confirmed to be methylene C-8. Four sets of quaternary carbons peaks can be confirmed from the DEPT spectrum. The quaternary carbon peak (δ167.68) is related to H-8 (δ3.10) and H-4 (δ2.17) in the HMBC spectrum, which is assigned to quaternary C-1. The HMBC spectrum shows that C (δ70.13) is remotely related to H-4 (δ2.17), which is confirmed to be quaternary C-2. C (δ167.78) is remotely related to H-4 (δ2.17) and H-6 (δ3.32), which is confirmed to be quaternary C-3. C (δ120.81) is remotely related to H-4 (δ2.17), which is confirmed to be quaternary C-5 (Table 2).
3.3. Formation mechanism of the impurity
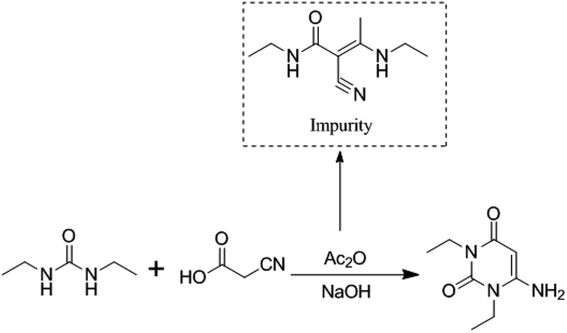
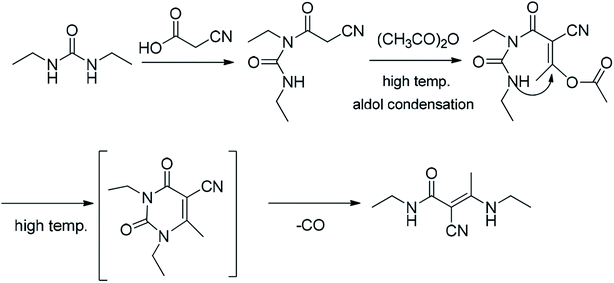
Although the formation mechanism of an imidazole diketone from the condensation of cyanoacetic acid with diethyl urea has not been reported, Baccolini reported that the condensation reaction of 2-carbonyl propionaldehyde and 2,3-diol propionaldehyde with urea can be carried out to obtain 5-methylimidazolidine-2,4-dione.21 Based on the structure of 5-methylimidazolidine-2,4-dione, we deduce that the formation mechanism of (E)-N-ethyl-2-cyano-3-ethylamino-2-butenamide might be as follows (Fig. 5): when condensation reaction is carried out, cyanoacetic acid reacts with diethyl urea and acetic anhydride to obtain intermediate A1. Simultaneously, the intermediate A1 will undergo a decarboxylation reaction at a high temperature to generate (E)-N-ethyl-2-cyano-3-ethylamino-2-butenamide.(E)-N-Ethyl-2-cyano-3-ethylamino-2-butenamide as a byproduct of intermediate A1 reacts in the subsequent synthetic process. It might eventually affect the safety and efficiency of istradefylline, but its pharmacology and toxicity are unknown yet. The presence of the impurity in the intermediate A1 poses a significant risk to the safety and efficiency of istradefylline. The strict control of the reaction temperature and the reduction in acidity during the synthetic process, especially during the distillation of acetic acid, may reduce the formation of this byproduct. Through research using analytical methods, we can reduce the quality risk of the drug by using HPLC to detect and control this impurity.
4. Conclusions
In this study, an impurity from the istradefylline intermediate A1 was separated by prep-HPLC. Its structure was identified as (E)-N-ethyl-2-cyano-3-ethylamino-2-butenamide by means of UV, IR, MS, NMR, 2D NMR and single-crystal X-ray diffraction analyses. The impurity is actually a by-product of the intermediate A1, and it is formed due to the high temperature and acidic conditions employed during the synthesis of intermediate A1. The structure of this impurity has a potential impact on the safety and efficiency of istradefylline. In order to ensure the quality of istradefylline, HPLC is needed to detect and control the content of this impurity.Conflicts of interest
The authors declare that there are no conflicts of interest.Acknowledgements
The authors wish to thank the Shandong Analytical Testing Center for their 2D NMR services, Prof. Li Qingshan from Nankai University and Prof. Guo Yong from the Lanzhou institute of Chemical & Physics for their contribution in identifying the structure of the impurity.References
- W. Chen, H. Wang, H. Wei, S. Gu and H. Wei, J. Neurol. Sci., 2013, 324, 21–28 CrossRef CAS PubMed.
- J. Lu, J. Cui, X. Li, X. Wang, Y. Zhou, W. Yang, M. Chen, J. Zhao and G. Pei, PLoS One, 2016, 11, e0166415 CrossRef PubMed.
- H. Nagayama, O. Kano, H. Murakami, K. Ono, M. Hamada, T. Toda, R. Sengoku, Y. Shimo and N. Hattori, J. Neurol. Sci., 2019, 396, 78–83 CrossRef CAS PubMed.
- A. Dalpiaz, B. Cacciari, C. B. Vicentini, F. Bortolotti, G. Spalluto, S. Federico, B. Pavan, F. Vincenzi, P. A. Borea and K. Varani, Mol. Pharm., 2012, 9, 591–604 CrossRef CAS PubMed.
- H. H. Fernandez, D. R. Greeley, R. M. Zweig, J. Wojcieszek, A. Mori, N. M. Sussman and U. S. S. Group, Park. Relat. Disord., 2010, 16, 16–20 CrossRef CAS PubMed.
- R. A. Hauser, L. M. Shulman, J. M. Trugman, J. W. Roberts, A. Mori, R. Ballerini, N. M. Sussman and U. S. S. G. Istradefylline, Mov. Disord., 2008, 23, 2177–2185 CrossRef PubMed.
- K. Ishibashi, Y. Miura, K. Wagatsuma, J. Toyohara, K. Ishiwata and K. Ishii, Neuropharmacology, 2018, 143, 106–112 CrossRef CAS PubMed.
- S. Uchida, K. Soshiroda, E. Okita, M. Kawai-Uchida, A. Mori, P. Jenner and T. Kanda, Eur. J. Pharmacol., 2015, 747, 160–165 CrossRef CAS PubMed.
- K. Yamada, M. Kobayashi, A. Mori, P. Jenner and T. Kanda, Pharmacol., Biochem. Behav., 2013, 114–115, 23–30 CrossRef CAS PubMed.
- H. Kataoka and K. Sugie, J. Neurol. Sci., 2018, 388, 233–234 CrossRef CAS PubMed.
- Y. Mizuno, T. Kondo and G. Japanese Istradefylline Study, Mov. Disord., 2013, 28, 1138–1141 CrossRef CAS PubMed.
- W. K. D. Ko, S. M. Camus, Q. Li, J. Yang, S. McGuire, E. Y. Pioli and E. Bezard, Neuropharmacology, 2016, 110, 48–58 CrossRef CAS PubMed.
- P. A. LeWitt, M. Guttman, J. W. Tetrud, P. J. Tuite, A. Mori, P. Chaikin, N. M. Sussman and U. S. S. Group, Ann. Neurol., 2008, 63, 295–302 CrossRef CAS PubMed.
- K. Matsuura, H. Kajikawa, K.-i. Tabei, M. Satoh, H. Kida, N. Nakamura and H. Tomimoto, Neurosci. Lett., 2018, 662, 158–161 CrossRef CAS PubMed.
- S. Uchida, K. Soshiroda, E. Okita, M. Kawai-Uchida, A. Mori, P. Jenner and T. Kanda, Eur. J. Pharmacol., 2015, 766, 25–30 CrossRef CAS PubMed.
- S. Uchida, T. Tashiro, M. Kawai-Uchida, A. Mori, P. Jenner and T. Kanda, J. Pharmacol. Sci., 2014, 124, 480–485 CrossRef CAS PubMed.
- L. Fan and H. Xingpu, Chin. J. Pharm., 2010, 41, 241–243 Search PubMed.
- N. Kumar, S. R. Devineni, P. R. Gajjala, S. K. Dubey and P. Kumar, J. Pharm. Anal., 2017, 7, 394–400 CrossRef PubMed.
- B. Wu and H. Cui, CN Pat., 105891377A, 2016.
- Q. Xu, A. Khan, D. Gao, K. M. Adams, F. Tadjimukhamedov, S. Tan and J. T. Simpson, J. Pharm. Anal., 2018, 8, 96–102 CrossRef PubMed.
- G. Baccolini and C. Boga, Tetrahedron Lett., 2011, 52, 1713–1717 CrossRef CAS.
Footnote |
| † Electronic supplementary information (ESI) available. See DOI: 10.1039/c9ra09074f |
| This journal is © The Royal Society of Chemistry 2020 |

