 Open Access Article
Nickel-doped cerium oxide nanoparticles: biosynthesis, cytotoxicity and UV protection studies
Abdolhossein Miria,
Mina Sarani *b and
Mehrdad Khatami
 cd
cd
aDepartment of Pharmacognosy, Faculty of Pharmacy, Zabol University of Medical Sciences, Zabol, Iran
bNanoBioEletrochemistry Research Center, Bam University of Medical Sciences, Bam, Iran
cNanomedicine and Nanobiology Research Center, Shiraz University of Medical Sciences, Shiraz, Iran
dStudent Research Committee, School of Medicine, Bam University of Medical Sciences, Bam, Iran. E-mail: minasarani64@gmail.com; m.sarani@zbmu.ac.ir; Fax: +9834-4219074; Tel: +9834-4219074
First published on 23rd January 2020
Abstract
This study was conducted to obtain NixCe1−xO2 (where x = 0, 1, 3 and 5% w/w) nanoparticles using Salvadora persica extracts through an easy, inexpensive and non-toxic method. The biosynthesized nanoparticles have been characterized via powder X-ray diffraction (PXRD), Raman spectroscopy, field emission scanning electron microscopy (FESEM), energy dispersive X-ray (EDX) spectroscopy, and vibrating-sample magnetometer (VSM) analysis. The results of PXRD showed that Ni doping in the CeO2 process generated a higher shift at an angle of (111); also, the PXRD patterns were surveyed by the Rietveld refinement technique. Raman analysis revealed that doping nickel in CeO2 led to the nanoparticles reducing the intensity of the F2g mode. The FESEM images showed that the particle size was 5–6 nm and it had a spherical shape. The hysteresis loops of the synthesized nanoparticles were similar to that of the normal ferromagnetic materials. The cytotoxic activity of the synthesized undoped and Ni-doped CeO2-NPs was determined using MTT assays against a colon cancer cell line (HT-29). The results showed that the cytotoxic effect of the synthesized nanoparticles changed after doping nickel in CeO2-NPs. The increase in the Ni-doping value for CeO2-NPs increased the cytotoxic activity. The sun protection factor (SPF) has been estimated through spectrophotometric measurements for determining UV protection. This showed that increasing the percentage of nickel in the doped nanoparticles increased the protection factor and a higher SPF value was obtained: 48.52.
Introduction
Developments in nanomaterial sciences have shown that every nanoparticle has its own unique properties and usage, which makes them able to enter an industrial or non-industrial area. So, these developments improves or enhance the quality of lots of nano-products as well as, it causes economics savings.1–7Cerium oxide nanoparticles (CeO2-NPs) have a cubic fluorite structure with each cerium atom surrounded by 8 atoms of oxygen and each oxygen atom surrounded by 4 cerium atoms. When an element with a lower oxidation number than that of a cerium atom enters CeO2-NPs, oxygen is removed, resulting in oxygen defects in the crystalline structure. These changes improve the stability of the crystallite structure of cerium oxide. Therefore, doping in the nanostructures of cerium oxide increases thermal and chemical stability and leads to strong UV absorption of the crystal.8,9 There are many reports on the doping of different metals into CeO2 such as Co, Pb, Cd, Fe, Ni, and Zn. This has improved the properties and applications of new nanostructures.10–12
CeO2-NPs are usually synthesized through physical and chemical methods such as precipitation,13 sol–gel,14,15 microemulsion,16 and thermal decomposition.17 The biosynthesis of nanoparticles using natural resources is a modern method with a lower expense and reduced pollution compared to previous methods.18–28 Salvadora Persica (Salvadoraceae) is a tree with 6–7 m height, and its bark is cracked and wrinkled. It is an indigenous tree of the Middle East, Asia and Africa that commonly grows on the path of flooding and river bank. S. persica contains terpenoids, steroids, alkaloids, and tannins.29,30 Previous studies showed that the extract of this plant is able to regenerate and stabilize nanoparticles.19
Cancer is one of the leading causes of death globally. Nanoscience and nanotechnology advancements can offer innovative research avenues and new tools to deepen our understanding about cancer initiation and the evolution of the disease. Additionally, nanomaterials have shown great promise for the development of better cancer treatment strategies.31–33 Studies have shown that cerium oxide nanoparticles can act as potential free radical scavengers in the treatment of cancer.34
Among nanomaterials, cerium oxide nanostructures have been used in solar cells, catalysts, sunscreens, sensors, and UV blocks due to their rapid changes in oxidation states, mobility of oxygen ions, and large band-gaps.35 UV radiation is one of the most important causes of skin damage and skin cancer. Therefore, skin protection from UV radiation has been an important research issue for many years.36 Nanoscientists have devoted many efforts to improve the quality and performance of nano-based sunscreens. These efforts led to the use of many nanoparticles such as titanium dioxide and zinc oxide in sunscreens and these products have shown high performance in skin protection. Previous studies have shown that CeO2-NPs have better UV absorption ability than zinc oxide nanoparticles.37
This study aimed to improve the properties of CeO2-NPs through doping with transition metals and the development of nanoparticle synthesis using a fast, cheap and non-toxic route. Therefore, in this study, we tried to synthesize undoped and nickel-doped CeO2-NPs using an aquatic extract of S. persica and survey their sun protection factor (SPF) through the spectrophotometric method and the cytotoxic properties on an HT-29 cell line.
Experimental
Extraction of S. persica
Salvadora persica bark was collected from Khash, Sistan and Baluchestan, Iran. The collected samples were dried and crushed. Then, they were extracted through the maceration method using distilled water as a solution. For this purpose, the plant bark was soaked in distilled water (1![[thin space (1/6-em)]](https://www.rsc.org/images/entities/char_2009.gif) :
:![[thin space (1/6-em)]](https://www.rsc.org/images/entities/char_2009.gif) 10 ratio), and the mixture was shaken at 150 rpm for 4 h. Then, it was filtered using Whatman paper No. 1 and the filtrate was kept for the next steps at 4–7 °C.
10 ratio), and the mixture was shaken at 150 rpm for 4 h. Then, it was filtered using Whatman paper No. 1 and the filtrate was kept for the next steps at 4–7 °C.
Synthesis of undoped and Ni-doped CeO2-NPs
An aqueous extract of S. persica (10 mL) was diluted with 50 mL of distilled water. Then, a Ce(NO3)3·6H2O solution (0.1 M, 50 mL) was added to the mixture. In order to dope Ni into CeO2, Ni(NO3)2 was separately added at 0, 1, 3 and 5% w/w. The solutions were placed in a water bath of 70 °C for 3 h. Then, the solvent was dried at 80 °C and the resulting products were calcined in a furnace at 400 °C for 2 h.Evaluation of the cytotoxicity of undoped and Ni-doped CeO2-NPs
The colon cancer cell line (HT-29) was prepared using a cell bank from Pasteur Institute, Iran. After the vials containing the HT-29 cells were defrosted, the cells were incubated in a culture medium of DMEM supplemented with FBS, streptomycin and penicillin at 37 °C, 5% CO2 atmosphere and 90% moisture. Then, the cells were counted by Neubauer lam and 5000 cells per well were placed in a 96-well plate. To each well, 200 μg mL−1 DMEM media was added and the cells were incubated for 24 h. Then, the cells were treated and incubated using synthesized non-doped and doped nanoparticles (0–400 μg mL−1, separately) for 24 h. In the next step, MTT (5 mg mL−1 of MTT in PBS buffer) was added to each well and again, the plate was incubated for 2 h. In the end, purple formazan was dissolved in DMSO. The optical absorbance of the wells was measured at 490 nm. The cell viability of the synthesized nanoparticles was presented as a percentage relative to untreated control cells.Determination of sun protection factor (SPF)
The synthesized sample (1 g) was dissolved in ethanol using a 100 mL volumetric flask. The mixture was ultrasonicated for 15 min. Then, 5 mL of the prepared solution was dissolved in ethanol using a 50 mL volumetric flask. Finally, 5 mL of the solution was diluted in a 25 mL volumetric flask. The absorption values were measured using spectrophotometry from 290 to 320 nm.38Characterization
The X-ray diffraction spectra of the nanoparticles were recorded with a DAD4 Advance-Bruker X-ray diffractometer (Netherlands). The nanoparticles were imaged with a TESCAN MIRA3 scanning electron microscope (SEM). Raman spectra were taken with a Takram P50C0R10 Raman spectrometer at a 532 nm laser wavelength. Bruker Tensor 27 was used to acquire the FT-IR spectrum. The absorbance of the synthesized nanoparticles was measured using UV-vis spectroscopy on a UV-1800 spectrophotometer (Shimadzu, Japan).Results and discussion
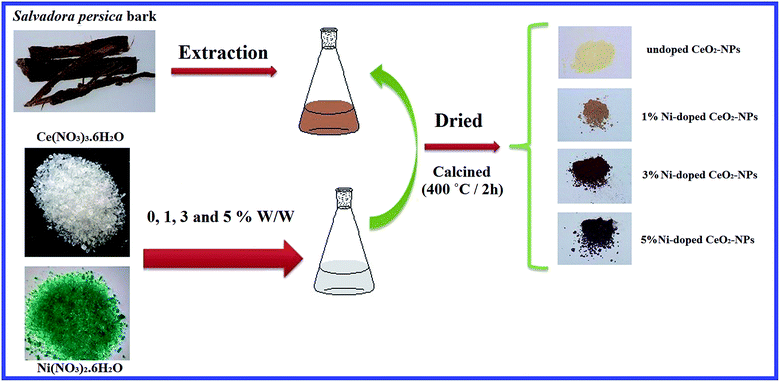
In the present study, we attempted to synthesize undoped and nickel-doped CeO2-NPs using an aquatic extract of S. persica. S. persica, as a stabilizing and capping agent, contains compounds such as terpenoids, alkaloids and tannins. Therefore, the S. persica extracts were used to create an initial molecular matrix by coating and stabilizing the cerium species, which resulted in the formation of the nanoparticles (Fig. 1).Fig. 2A shows the diffraction pattern of the synthesized NixCe1−xO2 NPs. According to the JCPDS file no. 43-1002, all recognizable Bragg peaks with Miller indices for (111), (200), (220), (311), (400) and (331) for synthesizing the nanoparticles show that the synthesized nanoparticles crystallize into a fluorite cubic structure with the Fm![[3 with combining macron]](https://www.rsc.org/images/entities/char_0033_0304.gif) m space group.15 When Ni was doped in the CeO2 matrix, a slight shift at a higher angle from (111) was observed (Fig. 2B).38 This shift maybe due to the network contraction by the doped ions or the replacement of Ce by Ni ions. The crystallite size of the synthesized nanoparticles of undoped cerium oxide was 5.66 nm based on the Scherrer equation (D = 0.89λ/β
m space group.15 When Ni was doped in the CeO2 matrix, a slight shift at a higher angle from (111) was observed (Fig. 2B).38 This shift maybe due to the network contraction by the doped ions or the replacement of Ce by Ni ions. The crystallite size of the synthesized nanoparticles of undoped cerium oxide was 5.66 nm based on the Scherrer equation (D = 0.89λ/β![[thin space (1/6-em)]](https://www.rsc.org/images/entities/char_2009.gif) cos
cos![[thin space (1/6-em)]](https://www.rsc.org/images/entities/char_2009.gif) θ, where D: crystal size of the particles, λ: X-ray wavelength used in the test, β: full-width-at-half-maximum in radians and θ: angle of diffraction).9 The crystallite sizes of the doped CeO2-NPs with 1, 3 and 5% Ni were measured as 5.44, 5.20 and 5.00 nm, respectively. This showed that by increasing the Ni concentration, the crystallite size decreased because of the decrease in the lattice parameters.38
θ, where D: crystal size of the particles, λ: X-ray wavelength used in the test, β: full-width-at-half-maximum in radians and θ: angle of diffraction).9 The crystallite sizes of the doped CeO2-NPs with 1, 3 and 5% Ni were measured as 5.44, 5.20 and 5.00 nm, respectively. This showed that by increasing the Ni concentration, the crystallite size decreased because of the decrease in the lattice parameters.38
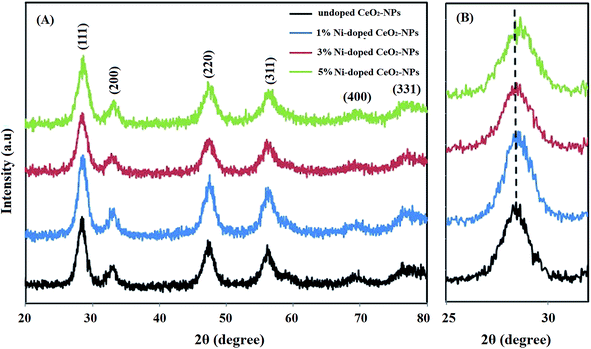 | ||
| Fig. 2 (A) PXRD spectra of the synthesized undoped and Ni-doped CeO2-NPs using the S. persica extract; (B) the shift in the (111) peak due to doped Ni. | ||
With RIETAN-FP, the crystallite sizes and micro-strains were estimated in the same manner as the general structure analysis system (GSAS).39 In other words, the profile parameters in the pseudo-Voigt function of Thompson, Cox and Hastings40 were refined by the Rietveld method using the powder diffraction data of an instrumental standard and an analysis sample to determine the crystallite sizes and micro-strains.
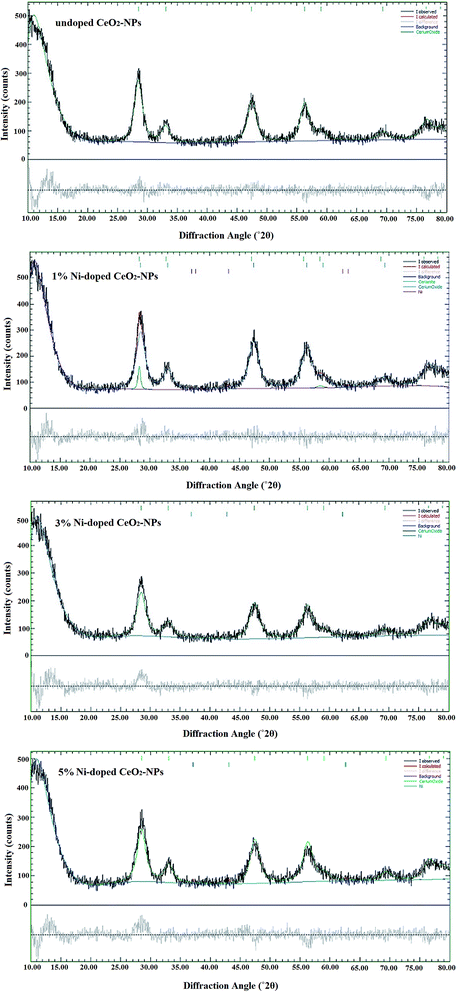
The values for the lattice parameters and goodness of fit (χ2) of the synthesized undoped and Ni-doped CeO2-NPs are presented in Table 1. Fig. 3 shows the Rietveld fits between the experimental and calculated XRD patterns of the synthesized undoped and Ni-doped CeO2-NPs. According to the χ2 values, an acceptable fit was observed between the experimentally calculated and Rietveld calculated XRD patterns. As shown in Table 1, the Rietveld refined lattice constant decreases from a = 5.431(4) to 5.409(5) Å on increasing the concentration of nickel ions. The reduction in the lattice constant can be due to the replacement of nickel ions in the CeO2 lattice.
| Parameters | Undoped CeO2-NPs | 1% Ni-CeO2-NPs | 3% Ni-CeO2-NPs | 5% Ni-CeO2-NPs |
|---|---|---|---|---|
| a = b = c (Å) | 5.431(4) | 5.428(5) | 5.417(7) | 5.409(5) |
| V (Å3) | 160.19 | 159.90 | 158.94 | 158.29 |
| χ2 | 1.32 | 1.23 | 1.39 | 1.46 |
The information on the microstrains and crystallite size (H–W) of the synthesized undoped and Ni-doped CeO2-NPs was obtained from βhkl and the planar spacing dhkl (the distance between the adjacent planes in the set (hkl)) using the Halder–Wagner (H–W) method, which its given as an approximation to the integral breadth of a Voigt function as follows:41
| βhkl2 = βLβhkl + βG2 | (1) |
 | (2) |
 and
and  .42
.42
The results of the crystallite sizes and microstrains of the synthesized undoped and Ni-doped CeO2-NPs estimated by the Scherrer, Rietveld and H–W methods are summarized in Table 2. It shows that with the increase in Ni doping into the CeO2 lattice, the crystallite size decreases. The crystallite size obtained using the Rietveld method was less than that obtained using the H–W method because the peak widening correction was taken into account in all instrumental factors in the Rietveld method.43 Also, the crystallite size obtained by the H–W method was less than that obtained by the Scherrer method, which was due to the strain correction factor that was considered in the H–W method.43
| Crystallite size (nm) | Strain ×103 (no unit) | |||||
|---|---|---|---|---|---|---|
| Scherrer's method | Rietveld method | (H–W) method | Scherrer's method | Rietveld method | (H–W) method | |
| Undoped CeO2-NPs | 5.66 | 5.42 | 4.62 | — | 0.86 | 0.64 |
| 1% Ni-CeO2-NPs | 5.44 | 4.98 | 4.10 | — | 0.63 | 0.58 |
| 3% Ni-CeO2-NPs | 5.20 | 4.71 | 3.98 | — | 0.59 | 0.53 |
| 5% Ni-CeO2-NPs | 5.00 | 4.32 | 3.56 | — | 0.51 | 0.48 |
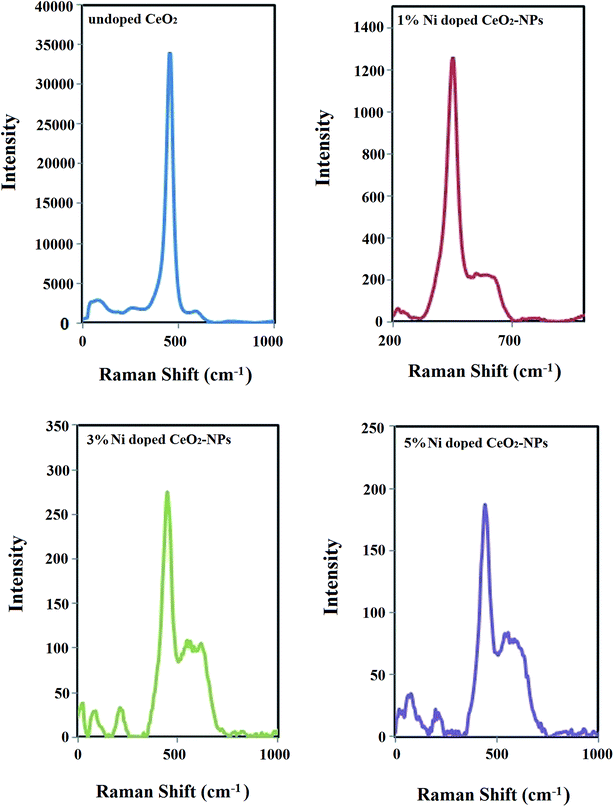
Raman spectroscopy is another useful tool for obtaining additional structural information about oxide nanoparticles to show their crystallite network disruptions. The only Raman active mode for CeO2-NPs is the F2g mode with a fluoride structure, which appears at 463.08 cm−1.44 This vibrational mode is a symmetric vibration of 8 oxygen atoms around any ceria cation. If a metal ion with the same size as that of Ce4+ and a different charge is replaced with Ce4+ in the crystal structure, its weakness would cause an active band of F2g of cerium oxide and small additional peaks would also appear due to the oxygen vibration around the added atom.45 Fig. 4 demonstrates that the Raman spectrum of the undoped CeO2-NPs shows just the F2g mode at 453 cm−1 without any additional peaks. However, by increasing the nickel doping in CeO2-NPs, the intensity of the F2g mode was reduced, the peak shifted to 453, 447 and 441 cm−1, and the crystallite size decreased to create oxygen vacancies in the CeO2 lattice after Ni entered the lattice. The small peaks alongside the main peak were related to the presence of NiO.46
The FESEM images displayed in Fig. 5 show the morphologies of CeO2-NPs (doped and non-doped). The FESEM images clearly show spherical particles for all the synthesized samples. The images show that by increasing the percentage of Ni in the crystal, the particle size decreases. Also, the distribution of the particle size of the synthesized nanoparticles is shown in Fig. 5.
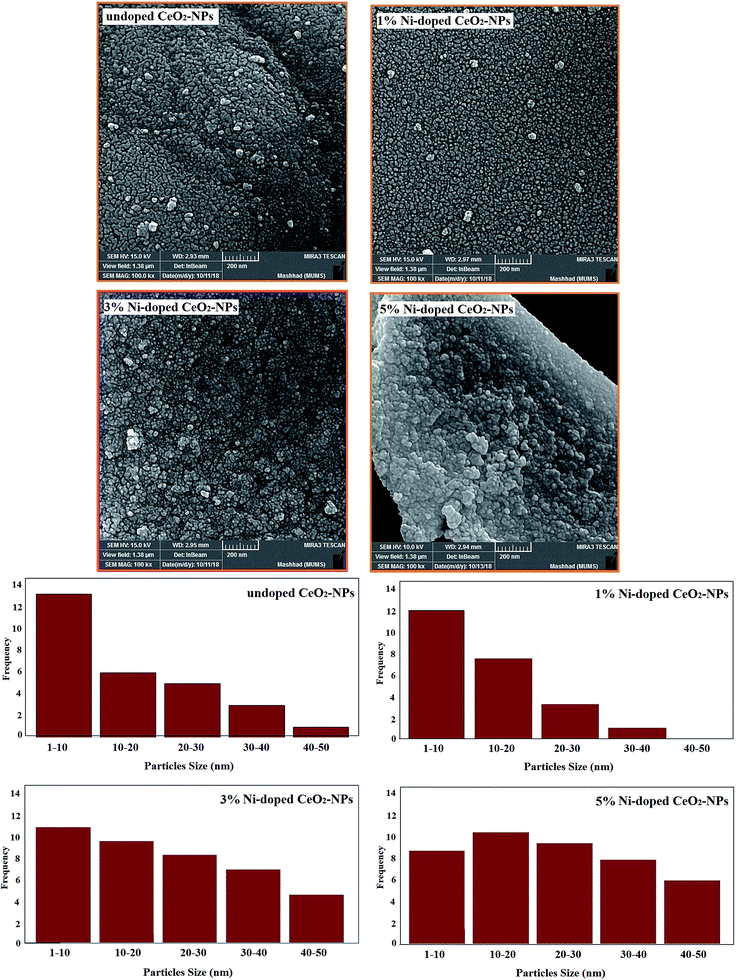 | ||
| Fig. 5 FESEM images and histogram of the synthesized undoped and Ni-doped CeO2-NPs using the S. persica extract. | ||
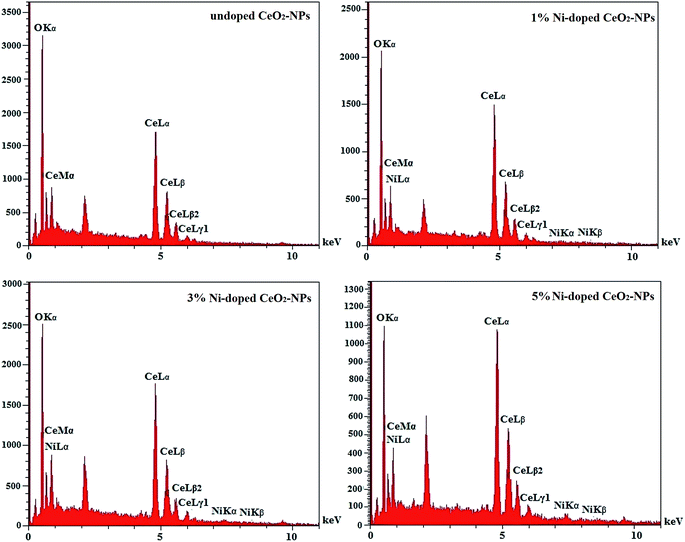
EDX analysis showed that the undoped CeO2-NPs were pure and there were only cerium and oxygen ions in the nanoparticle structure. Also, by doping nickel in CeO2-NPs, nickel ions (Ni2+) occupied some positions of the cerium ions (Ce4+), which was greatly illustrated by the EDX analysis (Fig. 6).
Fig. 7 shows the hysteresis curves of the undoped CeO2-NPs and 1, 3 and 5% Ni-doped CeO2-NPs. The synthesized non-doped nanoparticles demonstrated low coercivity and magnetic residues, which illustrated the weak ferromagnetic behavior for the synthesized nanoparticles. The saturated magnetization (Ms) values (saturated magnetization) increased on increasing the Ni-doped weight percentage in CeO2-NPs. The hysteresis loops of the synthesized nanoparticles were similar to that for the normal ferromagnetic materials. The origin of ferromagnetism in CeO2-NPs was because of the oxygen holes arising due to the conversion of some Ce3+ ions to Ce4+.
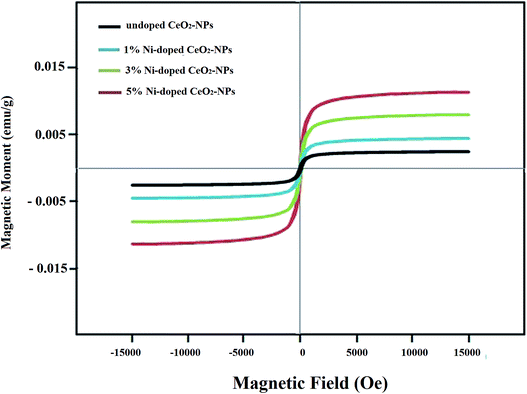 | ||
| Fig. 7 Magnetic hysteresis curves of the synthesized undoped and Ni-doped CeO2-NPs using S. persica extract. | ||
As a result, the magnetic moments were created through the spin polarization of the 4f electrons of the cerium ions besides the oxygen holes.47 In the same way, Coey et al. stated that oxygen holes increasing with the bond structure vibrations of the oxide group created considerable ferromagnetic properties in the sample.47 Sundaresan also suggested that the ferromagnetism in CeO2 came from exchanging unpaired spins of oxygen vacancies.48 The increase in the Ms values and the ferromagnetic behavior of Ni-doped CeO2-NPs can be explained through bound magnetic polarons (BMPs). BMPs are formed when the local spins of magnetic ions such as nickel interact with oxygen vacancies, leading to magnetic polarization near the local moments. Increasing the amount of oxygen vacancies will increase BMPs.38
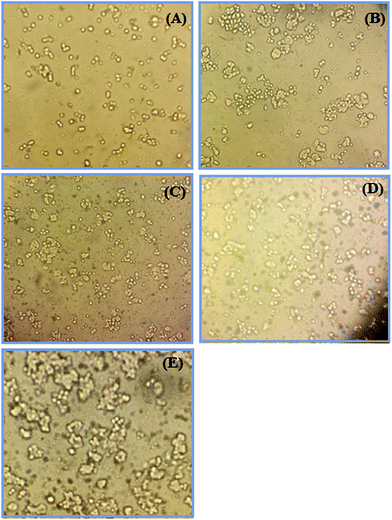
Cytotoxicity tests are designed to determine the toxicity of compounds to cells either qualitatively or quantitatively. The MTT assay is a quantitative cytotoxicity assay. The dye 3-(4,5-dimethylthiazol-2-yl)-2,5-diphenyltetrazolium bromide (MTT) is used in this assay. The MTT assay is a sensitive and valid index to determine the cellular metabolic activity.49,50 The cytotoxic activity of the synthesized non-doped and Ni-doped CeO2-NPs was determined using an MTT assay on the colon cancer cell line (HT-29). Fig. 8 shows the cytotoxic activity of the synthesized undoped and Ni-doped CeO2-NPs (0–400 μg mL−1) at 24 h incubation. The results showed that the synthesized non-doped CeO2-NPs did not have a cytotoxic effect on the HT-29 cells; our previous studies showed the same result for the CeO2 nanoparticles.7 The survey of the cytotoxic activity of CeO2-NPs against the HT-1080 and MCF-7 cell lines by M. J. Akhtar et al. showed no significant cell death.51 The cytotoxic effect of the synthesized nanoparticles against the HT-29 cells changed after doping nickel into CeO2-NPs. On increasing the Ni-doping value for CeO2-NPs, the cytotoxic activity increased. As shown in Fig. 7, the cell viability values for 3% Ni-doped CeO2-NPs (400 μg mL−1 concentration) and 5% Ni-doped CeO2-NPs (200 μg mL−1 concentration) are 56% and 50%, respectively. Similar results were observed for Ni-doped CeO2-NPs against the HEK-293 and SH-SY5Y cell lines by F. Abbas et al.52 They stated that the anticancer activity of their synthesized nanoparticles was related to the level of produced reactive oxygen species (ROS).48 The morphology of the cells was changed to treat Ni-doped CeO2-NPs (Fig. 9). Hence, the synthesized Ni-doped CeO2-NPs can be applied in cancer therapy in the future.
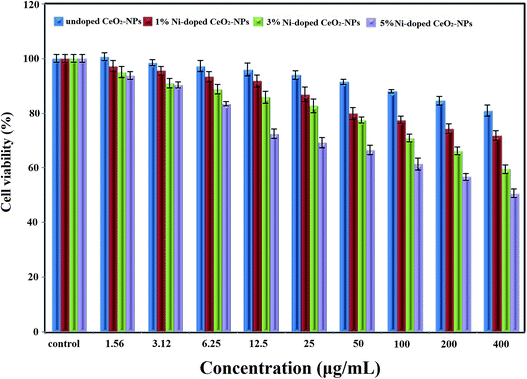 | ||
| Fig. 8 The cell viability of the synthesized undoped and Ni-doped CeO2-NPs on the HT-29 cell line at 24 h incubation. | ||
Sunscreens are graded based on the ability to absorb and emit UV rays. This is called the sun protection factor (SPF). This factor is determined by clinical tests or spectrophotometric measurements. Because clinical trials are time-consuming and the obtained results are similar in both methods,53 the spectrophotometric method was employed by using the Mansur equation (eqn (3)) to obtain the SPF values for the synthesized nanoparticles in this study.54
 | (3) |
| Wavelength (nm) | EE × I (normalized) |
|---|---|
| 290 | 0.0150 |
| 295 | 0.0817 |
| 300 | 0.2874 |
| 305 | 0.3278 |
| 310 | 0.1864 |
| 315 | 0.0837 |
| 320 | 0.0180 |
The SPF values of the undoped CeO2-NPs and 1, 3 and 5% Ni-doped CeO2-NPs were measured as 40.85, 43.62, 46.62 and 48.52, respectively (Table 4). The results showed that by increasing the percentage of nickel in the doped nanoparticles, its protection factor increased (Fig. 10). The UV protection mechanism of the zinc oxide and titanium oxide nanoparticles can be due to photon energy consumption. CeO2-NPs (∼4 eV) had a larger band-gap55 than zinc oxide (∼3.3 eV)56 and titanium oxide (∼3.4 eV)57 nanoparticles. Also, the size of the synthesized nanoparticles was in the range from 6.5 to 5 nm. The result of these two factors was that the synthesized nanoparticles were better than zinc oxide and titanium oxide for UV protection.37
| Concentration (μg mL−1) | |||
|---|---|---|---|
10![[thin space (1/6-em)]](https://www.rsc.org/images/entities/char_2009.gif) 000 000 |
1000 | 200 | |
| Undoped CeO2-NPs | 40.85 | 5.43 | 1.12 |
| 1% Ni-CeO2-NPs | 43.62 | 6.56 | 2.96 |
| 3% Ni-CeO2-NPs | 46.62 | 8.61 | 3.60 |
| 5% Ni-CeO2-NPs | 48.52 | 10.90 | 4.25 |
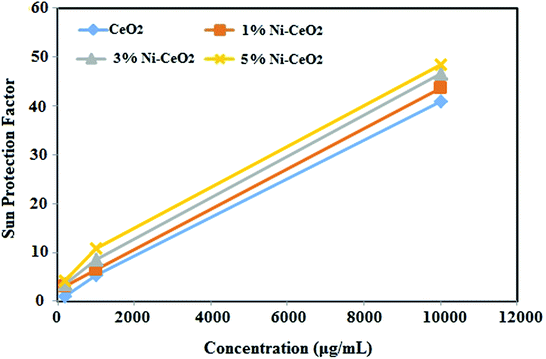 | ||
| Fig. 10 Sun protection factor (SPF) of the synthesized undoped and Ni-doped CeO2-NPs using S. persica extract. | ||
Conclusion
Cerium oxide nanoparticles (CeO2-NPs) are one of the most widely used metal oxide nanoparticles in the industry. Doping nanoparticles using transition elements improves the properties of the nanoparticles. By doping nickel in CeO2, the magnetic property and cytotoxic effect of the synthesized nanoparticles can increase. The results show that doping changes the main properties of nanoparticles and sometimes, it improves them.Conflicts of interest
There are no conflicts to declare.References
- S. Mobasser and A. A. Firoozi, J. Civ. Eng. Urbanism, 2016, 6, 84–93 Search PubMed.
- M. Rangasamy, J. Appl. Pharm. Sci., 2011, 1, 08–16 Search PubMed.
- W. T. Salam, M. Ikram, I. Shahzadi, M. Imran, M. Junaid, M. Aqeel, S. Anjum, A. Shahzadi, H. Afzal, U. Sattar, A. Asghar, A. Wahab, M. Naz, M. Nafees and S. Ali, Nanosci. Nanotechnol. Lett., 2018, 10, 1662–1670 CrossRef.
- M. Imran, M. Ikram, A. Shahzadi, S. Dilpazir, H. Khan, I. Shahzadi, S. Amber Yousaf, S. Ali, J. Geng and Y. Huang, RSC Adv., 2018, 8, 18051 RSC.
- A. Haider, M. Ijaz, M. Imran, M. Naz, H. Majeed, J. A. Khan, M. M. Ali and M. Ikram, Appl. Nanosci., 2019, 1–10 CAS.
- R. Elilarassi and G. Chandrasekaran, Optoelectron. Lett., 2010, 6(1), 6–10 CrossRef.
- M. Aqeel, S. Anjum, M. Imran, M. Ikram, H. Majeed, M. Naz, S. Ali and M. A. Ahmad, Mater. Res. Express, 2019, 6(8), 086215 CrossRef CAS.
- H. E. Liying, S. U. Yumin, J. Lanhong and S. H. I. Shikao, J. Rare Earths, 2015, 33, 791–799 CrossRef.
- A. Miri and M. Sarani, Ceram. Int., 2018, 4(11), 12642–12647 CrossRef.
- Y. Zhang, S. Andersson and M. Muhammed, Appl. Catal., B, 1995, 6(4), 325–337 CrossRef CAS.
- I. Mubeena Parveen, V. Asvini, G. Saravanan, K. Ravichandran and D. KalaiSelvi, Ionics, 2017, 23(5), 1285–1291 CrossRef.
- M. Yu, Y. A. Zhu, Y. Lu, G. Tong, K. Zhu and X. Zhou, Appl. Catal., B, 2015, 165, 43–56 CrossRef CAS.
- M. Farahmandjou, M. Zarinkamar and T. P. Firoozabadi, Rev. Mex. Fis., 2016, 62, 496–499 Search PubMed.
- M. Darroudi, M. Hakimi, M. Sarani, R. Kazemi Oskuee, A. Khorsand Zak and L. Gholami, Ceram. Int., 2013, 39, 6917–6921 CrossRef CAS.
- M. Darroudi, M. Sarani, R. Kazemi Oskuee, A. Khorsand Zak and M. S. Amiri, Ceram. Int., 2014, 40, 2863–2868 CrossRef CAS.
- Y. Shlapa, V. Sarnatskaya, I. Timashkov, L. Yushko, I. Antal, B. Gerashchenko, I. Nychyporenko, A. Belous, V. Nikolaev and M. Timko, Appl. Phys. A, 2019, 125, 412 CrossRef.
- H. Miyazaki, J. I. Kato, N. Sakamoto, N. Wakiya, T. Ota and H. Suzuki, Adv. Appl. Ceram., 2010, 109, 123–127 CrossRef CAS.
- S. M. Mortazavi, M. Khatami, I. Sharifi, H. Heli, K. Kaykavousi, M. H. Sobhani Poor, S. Kharazi and M. A. L. Nobre, J. Cluster Sci., 2017, 28(5), 2997–3007 CrossRef CAS.
- A. Miri and M. Sarani, J. Bionanosci., 2019, 9, 164–171 CrossRef.
- M. Khatami, H. Q. Alijani, B. Fakheri, M. M. Mobasseri, M. Heydarpour, Z. K. Farahani and A. U. Khan, J. Cleaner Prod., 2019, 208, 1171–1177 CrossRef CAS.
- A. Miri, M. Sarani, M. R. Hashemzadeh, Z. Mardani and M. Darroudi, Green Chem. Lett. Rev., 2018, 11, 567–572 CrossRef CAS.
- A. Miri, H. O. Shahraki Vahed and M. Sarani, Res. Chem. Intermed., 2018, 1–9 Search PubMed.
- A. Miri, S. R. Mousavi and M. Sarani, Orient. J. Chem., 2018, 34, 1513–1517 CrossRef CAS.
- M. Khatami, M. Soltani Nejad, S. Salari and P. Ghasemi Nejad Almani, IET Nanobiotechnol., 2016, 10(4), 237–243 CrossRef PubMed.
- M. Khatami, H. Heli, P. Mohammadzadeh Jahani, H. Azizi and M. A. L. Nobre, IET Nanobiotechnol., 2017, 11(6), 709–713 CrossRef.
- Z. Azizi, S. Pourseyedi, M. Khatami and H. Mohammadi, J. Cluster Sci., 2016, 27(5), 1613–1628 CrossRef CAS.
- M. Khatami, S. Iravani, R. S. Varma, F. Mosazade, M. Darroudi and F. Borhani, Bioprocess Biosyst. Eng., 2007, 42(12), 2007–2014 CrossRef PubMed.
- A. Miri, M. Khatami and M. Sarani, J. Inorg. Organomet. Polym. Mater., 2019, 1–8 Search PubMed.
- J. Akhtar, K. M. Siddique, S. Bi and M. Mujeeb, J. Pharm. BioAllied Sci., 2011, 3, 113–117 CrossRef CAS PubMed.
- M. Khatak, S. Khatak, A. A. Siddqui, N. Vasudeva, A. Aggarwal and P. Aggarwal, Pharmacogn. Rev., 2010, 4, 209–214 CrossRef CAS PubMed.
- S. C. Brown, M. Palazuelos, P. Sharma, K. W. Powers, S. M. Roberts, S. R. Grobmyer and B. M. Moudgil, Methods Mol. Biol., 2010, 624, 39–65 CrossRef CAS PubMed.
- M. Naz, N. Nasiri, M. Ikram, M. Nafees, M. Z. Qureshi, S. Ali and A. Tricoli, Appl. Nanosci., 2017, 7, 793–802 CrossRef CAS.
- M. Naz, M. Zahid Qureshi, A. Shahbaz, A. Haider, M. Ikram, M. Nafees, A. Shahzadi, T. Bashir, S. Ali, A. C. Blackburn, H. Chen and A. Tricoli, Nanosci. Nanotechnol. Lett., 2018, 10, 1–11 CrossRef.
- R. W. Tarnuzzer, J. Colon, S. Patil and S. Seal, Nano Lett., 2010, 5(12), 2573–2577 CrossRef PubMed.
- V. Ramasamy, V. Mohana and G. Suresh, Int. J. Mater. Sci., 2017, 12, 79–88 Search PubMed.
- J. D'Orazio, S. Jarrett, A. Amaro-Ortiz and T. Scott, Int. J. Mol. Sci., 2013, 14, 12222–12248 CrossRef PubMed.
- T. Boutard, B. Rousseau, C. Couteau, C. Tomasoni, C. Simonnard, C. Jacquot, L. J. M. Coiffard, K. Konstantinov, T. Devers and C. Roussakis, Mater. Lett., 2013, 108, 13–16 CrossRef CAS.
- F. Abbas, T. Jan, J. Iqbal, I. Ahmad, M. S. H. Naqvi and M. Malik, Appl. Surf. Sci., 2015, 357, 931–936 CrossRef CAS.
- A. C. Larson and R. B. Von Dreele, Report LAUR 86-748, Los Alamos National Laboratory, Los Alamos, 2004, pp. 162–164 Search PubMed.
- P. Thompson, D. E. Cox and J. B. Hastings, J. Appl. Crystallogr., 1987, 20, 79–83 CrossRef CAS.
- N. C. Halder and N. C. J. Wagner, Acta Crystallogr., 1966, 20, 312 CrossRef CAS.
- J. E. Langford, National Institute of Standards and Technology, Special Publication 846, Gaithersburg, MD, USA, 1992, p. 145 Search PubMed.
- L. Kumar, P. Kumar, A. Narayan and M. Kar, Int. Nano Lett., 2013, 3, 1–12 CrossRef.
- S. Sathyamurthy, K. J. Leonard, R. T. Dabestani and M. P. Paranthaman, Nanotechnology, 2005, 16, 1960–1964 CrossRef CAS.
- J. R. McBride, K. C. Hass, B. D. Poindexter and W. H. Weber, J. Appl. Phys., 1994, 76, 2435–2441 CrossRef CAS.
- R. Murugan, G. Vijayaprasath, T. Mahalingam and G. Ravi, Appl. Surf. Sci., 2016, 390, 583–590 CrossRef CAS.
- J. M. D. Coey, M. Venkatesan, P. Stamenov, C. B. Fitzgerald and L. S. Dorneles, Phys. Rev. B: Condens. Matter Mater. Phys., 2005, 72, 024450 CrossRef.
- A. Sundaresan, R. Bhargavi, N. Rangarajan, U. Siddesh and C. N. R. Rao, Phys. Rev. B: Condens. Matter Mater. Phys., 2006, 74, 161306 CrossRef.
- M. V. Berridge, P. M. Herst and A. S. Tan, Biotechnol. Annu. Rev., 2005, 11, 127–152 CAS.
- M. V. Berridge and A. S. Tan, Arch. Biochem. Biophys., 1993, 303, 474–482 CrossRef CAS PubMed.
- M. J. Akhtar, M. Ahamed, H. A. Alhadlaq, M. A. Majeed Khan and S. A. Alrokayan, J. Colloid Interface Sci., 2015, 453, 21–27 CrossRef CAS PubMed.
- F. Abbas, T. Jan, J. Iqbal, I. Ahmad, M. S. H. Naqvi and M. Malik, Appl. Surf. Sci., 2015, 357, 931–936 CrossRef CAS.
- R. M. Sayre, P. P. Agin, D. L. Desrochers and E. Marlowe, J. Soc. Cosmet. Chem., 1980, 31, 133–143 CAS.
- M. M. Donglikar and S. L. Deore, Pharmacogn. J., 2016, 8, 171–179 CrossRef CAS.
- A. Miri, M. Darroudi and M. Sarani, Appl. Organomet. Chem., 2020, 34(1), e5308 CrossRef CAS.
- V. Srikant and D. R. Clarke, J. Appl. Phys., 1998, 83(10), 5447–5451 CrossRef CAS.
- S. Valencia, J. M. Marín and G. Restrepo, Open Mater. Sci. J., 2010, 4, 9–14 CrossRef CAS.
| This journal is © The Royal Society of Chemistry 2020 |

