 Open Access Article
Mechanism and regeneration of sulfur-poisoned Mn-promoted calcined NiAl hydrotalcite-like compounds for C3H6-SCR of NO
Ling Zhao *ab and
Mengdi Kanga
aSchool of Ecology and Environment, Inner Mongolia University, China. E-mail: nmzhl@hotmail.com
bCenter for Environmental and Human Toxicology, Department of Physiological Sciences, College of Veterinary Medicine, University of Florida, USA
First published on 22nd January 2020
Abstract
The selective catalytic reduction of NO with propene (C3H6-SCR) in the presence of SO2 was investigated over a series of Mn-promoted calcined NiAl hydrotalcite-like compounds. The obtained 5% MnNiAlO catalyst exhibits superior NO conversion efficiency (95%) at 240 °C, and excellent sulfur-poisoning resistance. The possible reaction pathways of the catalytic process were proposed according to several characterization measurements. It is demonstrated that Mn-promoted NiAlO catalysts enhance the Brønsted acid sites and surface active oxygen groups, and improve the redox properties by the redox cycle (Ni3+ + Mn2+ ↔ Ni2+ + Mn4+). Thus, the amount of the reaction intermediates is improved, and the reactivities between CxHyOz species and nitrite/nitrate species are promoted. Furthermore, in the presence of SO2, the MnNiAlO samples can give rise to minor formation of sulfate and inhibit the competitive adsorption effectively due to their nitrite/nitrate species being more abundant and stable. Finally, regeneration was studied using in situ FTIR and the water washing method showed the best performance on the regeneration of S-poisoned catalysts.
1. Introduction
Among the many problems related to air pollution, nitrogen oxides (NOx) from stationary and mobile fuel combustion sources, due to its ever-increasing environmental concerns and more serious harm, have attracted more and more attention from society.1,2 The stringent environmental regulations require limiting NOx emissions and promote research into reducing or capturing NOx. The selective catalytic reduction of NOx by hydrocarbons (HC-SCR), which can eliminate NOx and unburnt hydrocarbons simultaneously, is regard as an economical, effective and energy-saving technique for the removal of NOx from automotive exhaust gases,3,4 and propylene has become the most widely used hydrocarbon.5However, an inevitable problem of SCR is the deactivation of catalysts by SO2, owing to its permanent existence in typical diesel fired exhausts.6 Thus, it is important to develop environmental-friendly SCR catalysts with excellent resistance against SO2 poisoning. In addition, a mechanistic investigation is highly desired to exploit new catalysts with high sulfur-resistance.
Metal oxide catalysts have attracted much attention due to their high specific surface area, acid–base bifunctionality, synergistic effects and memory effects.7,8 In previous reports, hydrotalcite derivatives such as La–Mg–Al,9 K/Mg–Al10 and Co–Ce11 all exhibited performance in NO removal. Xu et al.12 recently reviewed the progress over hydrotalcite-derived NiTi mixed oxide in NOx removal by selective catalytic reduction with ammonia. However, the sulfur resistance of the hydrotalcite-based catalyst is rarely studied. Previous literature analyzed the competitive adsorption between SO2 and NO. The deactivation mechanism of catalysts caused by SO2 reflects on two aspects.13–16 Zhang et al.13 reported that SO2 could react with reduction gas to form sulfate species which did not decompose at low temperature and finally deposited on the catalyst surface. Wu et al.14 demonstrated that the active phase on catalyst was sulfated by SO2 to form sulfate species, which competed with the formation of nitrogenous species. Crittenden, Li, and co-workers have also achieved great progress in the development of SCR catalysts with excellent sulfur-poisoning resistance.15,16
It has shown that the introduction of a metal adjuvant in the metal oxide can further improve the catalytic activity, selectivity and anti-poisoning properties of the original catalyst.17 According to the reports, manganese oxides have attracted special attention owing to their different types of labile oxygen and oxidation states,18 which are necessary and important for completing a catalytic cycle.18,19 Moreover, a series of manganese-containing metal oxide catalysts also show a significant enhancement of catalytic activity at low temperature.20 In brief, it is inevitable for the deactivation of catalysts caused by SO2. Therefore, the regeneration for catalysts is a very important process during SCR method. However the effect of SO2 on their generation and transformation, has not been systemically addressed.
Herein, we synthesized x% MnNiAlO catalysts and examined their against SO2-poisoning performance in the C3H6-SCR reaction. The reaction mechanism was investigated by in situ FTIR. The regeneration methods of deactivated catalyst were selected and investigated. The poisoning mechanism was analyzed by FTIR, XPS and Py-FTIR.
2. Experimental
2.1. Catalyst preparation
NiAl and ZrNiAl hydrotalcite were fabricated by a urea hydrolysis method according to the previous study.21 NiAl-based hydrotalcite precursors were prepared by hydrothermal method. Different proportions of Mn were loaded in the preparation process, followed by calcined to prepare catalyst samples of x% MnNiAlO. The x stands for the atomic number of Mn in the whole of Mn, Ni and Al. For example, 1% MnNiAlO indicates Mn![[thin space (1/6-em)]](https://www.rsc.org/images/entities/char_2009.gif) :
:![[thin space (1/6-em)]](https://www.rsc.org/images/entities/char_2009.gif) (Mn + Ni + Al) atomic ratio of 1
(Mn + Ni + Al) atomic ratio of 1![[thin space (1/6-em)]](https://www.rsc.org/images/entities/char_2009.gif) :
:![[thin space (1/6-em)]](https://www.rsc.org/images/entities/char_2009.gif) 100.
100.
2.2. Catalyst characterization
The powder X-ray diffraction (XRD) were manufactured by Rigaku D/max-γb X-ray diffractometer with a CuKα radiation (λ = 1.5418 Å), operated at 40 kV and 100 mA. Thermogravimetry analysis (TGA) was rendered on a NETZSCH STA 409 PC/PG simultaneous thermal analyses from 30–1000 °C in flowing air atmosphere. FTIR and Pyridine chemisorption spectra were obtained on a VERTEX 70 infrared spectrometer. The morphology of the catalysts was characterized by virtue of scanning electron microscopy (SEM, S-4800, Japan). The X-ray photoelectron spectroscopy (XPS) experiments were undertaken on an ESCALAB XI photoelectron spectrometer with Al Kα radiation. Curve fitting was conducted by use of XPSPEAK 4.1 with a Shirley background. Hydrogen temperature programmed reduction (H2-TPR) was carried out in a Quantachrome Chem-BET Pulsar TPR (p/n 02139-1). O2-TPD experiments were started from 30–1000 °C with a heating rate of 10 °C min−1 under Ar flow. A mass spectrometer (Hiden HPR20) was used for on-line monitoring of the O2-TPD effluent gas.2.3. Catalytic performance test
The de-NOx efficiency of the C3H6-SCR catalysts was evaluated employing a fixed-bed quartz tube reactor with the effluent gas of NO detected by gas chromatograph. Samples of 200 mg were applied to evaluate the catalytic performance under the following conditions: 1000 ppm NO, 1000 ppm C3H6, 5 vol% O2, He as balance, and the total gas flow rate was 100 mL min−1, the GHSV was 30![[thin space (1/6-em)]](https://www.rsc.org/images/entities/char_2009.gif) 000 h−1. Before each experiment, the catalyst was heated to 350 °C under He stream and held for 1 h, and the activity measurement was carried out at the heating rate of 10 °C min−1 from 150 °C to 350 °C. The conversion of NO was calculated as follows:
000 h−1. Before each experiment, the catalyst was heated to 350 °C under He stream and held for 1 h, and the activity measurement was carried out at the heating rate of 10 °C min−1 from 150 °C to 350 °C. The conversion of NO was calculated as follows:| NO conversion = ([NO]in − [NO]out)/[NO]in × 100% | (1) |
2.4. In situ FTIR measurements
The in situ FTIR experiments were performed on a VERTEX 70 infrared spectrometer. Before each experiment, the sample was pretreated at 400 °C in helium gas atmosphere for 60 min to remove trace impurities. When not specified, the test gas conditions were: [O2] = 5 vol%, [NO] = [C3H6] = [SO2] = 1000 ppm, He was a balance gas.2.5. Regeneration of deactivated catalysts
3. Results and discussion
3.1. Catalytic test
The NiAlO and MnNiAlO catalysts were tested in C3H6-SCR with and without SO2. The NO conversion results in the temperature range of 150–350 °C without SO2 are shown in Fig. 1(A). In these experiments, the NO conversion changed with the reaction temperature increasing over all the samples. The NiAlO sample achieved the maximum NO conversion of 43% at 250 °C. For Mn doped samples, their activities improved obviously, as well as the temperature corresponding to the maximum NO conversion shifted to a lower temperature. The 5% MnNiAlO exhibited the best catalytic performance with NO conversion which promptly reached about 95% at 240 °C. When the Mn amount is increased above 5% and further to 7%, the activity is declined. This phenomenon is owing to the excessive deposition of Mn, which leads to the agglomeration. Hence, we selected the 5% MnNiAlO catalyst as the target catalyst for further investigation.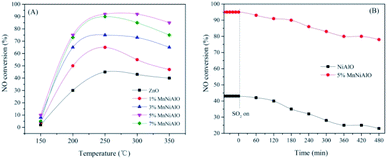 | ||
| Fig. 1 (A) NO conversion as a function of temperatures over NiAlO and x% MnNiAlO catalysts. (B) NOx conversion of NiAlO and 5% MnNiAlO catalysts in the presence of 100 ppm SO2 at 240 °C. | ||
The effects of the SO2 on catalytic activity was investigated over NiAlO and 5% MnNiAlO catalysts at 240 °C, and the results are shown in Fig. 1(B). After introduction of SO2 (100 ppm), the catalysts exhibit different sulfur-poisoning resistant properties. In terms of NiAlO sample, the NOx conversion dropped significantly from 43% to 23% after 8 h. In contrast, the 5% MnNiAlO catalyst maintained high activity (from 95% to 88%) and excellent stability in the first 8 h, implying that Mn introduction could enhance NOx reduction and maintain excellent catalytic activity in the presence of SO2.
3.2. Morphology and physical properties of the catalysts
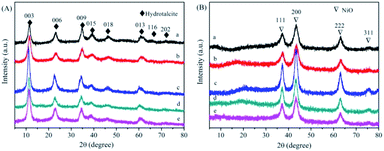
Fig. 2(A) shows the XRD spectra of NiAl-HT and four different Mn loadings samples. The characteristic peaks located at 11, 22, 35, 38, and 46° are assigned to the hydrotalcite structure (JCPDS 22-700).22–24 Meanwhile, there are no additional peaks derived from Mn species for MnNiAl-HT samples, suggesting that Mn is well dispersed on the surface of the carrier. The unit cell parameters a and c of the hydrotalcite can be calculated assuming a 3R stacking sequence; therefore, a = 2d110 and c = d003 + 2d006 + 3d009, where the value of a is the average distance of two metal cations in adjacent unit cells and c is the interlayer distance regulated by the size and charge of the anion placed between the brucite-like layers. The structural parameters of the hydrotalcite-like samples are listed in Table 1. Both a and c remained unchanged with increasing Mn loading due to the ion radius disparity similarity between Ni2+ (56 Å) and Mn4+ (54 Å).| Sample | D-value | Lattice parameter | ||||
|---|---|---|---|---|---|---|
| d003 | d006 | d009 | d110 | a | c | |
| NiAl-HT | 7.621 | 3.81 | 2.565 | 1.514 | 3.029 | 22.936 |
| 1% MnNiAl-HT | 7.576 | 3.767 | 2.558 | 1.518 | 3.036 | 22.783 |
| 3% MnNiAl-HT | 7.724 | 3.952 | 2.588 | 1.534 | 3.068 | 22.913 |
| 5% MnNiAl-HT | 7.724 | 3.876 | 2.588 | 1.539 | 3.078 | 23.240 |
| 7% MnNiAl-HT | 7.724 | 3.866 | 2.592 | 1.538 | 3.076 | 23.238 |
The XRD patterns of derived oxides (Fig. 2(B)) show the complete transformation from HT phase to oxide phase after calcination. The characteristic diffraction peak of the hydrotalcite disappeared, implying that the hydrotalcite structure collapses. Meanwhile, all samples show four distinctive peaks at about 37.4, 43.0, 63.4 and 75.2°, which are corresponding to the NiO (111), (200), (220) and (311) crystal planes (JCPDS 47-1049), respectively. No diffraction peaks corresponding to crystalline Mn phase can be observed, due to the low Mn content or the high dispersion of Mn oxide.
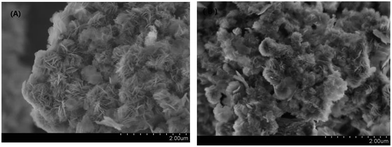
SEM of NiAlO and 5% MnNiAlO catalysts is presented in Fig. 3. Two samples both exhibited pompon shape. Moreover, it can be found that the exposed crystal face of MnNiAlO was larger than NiAlO, which could provide more active sites for catalytic reaction.
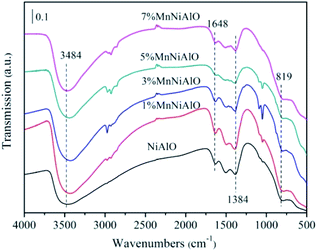
The infrared spectra of NiAlO and x% MnNiAlO are shown in Fig. 4. The strong and wide absorption band located at 3484 cm−1 is attributable to the superposition of the stretching vibration between the interlayer H2O and the layer-OH. The absorption band at 1648 cm−1 is attributed to the physically adsorbed water on the surface of the sample,25 and the absorption band at 1384 cm−1 is attributed to CO32−.25 The absorption peak at 819 cm−1 is mainly caused by the vibration of the skeleton of the metal bond.
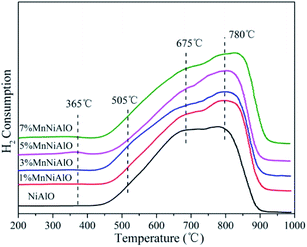
The H2-TPR technology was employed in evaluating the reducibility of the catalysts. For all samples (Fig. 5), there are two reduction peaks centered at 675 °C and 780 °C. The former is related to the reduction of Ni species which has a low interaction with Al2O3 or small Ni particles, and the latter belongs to the reduction of a stable Ni2+ compound (NiO–Al2O3 or NiAl2O4 formed during calcination) which strongly reacts with Al2O3.26 In the terms of x% MnNiAlO samples, they presented two new reduction peaks around 365 °C and 505 °C, although the peak signals were very weak. According to the previous literature, the two peaks can be attributed to the two-step reduction of MnO2: the first step corresponds to the reduction of MnO2 to Mn3O4, and the second step is the further reduction of Mn3O4 to MnO.27 The total H2 consumption increased at the same time as Mn-loading increased from 0 to 7 wt% as listed in Table 2, indicating that Mn doping can enhance the redox capacity of the samples, and finally accelerate the oxygen transfer and the oxidation process of NO to NO2.
| Sample | Peak α area (<400 °C) | Peak β area (400–750 °C) | Peak γ area (>750 °C) | Total area | Total H2 consumption (μmol g−1) |
|---|---|---|---|---|---|
| NiAlO | 1781.0 | 1897.3 | 505 | 4181.3 | 478.6 |
| 1% MnNiAlO | 1365.6 | 2422.2 | 667.2 | 4455.0 | 574.9 |
| 3% MnNiAlO | 1561.5 | 2485.2 | 513.8 | 4560.5 | 589.1 |
| 5% MnNiAlO | 1866.7 | 2914.5 | 422.6 | 5203.8 | 704.6 |
| 7% MnNiAlO | 1630.6 | 2594.8 | 498.6 | 5324.0 | 757.0 |
As shown in the O2-TPD experiment (Fig. 6), three main characteristic peaks are clearly observed over each sample, which locate at 200–400 °C, 400–750 °C and above 750 °C, corresponding to the physically/chemically adsorbed oxygen O2 (α), dissociated oxygen O2−/O− at the vacancy sites (β), and bulk lattice oxygen (γ), respectively.28 We also quantified the oxygen desorption peaks (Table 2), which suggested Mn incorporation obviously enhanced all the oxygen desorption peaks, especially the peak β, implying positive effects for the mobility of the active oxygen species of these catalysts. Besides, the physically/chemically adsorbed oxygen O2 (α) and dissociated oxygen O2−/O− at the vacancy sites (β) are found to be the most abundant over the 5% MnNiAlO catalyst, which reflect more active oxygen species. This is concordant with the catalytic test results (Fig. 1(A)). In fact, the first two kinds of oxygen species (α and β) are more crucial for the oxidation reaction during the C3H6-SCR.4 It is beneficial to the oxidation following the steps C3H6 → CxHyOz/carbonates (adsorption and oxidation) → CO/CO2 (desorbed species).4
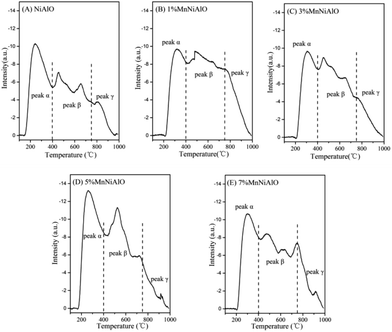 | ||
| Fig. 6 O2-TPD profiles of calcined NiAlO and MnNiAlO samples. (A) NiAlO; (B) 1% MnNiAlO; (C) 3% MnNiAlO; (D) 5% MnNiAlO; (E) 7% MnNiAlO. | ||
3.3. DRIFTS studies
 | ||
| Fig. 7 The in situ FTIR spectra of the NiAlO and x% MnNiAlO catalysts reacting with NO + O2 at 200 °C. (A) NiAlO; (B) 1% MnNiAlO; (C) 3% MnNiAlO; (D) 5% MnNiAlO; (E) 7% MnNiAlO. | ||
In the case of MnNiAlO catalysts (Fig. 7(B)–(E)), the reaction process is basically similar to that of NiAlO catalyst. By comparing the adsorption amount of nitrogen-containing species, it can be concluded that the introduction of Mn into NiAlO sample promotes the adsorptive and active ability of catalyst for NO. This fact indicates that the synergetic effect between Ni and Mn facilitates the formation of different adsorbed NOx species. It is worth noting that for 7% MnNiAlO catalyst (Fig. 7(E)), its adsorbed NO species calculated by the band intensities were less than those of other MnNiAlO catalysts.
![[double bond, length as m-dash]](https://www.rsc.org/images/entities/char_e001.gif) CH–O−).31 It is worth nothing that these surface CxHyOz adsorbed species grew rapidly within 10 min and then declined gradually, accompanied with a decrease in the signal of monodentate nitrate species (1279 cm−1). Besides, a large amount for gas phase CO2 was observed at 2335 cm−1 and 2349 cm−1.32 The peak at 3687 cm−1 is attributed to the v (OH) stretching of adsorbed H2O.32 It is evident that the intensities of these bands are increased with time passing, implying some amount of CO2 and H2O are generated during the C3H6-SCR reaction process. This result is in agreement with previous work.31 It is reported that the interactions of absorbed NO species and CxHyOz species are key steps for C3H6-SCR. CxHyOz amounts decreased by reaction with NO species and O2 though carbonate species, directly gave rise to CO2, N2 and H2O.
CH–O−).31 It is worth nothing that these surface CxHyOz adsorbed species grew rapidly within 10 min and then declined gradually, accompanied with a decrease in the signal of monodentate nitrate species (1279 cm−1). Besides, a large amount for gas phase CO2 was observed at 2335 cm−1 and 2349 cm−1.32 The peak at 3687 cm−1 is attributed to the v (OH) stretching of adsorbed H2O.32 It is evident that the intensities of these bands are increased with time passing, implying some amount of CO2 and H2O are generated during the C3H6-SCR reaction process. This result is in agreement with previous work.31 It is reported that the interactions of absorbed NO species and CxHyOz species are key steps for C3H6-SCR. CxHyOz amounts decreased by reaction with NO species and O2 though carbonate species, directly gave rise to CO2, N2 and H2O.
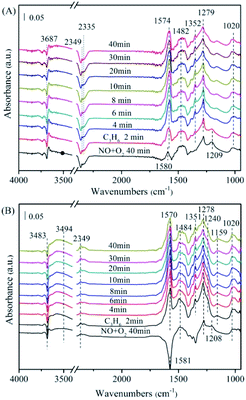 | ||
| Fig. 8 The in situ FTIR spectra of the NiAlO and 5% MnNiAlO catalysts reacting with NO + O2 and C3H6 at 200 °C. (A) NiAlO; (B) 5% MnNiAlO. | ||
Fig. 8(B) displayed the FTIR spectrum of 5% MnNiAlO, respectively. The MnNiAlO catalyst exhibited the similar trend to NiAlO sample. The main species on the samples after NO/O2 adsorption are nitrate ion (1581 cm−1), monodentate nitrate (1278 cm−1), bidentate nitrates (1020 and 1484 cm−1), and bridge bidentate nitrates (1208 cm−1). Switching to C3H6 atmosphere, the surface nitrate ion, bridge bidentate nitrate and monodentate nitrate species are observed to decline gradually. Surprisingly, the signal for chelating nitrite (at 1240 and 1159 cm−1) were recorded at the same time, which differs from what occurs over NiAlO sample, suggesting the enhanced adsorption ability of NO on 5% MnNiAlO catalyst. General speaking, a higher NO conversion of one catalyst depends on a lower accumulation of adNOx and a stronger generation of CxHyOz species during C3H6-SCR. Compared to NiAlO catalyst, Mn doping samples showed much more concentration of CxHyOz surface species, which is indeed advantageous to the further deNOx process. This phenomenon may be due to the excellent redox and oxygen storage/release ability of Mn that can strongly activate adNOx for conversion, which is correlated to the H2-TPR and O2-TPD results (Fig. 5 and 6). Additionally, by comparing the amount of CO2 and H2O produced, it can be judged that Mn incorporation promoted the reactivity of CxHyOz species with nitrite/nitrate species, decomposing to more CO2, N2 and H2O. These results are consistent with C3H6-SCR catalytic test (Fig. 1(A)).
3.4. SO2 poisoning experiments
It is known that flue gas contains SO2, the sulfate species with S![[double bond, length as m-dash]](https://www.rsc.org/images/entities/char_e001.gif) O bond can be formed on the surface of catalyst.33 Moreover, SO2 competes with NO for active sites to form sulfate species, thereby reducing the activity of catalyst. Meanwhile, SO2 can react with the reducing gas for poisoning catalyst. Thus, we infer the poisoning mechanism for (Mn)NiAlO catalysts as follows. SO2 mainly affects C3H6-SCR process through the following two aspects: one is the adsorption and activation of SO2 on the surface of catalyst competes with adsorption and activation of NO. The other is the reaction between sulfate/sulfite and C3H6 competes with the reaction between nitrate/nitrite and C3H6. Both 5% MnNiAlO and NiAlO catalysts are selected to compare their sulfur poisoning situation.
O bond can be formed on the surface of catalyst.33 Moreover, SO2 competes with NO for active sites to form sulfate species, thereby reducing the activity of catalyst. Meanwhile, SO2 can react with the reducing gas for poisoning catalyst. Thus, we infer the poisoning mechanism for (Mn)NiAlO catalysts as follows. SO2 mainly affects C3H6-SCR process through the following two aspects: one is the adsorption and activation of SO2 on the surface of catalyst competes with adsorption and activation of NO. The other is the reaction between sulfate/sulfite and C3H6 competes with the reaction between nitrate/nitrite and C3H6. Both 5% MnNiAlO and NiAlO catalysts are selected to compare their sulfur poisoning situation.
The FTIR experiments in a flow of NO/O2 after the catalyst pre-adsorbed SO2/O2 were performed and the results were presented in Fig. 9. In the case of NiAlO sample (Fig. 9(A)), the catalyst surface was mainly covered by sulfite (at 1035 cm−1),34 sulfate (at 1165, 1243 and 1340 cm−1)35,36 and molecular water (at 1601 cm−1) after SO2/O2 adsorption. These species were bound to the catalyst surface strongly as the subsequent N2 purging couldn't change their intensity of absorption bands. Switching to NO/O2, no significant adsorbed NOx species could be detected, indicating that SO2 competes with NO to adsorb over the NiAlO catalyst and occupies active sites preferentially through forming sulfite and sulfate species.
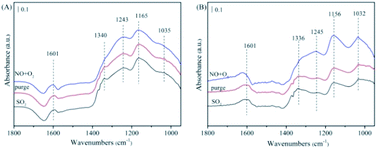 | ||
| Fig. 9 The FTIR spectra of the catalysts with pre-adsorbed SO2/O2 upon exposing in NO/O2, followed by C3H6/O2 at 200 °C. (A) NiAlO; (B) 5% MnNiAlO. | ||
For 5% MnNiAlO catalyst (Fig. 9(B)), introduction of SO2/O2 resulted in the appearance of less sulfate species according to reducing the peak intensity of sulfate (at 1156 and 1245 cm−1) compared with NiAlO sample. It is demonstrated significant decline of sulfate formation on 5% MnNiAlO sample. The results infer adding Mn could protect the active site of catalysts and improve resistance of catalysts towards SO2. Herein, we think there are two reasons to explain this phenomenon. (i) Mn loading inhibits the formation of sulfate; (ii) the sulfate species formed on MnNiAlO present lower thermal stability and easier to be decomposed. Subsequently under NO/O2 atmosphere, the peaks intensities of 1032, 1156 and 1245 cm−1 were increased obviously due to forming bidentate nitrate, chelating nitrite and monodentate nitrate, respectively, which differ from what occurs over NiAlO catalyst. This is clearly observed the absorbed NO species were generated much greater over SO2-poisoned MnNiAlO catalyst than over SO2-poisoned NiAlO. Based upon these results, it can be indicated that Mn addition gives rise to minor formation of sulfate after exposure to SO2 and improves the resistance of catalyst towards SO2. Moreover, the competitive adsorption phenomenon is dramatically inhibited over MnNiAlO samples due to their nitrite/nitrate species are more abundant and stable in comparison to NiAlO catalyst.
3.5. Regeneration of SO2-poisoned catalysts
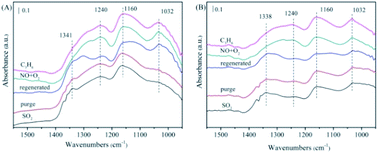 | ||
| Fig. 10 The FTIR spectra of the NiAlO and 5% MnNiAlO catalysts after thermal regeneration at 200 °C. (A) NiAlO; (B) 5% MnNiAlO. | ||
In the case of 5% MnNiAlO (Fig. 10(B)), the results were the same as those presented in the previous discussion. After thermal regeneration at 400 °C, the peaks of sulfite (1032 cm−1) and some sulfates (1160 cm−1) decreased, whereas that of sulfate at 1338 cm−1 increased slightly. The result demonstrated that after high-temperature regeneration, the 5% MnNiAlO catalyst had fewer types of sulfate species and smaller quantities than the NiAlO catalyst. After passing NO/O2, the absorption peaks at 1032 and 1156 cm−1 were enhanced, which were attributed to the presence of bidentate nitrate species. In addition, the absorption peak at 1240 cm−1 moved toward a low wavenumber because of the formation of a monodentate nitrate. After passing through C3H6, no change was observed in any peak. This proved that for the 5% MnNiAlO catalyst, thermal regeneration could partially restore the activation and adsorption capacity of NO but could not restore the reaction ability of C3H6 with these produced nitrogen oxides.
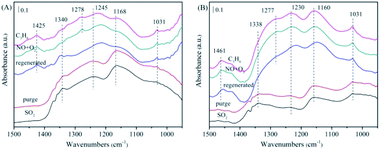 | ||
| Fig. 11 The in situ FTIR spectra of the NiAlO and 5% MnNiAlO catalysts after washed regeneration reacting with NO + O2 and C3H6 at 200 °C. (A) NiAlO; (B) 5% MnNiAlO. | ||
For 5% MnNiAlO catalyst (Fig. 11(B)), the peaks of sulfite (1031 cm−1) decreased, whereas that of sulfate at 1160 cm−1 increased. In addition, 5% MnNiAlO catalyst had fewer types of sulfate species and smaller quantities. More important, the sulfate peak at 1338 cm−1 disappeared. After injecting NO/O2, it also appeared the characteristic peak at 1277 cm−1, attributing to monodentate nitrate. After introduction of C3H6, the monodentate nitrate disappeared. According to the results, the method of washing regeneration can expose more active sites so as to facilitate the progress of adsorption and activation of SO2. It also can restore the ability of reaction between sulfate/sulfite and C3H6 of all catalysts, showing remarkable recovery ability over the MnNiAlO catalyst.
3.6. Study on the poisoning mechanism of S
XPS spectra were employed to further characterize the surfaces. The XPS spectra of Mn 2p are illustrated in Fig. 12(A). After a peak fitting deconvolution, the Mn 2p XPS spectra could be separated into two peaks of Mn2+ (639.8 eV) and Mn4+ (645.5 eV).37 From the results of XPS analysis, it is clearly to find that the quantity of Mn4+ in the S-poisoned catalyst was lower than that in the fresh catalyst. In contrast, in the regenerated catalyst, the Mn4+ peak intensity was greater. These results indicate that S poisoning resulted in a distinct decrease of surface Mn4+. It is proposed that high Mn4+ concentration could promote the oxidation of NO to NO2, while SO2 could be oxidized to SO42− using the oxygen supplied by Mn4+ species, leading to the partial reduction of Mn4+.38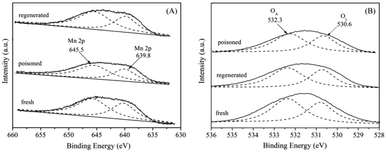 | ||
| Fig. 12 XPS spectra of the fresh, S-poisoned and washing regenerated 5% MnNiAlO catalysts. (A) Mn XPS spectra; (B) O XPS spectra. | ||
The O 1s spectra (Fig. 12(B)) can be deconvoluted with two peaks, referred to as the surface chemisorbed oxygen OA (532.0 eV), and lattice oxygen OL (530.6 eV), respectively.39 It is well known that OA is much more active than OL in oxidation reactions because of its higher mobility.40 Liu et al.41 showed that OA was the most active oxygen species which were deciding to the oxidation of NO, then the SCR reaction was enhanced by “fast SCR” reaction. We compared the quantity of OA via calculating the ratio of peak area: OA/(OA + OL). It can be seen that the OA/(OA + OL) ratio over SO2 poisoned sample (59.1%) was less than that of fresh sample (65.9%), because surface chemisorbed oxygen could be consumed by SO2. Further, the ratio of OA/(OA + OL) was recovered to 62.3% after washing regenerating, indicating that washing regeneration can restore partial surface chemisorbed oxygen of catalyst.
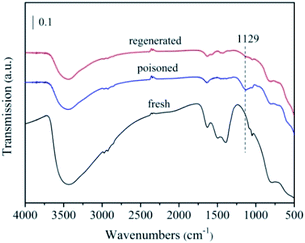
To further analysis the poisoning mechanism of the 5% MnNiAlO catalyst, we performed FTIR experiments on the fresh, S-poisoned and washing regenerated catalysts (Fig. 13). One peak appeared for the S-poisoned catalyst located at 1129 cm−1, which can be attributed to sulfate species. Importantly, there is an obvious decrease in the intensity of 1129 cm−1 peak over the washing regenerated samples. The results indicate that most of sulfate species deposited on the S-poisoned catalyst could be removed by water washing.
To distinguish the acidity styles and acid sites of the catalysts, the Py-IR characterization was performed. As shown in Fig. 14(A), the bands attributed to pyridine adsorbed on Brønsted acid sites (1576 cm−1) and Lewis acid sites (1491 and 1604 cm−1) were detected. Another band (1448 cm−1) due to pyridine interacting with both Brønsted and Lewis acid sites was also observed.42,43 Comparatively, the amount of Brønsted acid sites on fresh catalyst declined dramatically with SO2 poisoning treatment; whereas the amount of Lewis acid sites showed a slight increase.
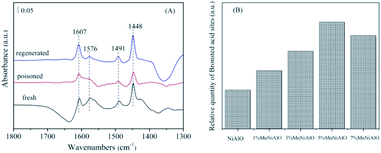 | ||
| Fig. 14 (A) FTIR spectra of pyridine adsorption on 5% MnNiAlO catalysts. (B) Brønsted acid sites quantification of NiAlO and MnNiAlO catalysts. | ||
This result implies that SO2 can increase the Lewis acid sites but decrease the Brønsted acid sites. Previous studies reported that Brønsted acid sites are important SCR active sites for NO reduction.44 The SO2-poisoned sample exhibited relatively weak NO adsorption strength and NO reduction ability, which agreed with the results of the FTIR spectra (Fig. 11). In addition, the Brønsted acid sites could be recovered to almost the same level as the fresh catalyst after washing regenerating. Meanwhile, from the Brønsted acid sites quantification analysis (Fig. 14(B)), we can see that the amount of Brønsted acid sites over MnNiAlO catalysts were more abundant than that of NiAlO sample.
On the basis of the above studies, some possible reaction mechanisms for improved NO reduction in the absence and presence of SO2 are provided as follows. On one hand, the NiAlO catalyst shows relatively poor activity owing to the weak redox, oxygen storage/release ability and less surface Brønsted acid sites, which lead to insufficient accumulation of adNOx and generation of CxHyOz species during C3H6-SCR. In the case of MnNiAlO catalysts, Mn doping enhances the Brønsted acid sites and active oxygen groups, and improves the redox property by the redox cycle (Ni3+ + Mn2+ ↔ Ni2+ + Mn4+). Subsequently, the reaction intermediates and the reactivity between CxHyOz species and nitrite/nitrate species are promoted, which contribute to excellent C3H6-SCR performance. On the other hand, in the presence of SO2, for the NiAlO catalyst, SO2 strongly competes with NO to adsorb on the catalyst surface to form stable NiSO4 or Al2(SO4)3 compounds, which can impair the amount of active sites and decline the occurrence of C3H6-SCR reactions. After Mn addition, the SO2-poisoned MnNiAlO catalysts generate much greater absorbed NO species than over SO2-poisoned NiAlO sample. SO2 reacts with Mn in the outer layer from the formation of MnSO4 which can protect the reaction active sites Ni–O–Al. It has been demonstrated that Mn addition gives rise to minor formation of sulfate after exposure to SO2 and improves the resistance of catalyst towards SO2. Furthermore, the competitive adsorption phenomenon is dramatically inhibited over MnNiAlO samples due to their nitrite/nitrate species are more abundant and stable in comparison to NiAlO catalyst. As a result, the C3H6-SCR of NO in the presence of SO2 has been significantly improved.
4. Conclusions
The various manganese amounts loaded NiAl hydrotalcite-like compounds were developed for selective catalytic reduction of NO with C3H6. Among them, 5% MnNiAlO catalyst exhibited more than 95% and 88% NOx conversion in the presence and absence of SO2, respectively. The Mn doping enhances the Brønsted acid sites and surface active oxygen groups, and improves the redox property by the redox cycle (Ni3+ + Mn2+ ↔ Ni2+ + Mn4+). In situ FTIR experiments showed that loading Mn on catalysts could improve the reaction intermediates and promote the reactivities between CxHyOz species and nitrite/nitrate species, which contributes to excellent C3H6-SCR performance. In addition, in the presence of SO2, the XPS and FTIR results showed that sulfur species and nitrogen species were deposited on the catalyst surface, which made the catalyst poisoned. The MnNiAlO samples can give rise to minor formation of sulfate and inhibit the competitive adsorption effectively due to their nitrite/nitrate species are more abundant and stable. Finally, water washing method showed best performance on the regeneration of deactivated catalysts. The Brønsted acid sites could be recovered to almost the same level as the fresh catalyst after washing regenerating.Conflicts of interest
There are no conflicts to declare.Acknowledgements
This research was financially supported by the National Natural Science Foundation of China (No. 21866022, 21347001, 21567018), Inner Mongolia Natural Science Foundation (No. 2013MS0203, 2017MS0214), Inner Mongolia Graduate Research Innovation Project (11200-12110201) and Inner Mongolia Engineering Research Center of Coal Chemical Wastewater Treatment & Resourcelization.References
- S. X. Cai, J. Liu, K. Zha, H. Li, L. Shi and D. Zhang, Nanoscale, 2017, 9, 5648–5657 RSC.
- T. Boningari and P. G. Smirniotis, Chem. Eng., 2016, 13, 133–141 Search PubMed.
- X. Y. Li, G. Lu, Z. P. Qu, D. K. Zhang and S. M. Liu, Appl. Catal., A, 2011, 398, 82–87 CrossRef CAS.
- W. Yang, R. D. Zhang, B. H. Chen, D. Duprez and S. Royer, Environ. Sci. Technol., 2012, 46, 11280–11288 CrossRef CAS PubMed.
- I. Sobczak, K. Musialska, H. Pawlowski and M. Ziolek, Catal. Today, 2011, 176, 393–398 CrossRef CAS.
- S. Putluru, L. Schill, A. Jensen, B. Siret, F. Tabaries and R. Fehrmann, Appl. Catal., B, 2015, 165, 628–635 CrossRef CAS.
- L. Fin, X. D. Wu and S. Liu, Chem. Eng., 2013, 226, 105–112 CrossRef.
- R. Jin, Y. Liu, Z. B. Wu, H. Q. Wang and T. T. Gu, Chemosphere, 2010, 78, 1160–1166 CrossRef CAS PubMed.
- Q. Li, M. Meng, H. Xian, N. Tsubaki, X. G. Li and Y. Xie, Environ. Sci. Technol., 2010, 44, 4747–4752 CrossRef CAS PubMed.
- Z. L. Zhang, Y. Zhang, Q. Y. Su, Z. P. Wang, Q. Li and X. Y. Gao, Environ. Sci. Technol., 2010, 44, 8254–8258 CrossRef CAS PubMed.
- L. Xue, H. He and C. Liu, Environ. Sci. Technol., 2009, 43, 890–895 CrossRef CAS PubMed.
- X. Wu, R. N. Wang, Y. L. Du and X. J. Li, New J. Chem., 2019, 43, 2640–2648 RSC.
- L. F. Zhang, X. L. Zhang, S. S. Lv, X. P. Wu and P. M. Wang, RSC Adv., 2015, 5, 82952–82959 RSC.
- Z. B. Wu, R. B. Jin, H. Q. Wang and Y. Liu, Catal. Commun., 2009, 10, 935–939 CrossRef CAS.
- Y. Peng, D. Wang, B. Li, C. Z. Wang, J. H. Li, J. Crittenden and J. M. Hao, Environ. Sci. Technol., 2017, 51, 11943–11949 CrossRef CAS PubMed.
- Y. Peng, W. Z. Si, X. Li, J. Chen, J. H. Li, J. Crittenden and J. M. Hao, Environ. Sci. Technol., 2016, 50, 9576–9582 CrossRef CAS PubMed.
- H. Zhou, Y. X. Su, W. Y. Deng and F. C. Zhong, Environ. Sci. Technol., 2016, 39, 93–100 CAS.
- Y. J. Kim, H. J. Kwon, I. S. Nam, J. W. Choung, J. K. Kil, H. J. Kim, M. S. Cha and G. K. Yeo, Catal. Today, 2010, 151, 244–250 CrossRef CAS.
- W. Tian, H. S. Yang, X. Y. Fan and X. B. Zhang, J. Hazard. Mater., 2011, 188, 105–109 CrossRef CAS PubMed.
- S. C. Deng, T. T. Meng, B. L. Xu, F. Gao, Y. H. Ding, L. Yu and Y. N. Fan, ACS Catal., 2016, 6, 5807–5815 CrossRef CAS.
- L. Zhao, X. Y. Li and J. Zhao, Chem. Eng. J., 2013, 223, 164–171 CrossRef CAS.
- L. Chmielarz, P. Kustrowski, A. R. Lasocha and R. Dziembaj, Thermochim. Acta, 2002, 395, 225–236 CrossRef.
- J. S. Valente, M. S. Cantu, J. G. H. Cortez, R. Montiel, X. Bokhimi and E. López-Salinas, J. Phys. Chem. C, 2007, 111, 642–651 CrossRef CAS.
- N. T. Nivangune and V. V. Ranade, Catal. Lett., 2017, 147, 2558–2569 CrossRef CAS.
- A. C. Vieira, R. L. Moreira and A. Dias, J. Phys. Chem. C, 2009, 113, 13358–13368 CrossRef CAS.
- A. Djaidja, S. Libs and A. Kiennemann, Catal. Today, 2006, 113, 194–200 CrossRef CAS.
- K. Ramesh, L. Chen and F. Chen, Catal. Today, 2008, 131, 477–482 CrossRef CAS.
- Z. Q. Liu, J. H. Li, M. Buettner, R. V. Ranganathan, M. Uddi and R. Wang, ACS Appl. Mater. Interfaces, 2019, 11, 17035–17049 CrossRef CAS PubMed.
- L. Chen, J. H. Li and M. Ge, Environ. Sci. Technol., 2010, 44, 9590–9596 CrossRef CAS PubMed.
- A. L. Goodman, E. T. Bernard and V. H. Grassian, J. Phys. Chem. A, 2001, 105, 6443–6457 CrossRef CAS.
- T. I. Halkides, D. I. Kontaridis and X. E. Verykios, Catal. Today, 2002, 73, 213–221 CrossRef CAS.
- H. Zhou, Y. X. Su, W. Y. Liao and F. C. Zhong, Fuel, 2016, 182, 352–360 CrossRef CAS.
- A. L. Goodman, P. Li, C. R. Usher and V. H. Grassian, J. Phys. Chem. A, 2001, 105, 6109–6120 CrossRef CAS.
- Y. Liu, E. Lotero and J. G. Goodwin, Appl. Catal., A, 2007, 331, 138–148 CrossRef CAS.
- V. G. Milt, M. A. Ulla and E. E. Miro, Appl. Catal., B, 2005, 57, 13–21 CrossRef CAS.
- L. Zhao, J. Duan, S. W. Yang, X. Y. Li, Q. F. Liu and C. J. Martyniuk, Sep. Purif. Technol., 2018, 207, 231–239 CrossRef CAS.
- C. Z. Sun, H. Liu, W. Chen, D. Z. Chen, S. H. Yu, A. N. Liu, L. Dong and S. Feng, Chem. Eng. J., 2018, 347, 27–40 CrossRef CAS.
- C. Fang, D. Zhang, S. Cai, L. Zhang, L. Huang, H. Li, P. Maitarad, L. Shi, R. Gao and J. Zhang, Nanoscale, 2013, 5, 9199–9207 RSC.
- K. J. Lee, P. A. Kumar, M. S. Maqbool, K. N. Rao, K. H. Song and H. P. Ha, Appl. Catal., B, 2013, 142–143, 705–717 CrossRef CAS.
- S. Zhan, H. Zhang, Y. Zhang, Q. Shi, Y. Li and X. Li, Appl. Catal., B, 2017, 203, 199–209 CrossRef CAS PubMed.
- F. Liu, H. He and Y. Ding, Appl. Catal., B, 2009, 93, 194–204 CrossRef CAS.
- N. Jagtap, S. B. Umbarkar and P. Miquel, Appl. Catal., B, 2009, 90, 416–425 CrossRef CAS.
- D. Yuan, X. Y. Li, Q. D. Zhao, J. J. Zhao and S. M. Liu, Appl. Catal., A, 2013, 451, 176–183 CrossRef CAS.
- L. Kang, L. P. Han, J. B. He, H. R. Li, T. T. Yan, G. R. Chen, J. P. Zhang, L. Y. Shi and D. S. Zhang, Environ. Sci. Technol., 2019, 53, 938–945 CrossRef CAS PubMed.
| This journal is © The Royal Society of Chemistry 2020 |

