 Open Access Article
Hierarchical porous carbons from carboxylated coal-tar pitch functional poly(acrylic acid) hydrogel networks for supercapacitor electrodes
Haiyang Wang ab,
Chuan Zhoua,
Hongzhe Zhu
 b,
Yixuan Lib,
Shoukai Wangb and
Kaihua Shen*a
aThe State Key Laboratory of Fine Chemicals, Dalian University of Technology, Dalian, 116012, China. E-mail: shen_kh@dlut.edu.cn; Tel: +86-411-84986102
bSinosteel Anshan Research Institute of Thermo-energy Company Limited, Anshan, 114044, China
First published on 7th January 2020
Abstract
A gel carbonization strategy for the synthesis of hierarchical porous carbons (HPCs) from carboxylated coal-tar pitches (CCP) functional poly(acrylic acid) (PAA) hydrogel networks for advanced supercapacitor electrodes was reported. The amphiphilic CCP and PAA polymer could be easily self-assembled to gel by the major driving force of hydrogen bonding and π–π stacking. The HPCs containing interconnected macro-/meso-/micropores were fabricated by direct carbonization of the dried hydrogels. The resultant HPCs with a high specific surface area and total pore volume of 1294.6 m2 g−1 and 1.34 cm3 g−1 respectively, as a supercapacitor electrode exhibit a high specific capacitance of 292 F g−1 at 1.0 A g−1 in two-electrode system. The electrode also exhibits ultra-long cycle life with a capacitance retention as high as 94.2% after 10![[thin space (1/6-em)]](https://www.rsc.org/images/entities/char_2009.gif) 000 cycles, indicating the good electrochemical stability. Furthermore, the concept of such hierarchical architecture and synthesis strategy would expand to other materials for advanced energy storage systems, such as Na-ion batteries and metal oxides for supercapacitors.
000 cycles, indicating the good electrochemical stability. Furthermore, the concept of such hierarchical architecture and synthesis strategy would expand to other materials for advanced energy storage systems, such as Na-ion batteries and metal oxides for supercapacitors.
1. Introduction
Supercapacitors have attracted increasing attention in recent years both in academic research and industrial applications because of their high power rating, excellent stability and long cycle life.1–3 The electrode is the key part of the supercapacitor, and the electrode materials are the most important factors to determine the properties of supercapacitor. Hierarchical porous carbon materials with 3D porous texture which have large specific surface area and pore volume, abundant pore structure, and a designed morphology of surface chemical properties are strongly recommended for the fabrication of advanced supercapacitors.4,5 Microporous carbon materials have high surface areas including micropores smaller than 1 nm which could storage much more charges at low current density, but the long diffusion distance leading to low accessible surfaces area at high current density.6,7 In contrast, macro–mesoporous carbons materials play a low capacitance because of their lower specific surface areas and larger pore size, but favor fast electrolyte ions transport in the bulk.8,9 Consequently, the optimum electrode materials have been considered to be high hierarchical inner-pore network and high specific surface area,10,11 in particular, which is expected to have a higher performer on the electronic conductivity and possess smaller pores interconnected with larger sets of pores, which could achieve both high surface area and efficient ion diffusion pathways.12,13In the past few years, great efforts have devoted to design and synthesis three dimensional porous carbon materials consisting of interconnected macropores, mesopores and micropores, hoping to display more high accessible surface area as well as shortening the diffusion distance for the advanced electrolytes.14–16 Activation or template methods are often used to prepare the HPCs, but the activation process often forms more micropores carbon materials and the resulting carbon materials have isolated non-interconnected pores. In contrast, dual template techniques have been widely used to obtain porous carbons with hierarchical porous structures and uniform pore sizes due to different sizes of templates. The templates commonly involve surfactant such as P123 and F127 as the soft template and SiO2, ZnO, zeolite as the hard template.17–20 For example, Qie et al. reported the preparation of HPCs through a facile modified chemical activation route with polypyrrole microsheets as precursor and KOH as activating agent.21 The typical HPC has a large specific surface area of 2870 m2 g−1 and a large specific capacitance of 318.2 F g−1 at a current density of 0.5 A g−1. Guo et al. reported the preparation of HPCs through the self-assembly of poly(benzoxazine-co-resol) with ionic liquid C16mimBF4 and a carbonization process.22 The sample shows a specific surface area of 376 m2 g−1 and a high specific capacitance of 247 F g−1 at a current density of 0.5 A g−1. Wang et al. prepared HPCs by using phenolic resin as carbon source and Ni(OH)2 as template.23 The HPC shows a high specific surface area of 970 m−2 g−1 and a specific capacitance of 198 F g−1 at a current density of 1.0 A g−1 In 6.0 M KOH. Up to date, only few approaches have been reported for the successful synthesis of HPCs, which involves the use of complicated template mainly and the tedious multi-step, and the synthesis of HPCs still remain a big challenging subject.24–26
Hydrogel carbonization has been considered as one of the viable options to avoid the complex and toxic procedure involved in hard/soft templating and chemical corrosive activation for the preparation of porous carbon materials.27–29 Hydrogels are 3D networks of crosslinked polymer chains that readily tune the architectures and pores nanostructure, which have significant applications in energy-storage system.30,31 But for he electrode materials, the electrochemical reactions occur at the electrode/electrolyte interface, the tunability of both ion and electron conductivity is critical.32 In fact, coal-tar pitch (CP) based carbon precursor takes many advantages of abundant π–π conjugation hexatomic ring moieties assuring high carbon yield as well as good electroconductivity.33 However, CP is composed of lamellar macromolecules in parallel stacks and has a dense structure. CP upon direct pyrolyzation and carbonization, became non-porous, irregular-shaped semi-coke or coke and cannot absorb a large number of ions and thereby ineffective for energy storage. Therefore, changing the surface properties and tune the nanostructure of CP and preparing pitch functional hydrogels are capable of providing high ionic conductivity, electronic conductivity and electrochemical activity, to improve energy-storage device performance.34,35
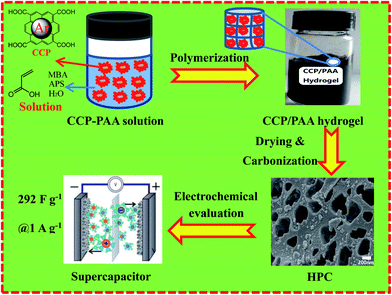
In this study, we employed a simple and feasible strategy to prepared the CCP functional PAA hydrogel composite and via one-step carbonization process to obtain the a well-developed micro–meso–macroporous network. Because of formation of fumes during thermal decomposition of PAA, a scalable macro-network would spread on the obtained hierarchical porous carbon. Carboxyl decomposition of CCP/PAA hydrogel was also investigated as a generation of CO2 and H2O, then following the gases react with carbon: CO2 + C → 2CO and H2O + C → CO + H2. A largest BET surface area and total pore volume of HPC-CCP/PAA are attained to 1294.6 m2 g−1 and 1.34 cm3 g−1 respectively, suggesting a fast electrolyte ion exchange and outstanding capacitive performance (292 F g−1 at 1.0 A g−1). HPCs also exhibits ultra-long cycle life with a capacitance retention as high as 94.2% after 10![[thin space (1/6-em)]](https://www.rsc.org/images/entities/char_2009.gif) 000 cycles, indicating the good electrochemical stability. Fig. 1 shows the scheme of preparation mechanism of hierarchical porous carbon in this study.
000 cycles, indicating the good electrochemical stability. Fig. 1 shows the scheme of preparation mechanism of hierarchical porous carbon in this study.
2. Experimental section
2.1 Materials
Coal-tar pitch (Anshan Iron and Steel Group Co. Ltd) was used to prepare CCP. Acrylic acid (AA), polytetrafluoroethylene (PTFE, catalog number FR301B), N,N′-methylene bisacrylamide (MBA) and ammonium persulfate (APS) were was purchased from Aladin Industrial Corporation Ltd., China. All chemicals were commercially available and of the analytical reagent grade.2.2 The preparation of the CCP/PAA functional hydrogel
CCP was prepared by the Friedel–Crafts acylation36 followed by Baeyer–Villiger oxidation.37 The AA (5.0 g) was dissolved in deionized water (40.0 g) using ultrasonication (10 min) in an ice bath until the solution was transparent completely. CCP (1.0 g) power was dispersed in AA solution and sonicated for 10 min in the ice bath. Afterwards, MBA (0.3 g) and APS (0.2 g) were dissolved in the CCP–AA mixture and the mixed solution was degassed under vacuum for about 30 min heated slowly to 80 °C (over about 10 min) and kept at this temperature for 4 h under a N2 atmosphere. After being cooled down to room temperature, the resulting hydrogel was immersed in the deionized water and washed in excess deionized water 10 times to remove the soluble impurities in the hydrogel. In addition, in order to measure the weight loading of CCP in dry hydrogel, the as-made CCP/PAA hydrogel was totally dried using vacuum drying. Finally, a dry CCP–PAA hydrogel with a mass of 5.4 g was obtained, indicating that the weight loading of CCP in the dry hydrogel is about 18.5 wt%.2.3 Carbonization
Carbonization of samples is carried out in a tube furnace under an atmospheric pressure by the following procedures. About 10 g sample is carbonized at 800 °C for 2 h with a heating rate of 2 °C min−1. A N2 stream was introduced into the tube furnace throughout the carbonization. For comparison, the carbonization of CCP and CCP/PAA hydrogel composite is denoted as HPC-CCP and HPC-CCP/PAA.2.4 Materials characterization
Thermogravimetry (TG) is recorded on Thermal Analyzer Shimadzu TA-60Ws with a heating rate of 2 °C min−1 from room temperature to 800 °C in nitrogen atmosphere. X-ray diffraction (XRD) patterns are investigated with the Ultima IV diffractometer (Rigaku, Japan) equipped with Cu-Kα radiation (λ = 1.5418 Å). The morphologies and microstructures of are characterized by field emission scanning electron microscopy (SEM, JSM-6701F) and transmission electron microscopy (TEM, JEM-2100UHR, Japan). Pore structure and specific surface are determined by nitrogen adsorption–desorption isotherms on a sorptometer (Micromeritics, ASAP 2020, America), and the total pore volume is determined from the amount of nitrogen adsorbed at relative pressure of 0.99. The specific surface area of samples is calculated using the BET equation, and their pore size distributions are calculated using the DFT model based on the desorption branch. All of the samples are degassed at 200 °C for 2 h prior to the measurements. AFM Lithography and Imaging: the experimental system of phase mode of AFM lithography consisted of a commercial AFM (Dimension Edge, Bruker), a piezoceramic disk (NCE51, Noliac), a lock-in amplifier including a function generators and a PID controller (HF2LI, Zurich Instruments AG), and a signal subtractor (custom design). All topography images were obtained by ScanAsyst mode (Bruker) with ScanAsyst-Air probe (with tip radius of ≈2 nm, Bruker).2.5 Electrochemical measurements
The carbon electrode was fabricated as follows. HPCs and polytetrafluoroethylene (PTFE) were mixed in a weight ratio of 9![[thin space (1/6-em)]](https://www.rsc.org/images/entities/char_2009.gif) :
:![[thin space (1/6-em)]](https://www.rsc.org/images/entities/char_2009.gif) 1. The resulting mixture was rolled into a thin film and further cut into circular shape (12 mm diameter). Each round film had a mass loading of 2.5 mg cm−2. The film was dried under vacuum at 120 °C for 2 h. This was then pressed onto nickel foams to fabricate supercapacitor electrodes. Finally, the electrodes were soaked in a 6 M KOH solution degassed using a vacuum for 2 h. A button-type supercapacitor was assembled using two analogous electrodes separated by a polypropylene membrane. Cyclic voltammetry (CV) and electrochemical-impedance spectroscopy (EIS) were conducted on a CHI760E electrochemical workstation (Chenhua, Shanghai, China). EIS was carried out over a frequency range of 100 KHz to 0.01 Hz with an amplitude of 5 mV. The galvanostatic charge–discharge (GCD) measurements and life-cycle tests were conducted on a supercapacitance test system (SCTs) by Arbin Instruments, USA. The specific capacitance of the working electrodes was calculated from the galvanostatic-discharge process via the following equations:
1. The resulting mixture was rolled into a thin film and further cut into circular shape (12 mm diameter). Each round film had a mass loading of 2.5 mg cm−2. The film was dried under vacuum at 120 °C for 2 h. This was then pressed onto nickel foams to fabricate supercapacitor electrodes. Finally, the electrodes were soaked in a 6 M KOH solution degassed using a vacuum for 2 h. A button-type supercapacitor was assembled using two analogous electrodes separated by a polypropylene membrane. Cyclic voltammetry (CV) and electrochemical-impedance spectroscopy (EIS) were conducted on a CHI760E electrochemical workstation (Chenhua, Shanghai, China). EIS was carried out over a frequency range of 100 KHz to 0.01 Hz with an amplitude of 5 mV. The galvanostatic charge–discharge (GCD) measurements and life-cycle tests were conducted on a supercapacitance test system (SCTs) by Arbin Instruments, USA. The specific capacitance of the working electrodes was calculated from the galvanostatic-discharge process via the following equations:
 | (1) |
In a two-electrode cell, the two symmetrical electrodes and a porous polypropylene separator were sandwiched together in a poly(tetrafluoroethylene) cell. The specific capacitance of the single electrode was calculated as:38,39
 | (2) |
The energy and power density of the symmetric supercapacitor system were calculated by the following eqn (3) and (4):
 | (3) |
 | (4) |
3. Results and discussion
3.1 Synthesis and characterization of CCP/PAA hydrogel composite
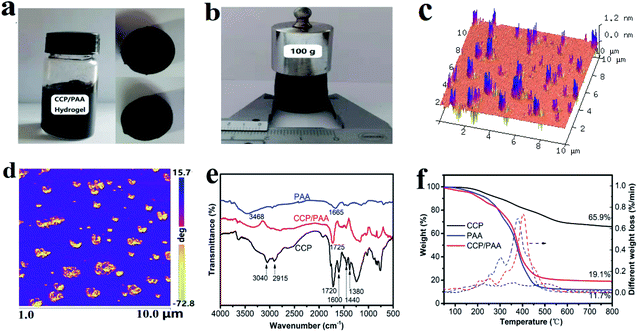
The typical CCP/PAA composite hydrogel was easily prepared by the solution polymerization method using acrylic acid (AA) monomer solution containing a certain amount of CCP. The CCP is uniformly dispersed in the acrylic acid solution due to the hydrogen-bonding interactions. During the polymerization process, MBA and APS were dissolved in the monomer/CCP mixture and the mixed solution was degassed under vacuum for about 30 min. Under a nitrogen atmosphere, the reaction mixture was stirred and heated to 80 °C in a water bath for 4 h. At the same time, polyacrylic acid and crosslinking agent form three-dimensional grid structure, while the CCP particles began to connect to the polymer via hydrogen bonding and form the 3D porous nanoscale matrix. Fig. 2a shows the photo image of CCP/PAA hydrogel composites and cross section. We can see the CCP uniform dispersed into the hydrogel system. A regular cylinder with diameter 2 cm can be obtained. Furthermore, the cylinder structure can be kept well after putting 100 g weight on it (Fig. 2b), showing that the prepared hydrogel has excellent mechanical strength.As shown in Fig. 2c, there are numerous peaks in a sequence on the relatively smooth surface, with the dispersal depth increases, the peaks increase in intensity. This type of structure is caused by the heterogeneous carboxylated coal-tar pitch particle structure which the CCP are composed with polyaromatic hydrocarbon, the relative rigidity is stronger than that of polyacrylic acid. This structure can also be distinguished in the phase image (Fig. 2d), in which the carboxylated coal-tar pitch particles (brown) appear to surrounded by an polymer matrix (blue). From the above, we can conclude that the CCP are well dispersed. Therefore, during the carbonization process, the PAA polymer in the hydrogel matrix will decomposed and develope abundant pores.
The FT-IR spectra of the CCP, PAA and CCP/PAA hydrogel composite are given in Fig. 2e. For CCP, the signals at 3040 and 2915 cm−1 result from aromatic C–H stretching vibrations and aliphatic C–H stretching vibrations, respectively.40 The signals at approximately 1720 cm−1 are assigned to carboxylic acid C![[double bond, length as m-dash]](https://www.rsc.org/images/entities/char_e001.gif) O stretching vibrations and the signals at 1600 cm−1 are attributed to aromatic C
O stretching vibrations and the signals at 1600 cm−1 are attributed to aromatic C![[double bond, length as m-dash]](https://www.rsc.org/images/entities/char_e001.gif) C stretching vibrations.41 The peaks at 1440 cm−1 and 1380 cm−1 are attributed to the C–H bending vibration of methyl and methylene.42 For the PAA hydrogel, the signals at approximately 3468 cm−1 are assigned to –OH stretching vibrations and the signals at 1665 cm−1 are attributed to aromatic C
C stretching vibrations.41 The peaks at 1440 cm−1 and 1380 cm−1 are attributed to the C–H bending vibration of methyl and methylene.42 For the PAA hydrogel, the signals at approximately 3468 cm−1 are assigned to –OH stretching vibrations and the signals at 1665 cm−1 are attributed to aromatic C![[double bond, length as m-dash]](https://www.rsc.org/images/entities/char_e001.gif) O stretching vibrations. And the CCP/PAA hydrogel curve is a composite curve of the PAA and CCP curves, which proves that the CCP is dispersed among the PAA molecular chains and that the CCP/PAA nanocomposite hydrogel is fabricated successfully. Compared with the FT-IR spectrum of the PAA hydrogel, the CCP/PAA composite hydrogel shows increased absorption bands at 1725 cm−1, which indicates that the CCP phases have been successfully added into the PAA matrix.
O stretching vibrations. And the CCP/PAA hydrogel curve is a composite curve of the PAA and CCP curves, which proves that the CCP is dispersed among the PAA molecular chains and that the CCP/PAA nanocomposite hydrogel is fabricated successfully. Compared with the FT-IR spectrum of the PAA hydrogel, the CCP/PAA composite hydrogel shows increased absorption bands at 1725 cm−1, which indicates that the CCP phases have been successfully added into the PAA matrix.
TGA was also used to determine the composition and thermal stability of each sample (Fig. 2f). The carbonization of CCP is above 200 °C and the mass loss between 200 °C and 600 °C was significant (29.9%), this is presumably due to the crosslinking and decomposition reaction of COOH groups and carboxylates. The mass loss between 600 °C and 800 °C was 3 wt% and can be attributed to the dehydroaromatization. The dehydration of PAA (to form anhydride rings) was occurred below 200 °C, and the decarboxylation (to form carbonyl compounds) was started from 200 °C. As the temperature further increased (300–450 °C), the rearrangement and scission of backbone chain was occurred, yielding the acrylic acid monomer as a volatile organic pyrolyzate.43 But, when the CCP/PAA hydrogel composite comes to its carbonization, the main carbonization process occurs at the temperature range from 200 to 500 °C, and its weight loss would hit bottom to 20% only for heating up to 450 °C. From the derivative curve of the TGA trace (DTG) that a remarkable mass losses of the CCP/PAA hydrogel composite is observed in the temperature range from 370 to 500 °C, forming much more macroporous network and mesoporous tunnel in its viscous flow state. In contrast, the pyrolysis of CCP shows a smooth process, being a simple carbon formation. Thus, the configuration of small oligomers and large macromolecule networks in the CCP/PAA hydrogel composite leads to a stepwise pyrolysis and aggregation process, which could have a significant effect on the morphology and microstructure of the resultant carbons.
3.2 Characterization of HPCs
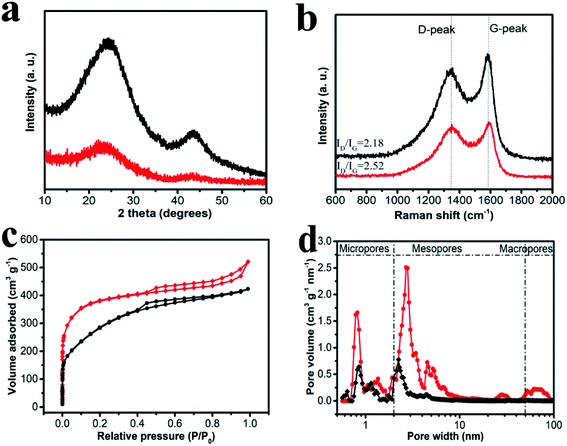
XRD and Raman were powerful techniques for characterizing the microstructure of carbon materials. In Fig. 3a, XRD profiles showed the information of HPCs all in terms of bulk. For HPC-CCP, two broad peaks at 2θ = 24° and 43° are observed, corresponding to the (002) and (100) facets of amorphous carbon. Comparing with HPC-CCP, 002 peak of HPC-CCP/PAA was broadened with adding the PAA, indicating that carbon materials had larger interplanar distance and fewer stacking number of graphene sheets. In addition, the peak of the carbon materials at 43° disappeared, implying that planar structure of HPC-CCP/PAA was turned to non-planar porous carbon during the whole preparation. These data together illustrated the amorphous property of porous carbon. Raman spectra (Fig. 3b) shows the D bands at ∼1320 cm−1 and G bands at ∼1590 cm−1, corresponding to the reflections of disordered and graphitic carbon, respectively.44 The peak intensity ratio between D and G-bands usually provides a useful index for comparing the degree of crystallinity of carbon materials.45,46 As shown in Fig. 3b, the value of ID/IG increases by adding the PAA, demonstrating suggesting a incremental change of disorders and defects, and reduction of sp2 domains in the carbon matrix probably generates from the thermolysis process of PAA. Together with XRD results, it indicated that the structure of the obtained carbon materials was more disordered than HPC-CCP and away from parallel-stacked structure.The specific surface areas and the pore structures of HPC-CCP/PAA and HPC-CCP are acquired from nitrogen adsorption–desorption measurement, presented in Fig. 3c and d. It is clear from Fig. 3c that the sorption profiles of HPC-CCP/PAA and HPC-CCP display a representative type IV isotherm with capillary condensation steps, indicating the mesopore size distributions of porous carbon materials. Even more noteworthy, HPC-CCP/PAA curve presents an up-tail phenomenon, illustrating the presence of macropores. In addition, it is obvious to see the rapid enhancement of adsorption volume under lower relative pressure, revealing the presence of large scale micropores, which is beneficial to larger specific areas in accordance with the data in Table 1. Meantime, the pore size distribution (PSD) curves are illustrated in Fig. 3b. Evidently, HPC-CCP possessed a relatively narrow PSD ranging from 0.5 to 5 nm. However, HPC-CCP/PAA has a wide PSD in the whole range of 0.5–100 nm, demonstrating a typical hierarchical pore structure. The reasons for the formation of hierarchical pores can be explained as following: (1) macropores can be attributed to the pyrolysis of PAA; (2) mesopores can be ascribed to the accumulation space among hydrogel and pores produced by carbonization; (3) micropores originated from CO2 and H2O activation. Compared to HPC-CCP, the reasonable hierarchical porous structure of HPC-CCP/PAA shows great potential in energy storage.
| Samples | SBET (m2 g−1) | Smeso (m2 g−1) | Vtotal (cm3 g−1) | Vmicro (cm3 g−1) | Vmeso (cm3 g−1) |
|---|---|---|---|---|---|
| HPC-CCP | 447.6 | 218.7 | 0.76 | 0.20 | 0.56 |
| HPC-CCP/PAA | 1294.6 | 782.6 | 1.34 | 0.42 | 0.87 |
Table 1 shows the pore structure parameters of the synthesized HPCs. HPC-CCP shows a specific surface area of 447.6 m2 g−1 and total pore volume of 0.76 cm3 g−1. In HPC-CCP/PAA composites, besides carbonization of CCP, the removal of polymer from the composites and the decomposed CO2 also generated pores, which shows an optimum pore structure with a highest surface area up to 1294.6 m2 g−1 and a highest pore volume of 1.34 cm3 g−1. The specific surface areas and pore volume of HPC-CCP/PAA are higher than those of HPC-CCP due to the combination of micro-, meso- and macropores. As we have discussed before, introduction of PAA brings micro- and macropores for the HPCs, which is beneficial to the fabrication of high surface porous carbon materials.
The scanning electron microscope (SEM) images of the obtained carbons samples are shown in Fig. 4, which demonstrates the tendency of the carbon nanostructures change by the introduce of PAA. It is clear that carboxyl-functionalized coal-tar pitch would improve the anhydride-crosslinked bridges between the adjacent carboxylic group and the anhydrides subsequent disintegration to generate CO and CO2.47 The heat decarboxylation would facilitate to shape pore structures. As PAA is introduced into CCP through the in situ polymerization, CCP/PAA hydrogel composite could turn to HPCs after being carbonized at 800 °C, which shows a novel hierarchical macropores bunched with meso-microporous structure (Fig. 4c and d). In the CCP/PAA hydrogel composite, carbonization of CCP (thermosetting resins) provides carbon skeleton for the resultant HPCs, while decomposition of PAA (thermoplastic resins) results in the formation of well-connected macropores. Also, we are interested in the decarboxylation of CCP/PAA composites at high temperature, and the pyrolysis of carboxylic group to CO2 and H2O, and the CO2 + C → 2CO and H2O + C → 2CO + H2 occurs in the carbonization and create pores for the HPCs. We are summarizing above investigations and hope to explain the influences of hierarchical porous formation.
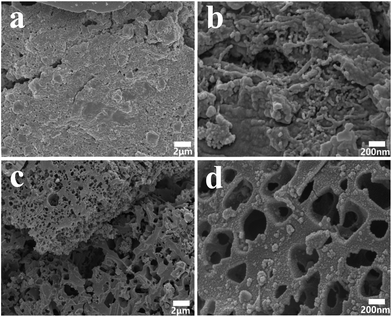 | ||
| Fig. 4 (a and b) SEM microphotograph of the carbonized product from carboxylated coal-tar pitch (CCP); (c and d) CCP composited with poly(acrylic acid) (PAA) at 800 °C. | ||
3.3 Electrochemical evaluation
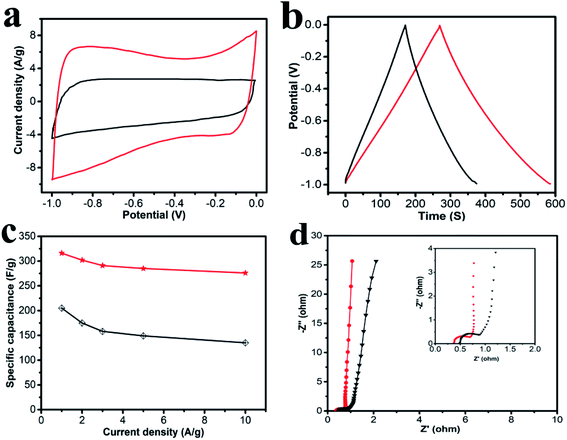
The electrochemical performances of the obtained carbon materials were investigated in a three-electrode system in 6.0 M KOH solution and CV profiles of HPC-CCP/PAA and HPC-CCP at the scan rates of 100 mV s−1 are exhibited in Fig. 5a. It is found that the CV curves exhibited a typical rectangular I–V curve without any redox peak with bumps −1.0 to 0 V, which suggests that both electrodes have ideal EDLC behaviors which are ascribed to the electric double layers formation due to the coulombic effects and the efficient electro-sorption/desorption of electrolyte ions.48,49 The electrochemical active area of the curve is highly related to the specific capacitance of EDLC electrode. Noteworthy, at the same scan rate, the HPC-CCP/PAA presented the largest encircling area of the CV curve, suggesting its improved energy storage capacities.50 The excellent supercapacitor performance HPC-CCP/PAA can be ascribed to the large specific surface and the optimized pore size distribution in the HPC-CCP/PAA framework. The large specific surface provide more effective sites for the adsorption of electrolyte ions, which is favorable for the high specific capacity; the optimized pore size distribution can offer abundant channels for the penetration of electrolyte ions into the pores with a shorter diffusive distance and a lower inner resistance.Galvanostatic charge–discharge (GCD) curves of the carbon materials obtained at 1 A g−1 (Fig. 5b) showed almost symmetrical triangles with a tiny deformation, revealing good reversibility of electrodes in the process of GCD and the excellent capacitance response without faradaic reaction.51 Evidently, at the current density of 1.0 A g−1, the capacitance of HPC-CCP/PAA calculated from the galvanostatic charge–discharge curve is 316 F g−1, much higher than that of HPC-CCP (205 F g−1). The large specific capacitance may be caused by its high accessible surface areas and rich reasonable distributed pores.
The rate performances are presented in Fig. 5c. The specific capacitances decrease with an increase in current density for all samples. The behavior is related closely to the pore-size dependent diffusion limitation of ions inside the electrode material at higher current densities.52 It is worth noting that the specific capacitance of the HPC-CCP/PAA (285 F g−1) is much higher than that of the HPC-CCP electrode (149 F g−1) at 5 A g−1 in KOH electrolyte. Even at 10 A g−1, the capacity of HPC-CCP/PAA can still reach up to 276 F g−1, revealing its outstanding rate performance.
Electrochemical impedance spectroscopy (Fig. 5d) was conducted to understand the capacitance mechanism. In the low frequency region, the line that is nearly parallel to the imaginary axis demonstrates excellent supercapacitor capacitive behavior.53 In the medium frequency region, the inclined line with a 45° slope corresponds to the diffusive resistance of electrolyte ions within the pores of electrode materials (Warburg resistance). In the high frequency region, the semicircle diameter indicates a change in transport resistance (Rct) at the electrode/electrolyte interface.54 Electrochemical impedance spectroscopy of the HPC-CCP/PAA presents a short Warburg region and a small semicircle diameter, which means that its hierarchical porous structure favors electrolyte ion access and rapid ion transportation.
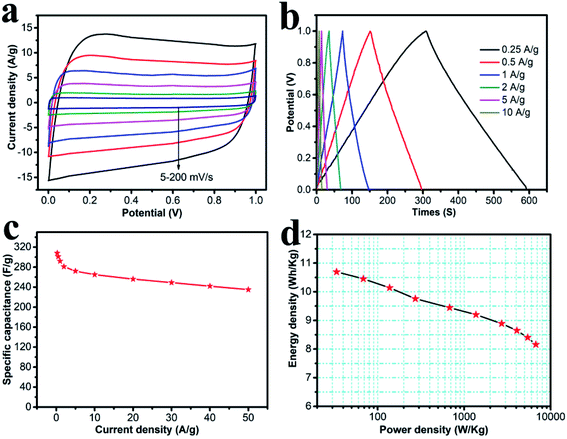
The symmetric supercapacitor was assembled using HPC-CCP/PAA, both as the positive- and negative-electrodes. Fig. 6a shows the CV curves at scanning rates of 5–200 mV s−1 in a 6.0 M KOH solution. All the CV curves were in a perfect rectangular shape without any redox peaks or distortions suggesting faster ion/charge transport within electrodes and a near-ideal capacitive behavior with an excellent rate capability. Fig. 6b shows the galvanostatic charge–discharge curves of the HPC-CCP/PAA-based supercapacitor at current densities from 0.25–10 A g−1. The symmetric linear charge and discharge curves with negligible voltage drop demonstrated a high coulombic efficiency and a minimal internal resistance. The specific capacitances at different current densities are shown in Fig. 6c. From the discharge curve, the specific capacitance at a constant current density of 0.25 A g−1 was found to be 308 F g−1, which is much higher than that of the RGO-CMK-5 electrode (144.4 F g−1 at 0.2 A g−1),55 the curved graphene electrode (154.1 F g−1 at 1 A g−1),56 and the 3DG-MnO2-13% electrode (36 F g−1 at 0.5 A g−1)57 in a two-electrode system. Notably, the capacitance was 235 F g−1 at a high current density of 50 A g−1. Fig. 6c reveals that the capacitance decreases quickly from 308 to 292 F g−1 when the current density increases from 0.25 to 1 A g−1. And then, it drops slowly at higher current densities ranging from 1–50 A g−1. Fig. 6d represents the Ragone plot, which shows that the energy density exhibits only a minimal drop with the increase in power density. As is already known, the energy density of devices is decided by capacitance (C) and voltage (V). In the present study, the energy and power density were 8.16 W h kg−1 and 6.74 kW kg−1 at a current density of 50 A g−1, respectively, which confirmed an outstanding power performance. These values are higher than previously reported carbon materials58–60 studied under the same measurement conditions.
Cycling stability is one of the most important parameters for practical application of supercapacitors, and the results is shown in Fig. 7. HPC-CCP/PAA based supercapacitor was investigated by charge–discharge measurement at a constant current density of 1 A g−1 for 10![[thin space (1/6-em)]](https://www.rsc.org/images/entities/char_2009.gif) 000 cycles. Although the specific capacitance of the HPC-CCP/PAA electrode decreased gradually with the cycling number (Fig. 7a), a capacitance retention of 94.2% was still obtained after 10
000 cycles. Although the specific capacitance of the HPC-CCP/PAA electrode decreased gradually with the cycling number (Fig. 7a), a capacitance retention of 94.2% was still obtained after 10![[thin space (1/6-em)]](https://www.rsc.org/images/entities/char_2009.gif) 000 cycles, which indicates its good electrochemical stability. The rectangular CV profile (Fig. 7a inset) and Nyquist plots (Fig. 7b) with negligible changes after 10
000 cycles, which indicates its good electrochemical stability. The rectangular CV profile (Fig. 7a inset) and Nyquist plots (Fig. 7b) with negligible changes after 10![[thin space (1/6-em)]](https://www.rsc.org/images/entities/char_2009.gif) 000 cycles support this electrochemical cyclability. The small semicircle in the high-frequency region and the almost vertical line in the low-frequency region indicate that HPC-CCP/PAA has an excellent electrical conductivity (Fig. 7b inset). The capability of HPC-CCP/PAA that integrated its high rate performance with an excellent cycling stability is of great importance for high-performance supercapacitors. HPC-CCP/PAA in the electrode composes an excellent conductive network, which facilitates the transfer of electrons at high charge/discharge rates, and benefits its rate capability. Due to the outstanding electrochemical performances, HPC-CCP/PAA shows a promising applications as high-rate supercapacitor electrode materials, which provides new insight into the rational design of 3D HPCs for energy storage applications.
000 cycles support this electrochemical cyclability. The small semicircle in the high-frequency region and the almost vertical line in the low-frequency region indicate that HPC-CCP/PAA has an excellent electrical conductivity (Fig. 7b inset). The capability of HPC-CCP/PAA that integrated its high rate performance with an excellent cycling stability is of great importance for high-performance supercapacitors. HPC-CCP/PAA in the electrode composes an excellent conductive network, which facilitates the transfer of electrons at high charge/discharge rates, and benefits its rate capability. Due to the outstanding electrochemical performances, HPC-CCP/PAA shows a promising applications as high-rate supercapacitor electrode materials, which provides new insight into the rational design of 3D HPCs for energy storage applications.
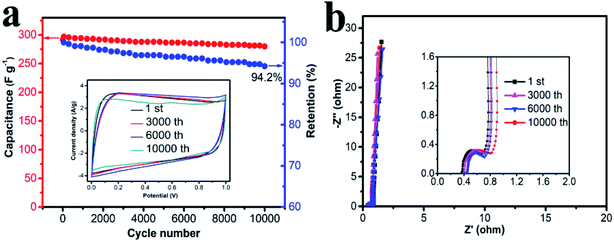 | ||
| Fig. 7 (a) CV curves of the carbonized CCP/PAA hydrogel composite based electrode at different cycles; (b) Nyquist plots with the inset showing the plots in the high frequency region. | ||
4. Conclusion
In this work, we show a novel hierarchical macroporous carbon bunched with meso–microporous structures HPCs from CCP composited with PAA, and a moulded hierarchical porous structures was obtained after a carbonizing process. The effects of pores parameters were studied by thermal analysis, which has been remarkably achieved for high capacity utilization, excellent rate capability and ultra-long cycling stability. A largest BET surface area and total pore volume of HPC-CCP/PAA are got with 1294.6 m2 g−1 and 1.34 cm3 g−1 respectively, suggesting a fast electrolyte ion exchange and outstanding capacitive performance (292 F g−1 at 1.0 A g−1) in two-electrode system. HPCs also exhibits ultra-long cycle life with a capacitance retention as high as 94.2% after 10![[thin space (1/6-em)]](https://www.rsc.org/images/entities/char_2009.gif) 000 cycles, indicating the good electrochemical stability. Furthermore, the concept of such hierarchical architecture and synthesis strategy would expand to other materials for advanced energy storage systems, such as silicon for Li-ion batteries and metal oxides for supercapacitors.
000 cycles, indicating the good electrochemical stability. Furthermore, the concept of such hierarchical architecture and synthesis strategy would expand to other materials for advanced energy storage systems, such as silicon for Li-ion batteries and metal oxides for supercapacitors.
Conflicts of interest
There are no conflicts to declare.References
- Y. Wang, B. Chang, D. Guan and X. Dong, J. Solid State Electrochem., 2015, 19, 1783–1791 CrossRef CAS.
- J. Song, Y. Chen, K. Cao, L. Yang, H. John and X. Tao, ACS Appl. Mater. Interfaces, 2018, 10, 39839–39850 CrossRef CAS PubMed.
- Y. Zhang, X. Liu, S. Wang, S. Dou and L. Li, J. Mater. Chem., 2016, 4, 10869–10877 RSC.
- M. Li, Y. Zhang, L. Yang, Y. Liu and J. Yao, Electrochim. Acta, 2015, 166, 310–319 CrossRef CAS.
- H. Duan, T. Yan, Z. Li, G. Chen, J. Zhang and L. Shi, et al., Sustainable Energy Fuels, 2017, 1, 1557–1567 RSC.
- L. Peng, Y. J. Cai, Y. Luo, G. Yuan, J. Y. Huang and C. F. Hu, et al., ACS Sustainable Chem. Eng., 2018, 6, 12716–12726 CrossRef CAS.
- H. Itoi, H. Nishihara and T. Kyotani, Langmuir, 2016, 32, 11997–12004 CrossRef CAS PubMed.
- J. H. Cao, C. H. Zhu, Y. Aoki and H. Habazaki, ACS Sustainable Chem. Eng., 2018, 6, 7292–7303 CrossRef CAS.
- B. Z. Fang, J. H. Kim, M. S. Kim and J. S. Yu, Acc. Chem. Res., 2013, 46, 1397–1406 CrossRef CAS PubMed.
- W. Yang, F. Ding, L. Sang, Z. Ma and G. Shao, Carbon, 2017, 111, 419–427 CrossRef CAS.
- D. Zhu, Y. Wang, W. Lu, H. Zhang, Z. Song and D. Luo, et al., Carbon, 2017, 111, 667–674 CrossRef CAS.
- H. J. Liu, J. Wang, C. X. Wang and Y. Y. Xia, Adv. Energy Mater., 2011, 1, 1101–1108 CrossRef CAS.
- B. You, J. H. Jiang and S. J. Fan, ACS Appl. Mater. Interfaces, 2014, 6, 15302–15308 CrossRef CAS PubMed.
- K. S. Xia, Q. M. Gao, J. H. Jiang and J. Hu, Carbon, 2008, 13, 1718–1726 CrossRef.
- Y. S. Ye, H. Wang, S. G. Bi, Y. Xue, Z. G. Xue and Y. G. Liao, et al., Carbon, 2015, 86, 86–97 CrossRef CAS.
- R. M. Benzigar, S. N. Talapaneni, S. Joseph, K. R. Singh, J. Scaranto and U. Ravon, et al., Chem. Soc. Rev., 2018, 47, 2680–2721 RSC.
- R. L. Liu, W. J. Ji, T. He, Z. Q. Zhang, J. Zhang and F. Q. Dang, Carbon, 2014, 76, 84–95 CrossRef CAS.
- H. A. Xu, Q. M. Gao, H. L. Guo and H. L. Wang, Microporous Mesoporous Mater., 2010, 133, 106–114 CrossRef CAS.
- X. M. Ma, L. H. Gan, M. X. Liu, P. K. Tripathi, Y. H. Zhao and Z. J. Xu, et al., J. Mater. Chem. A, 2014, 2, 8407–8415 RSC.
- X. M. Ma, L. H. Gan, M. X. Liu, P. K. Tripathi, Y. H. Zhao and Z. J. Xu, et al., J. Mater. Chem. A, 2013, 1, 7379–7383 RSC.
- L. Qie, W. M. Chen, H. H. Xu, X. Q. Xiong, Y. Jiang and F. Zou, et al., Energy Environ. Sci., 2013, 6, 2497–2504 RSC.
- D. C. Guo, J. Mi, G. P. Hao, W. Dong, G. Xiong and W. C. Li, et al., Energy Environ. Sci., 2013, 6, 652–659 RSC.
- D. W. Wang, F. Li, M. Liu, G. Q. Lu and H. M. Cheng, Angew. Chem., Int. Ed., 2009, 48, 1525 CrossRef CAS.
- M. Y. Liu, J. Niu, Z. P. Zhang, M. L. Dou and F. Wang, Nano Energy, 2018, 51, 366–372 CrossRef CAS.
- D. H. Han, Y. C. Jiao, W. Q. Han, G. H. Wu and A. G. Dong, Carbon, 2018, 140, 265–275 CrossRef CAS.
- D. H. Wang, Y. Z. Wang, Y. Chen, W. Liu, H. Q. Wang and P. H. Zhao, et al., Electrochim. Acta, 2018, 283, 132–140 CrossRef CAS.
- J. Zhang, Y. Shi, Y. Ding, L. Peng, W. Zhang and G. Yu, Adv. Energy Mater., 2017, 14, 1602876 CrossRef.
- H. Shi, Z. Fang, X. Zhang, F. Li, Y. Tang, Y. Zhou, P. Wu and G. Yu, Nano Lett., 2018, 18, 3193–3198 CrossRef CAS PubMed.
- J. Bae, Y. Li, J. Zhang, X. Zhou, F. Zhao, Y. Shi, J. B. Goodenough and G. Yu, Angew. Chem., Int. Ed. Engl., 2018, 57, 2096–2100 CrossRef CAS PubMed.
- M. Liao, P. Wan, J. Wen, M. Gong, X. Wu and Y. Wang, et al., Adv. Funct. Mater., 2017, 27, 1–11 Search PubMed.
- L. Han, X. Lu, K. Liu, K. Wang, L. Fang and L.-T. Weng, et al., ACS Nano, 2017, 11, 2561–2574 CrossRef CAS PubMed.
- Y. Liu, G. Zhou, K. Liu and Y. Cui, Acc. Chem. Res., 2017, 50, 2895–2905 CrossRef CAS PubMed.
- P. P. Chang, C. Y. Wang, T. Kinumoto, T. Tsumura, M. M. Chen and M. Toyoda, Carbon, 2016, 108, 225–233 CrossRef CAS.
- C. Zhong, Y. Deng, W. Hu, J. Qiao, L. Zhang and J. Zhang, Chem. Soc. Rev., 2015, 44, 7484–7539 RSC.
- Y. Shi, X. Zhou and G. Yu, Acc. Chem. Res., 2017, 50, 2642–2652 CrossRef CAS PubMed.
- H. Wang, H. Zhu, S. Wang, D. Qi and K. Shen, RSC Adv., 2019, 9, 20019–20028 RSC.
- H. Wang, H. Zhu, Y. Li, D. Qi, S. Wang and K. Shen, RSC Adv., 2019, 9, 29131–29140 RSC.
- S. Song, F. Ma, G. Wu, D. Ma, W. Geng and J. Wan, J. Mater. Chem. A, 2015, 3, 18154–18162 RSC.
- W. Yang, W. Yang, F. Ding, L. Sang, Z. Ma and G. Shao, Carbon, 2017, 111, 419–427 CrossRef CAS.
- J. A. Monge, D. C. Amoros, A. Gungor and L. Toppare, Fuel, 2001, 80, 41–48 CrossRef.
- M. Acik, C. Mattevi, C. Gong, G. Lee, K. Cho, M. Chhowalla and Y. J. Chabal, ACS Nano, 2010, 4, 5861–5868 CrossRef CAS PubMed.
- H. M. Zhu, J. H. Yan, X. G. Jiang, Y. E. Lai and K. F. Cen, J. Hazard. Mater., 2008, 153, 670–676 CrossRef CAS PubMed.
- R. P. Lattimer, J. Anal. Appl. Pyrolysis, 2003, 68, 3–14 CrossRef.
- H. Hwang, C. H. Kim, J. Wee, J. H. Han and C. Yang, Appl. Surf. Sci., 2019, 489, 708–716 CrossRef CAS.
- C. Li, X. Zhang, K. Wang, X. Sun, G. Liu, J. Li, H. Tian, J. Li and Y. Ma, Adv. Mater., 2017, 29, 1604690 CrossRef PubMed.
- N. I. T. Ramli, S. Abdul Rashid, Y. Sulaiman, M. S. Mamat, S. A. Mohd Zobir and S. Krishnan, J. Power Sources, 2016, 328, 195–202 CrossRef CAS.
- C. Bommier, R. X. W. Wang, X. F. Wang, D. Wen, J. Lu and X. L. Ji, Nano Energy, 2015, 13, 709–717 CrossRef CAS.
- G. R. M. Haro, C. Macias and C. O. Ania, Carbon, 2011, 49, 3723–3730 CrossRef.
- H. S. Teng and C. T. Hsieh, Carbon, 2002, 40, 667–674 CrossRef.
- B. T. Ang, K. Zhang, L. L. Zhang, X. S. Zhao and J. S. Wu, J. Mater. Chem., 2011, 21, 2663–2670 RSC.
- R. A. Outlaw, J. R. Miller and B. C. Holloway, Science, 2010, 329, 1637–1639 CrossRef PubMed.
- M.-S. Park, S. Cho, E. Jeong and Y.-S. Lee, J. Ind. Eng. Chem., 2015, 23, 27–32 CrossRef CAS.
- L. Wang, J. Wang, F. Jia, C. Wang and M. Chen, J. Mater. Chem. A, 2013, 1, 9498–9507 RSC.
- T. E. Rufford, D. Hulicova-Jurcakova, K. Khosla, Z. Zhu and G. Q. Lu, J. Power Sources, 2010, 195, 912–918 CrossRef CAS.
- Z. Lei, Z. Liu, H. Wang, X. Sun, L. Lu and X. Zhao, J. Mater. Chem. A, 2013, 1, 2313–2321 RSC.
- C. Liu, Z. Yu, D. Neff, A. Zhamu and B. Z. Jang, Nano Lett., 2010, 10, 4863–4868 CrossRef CAS PubMed.
- X. Sun, H. Wang, Z. Lei, Z. Liu and L. Wei, RSC Adv., 2014, 4, 30233–30240 RSC.
- W. Xing, S. Z. Qiao, R. G. Ding, F. Li, G. Q. Lu, Z. F. Lan and H. M. Cheng, Carbon, 2005, 44, 216–224 CrossRef.
- W. Yang, F. Ding, L. Sang, Z. Ma and G. Shao, Carbon, 2017, 111, 419–427 CrossRef CAS.
- Y. Tao, X. Xie, W. Lv, D. M. Tang, D. Kong, Z. Huang, H. Nishihara, T. Ishii, B. Li and D. Golberg, Sci. Rep., 2013, 3, 2975–2982 CrossRef PubMed.
| This journal is © The Royal Society of Chemistry 2020 |

