DOI:
10.1039/C9RA09243A
(Paper)
RSC Adv., 2020,
10, 2650-2660
Ultra-low concentration protein detection based on phenylalanine–Pd/SWCNT as a high sensitivity nanoreceptor†
Received
7th November 2019
, Accepted 26th December 2019
First published on 14th January 2020
Abstract
Pd doped single-walled carbon nanotubes as an enhanced physical transducer with phenylalanine amino acid can be efficiently used as a biocompatible nanoreceptor to detect proteins. DFT/B3LYP was used to calculate the optimized geometries, energies and electron density parameters to determine the stability and reactivity of the nanoreceptor. Among different adsorbed configurations of phenylalanine, the amine and carboxylic acid sites have higher adsorption energies and more stable complexes. With direct strong chemical adsorption of phenylalanine amino acid onto the Pd doped single-walled carbon nanotube, the free active carboxylic acid group of the amino acid can react with free amine groups on the surface of the proteins. More over the π–π stacking interaction between the free aromatic ring of adsorbed phenylalanine amino acid onto the functionalized single-walled carbon nanotube and the aromatic rings of the proteins also contributes to the intelligent detection of proteins. Frontier molecular orbital and molecular electrostatic potential (MPE) surface studies have been employed to investigate the active sites of the nanoreceptor. The effects of different solvents on the structural and electronic properties were investigated. Finally, in order to investigate biological function of the biosensor, docking studies were performed.
1. Introduction
Amino acids are the structural units of proteins and important intermediates in metabolism. They influence the biological function of organs and glands. These biological organic compounds are composed of amine and carboxylic functional groups. L-Stereoisomer proteinogenic amino acids form the building blocks of proteins.1 Amino acids which differ in chemical and physical properties determine the biological activity of proteins. The structural stability of proteins is a sequence of amino acids which affect the protein folding into three dimensional structures.2 The human body does not have all enzymes required for biosynthesis of all amino acids, so essential amino acids must be supplied in foods. Degradation of the body's proteins has been resulted from failure of obtaining these amino acids.
Biosensors, analytical detection devices, offer higher performance in terms of sensitivity and selectivity than other diagnostic devices. The development of biosensors began in 1950 by L. C. Clark in Cincinnati USA, to measure the dissolved oxygen in blood.3 Biosensors consist of a biological entity combined with a physicochemical detector component. The biological component acts as sensing element. This sensitive biological element could be enzymes, nucleic acids, cell receptors or complex materials such as tissues and microorganisms.4–7 The developments of biosensor technology result from their application in clinical and diagnostic analysis, industrial processing and monitoring, environmental pollution monitoring and so on.8–10 Many biosensors have been designed to detect biomolecules during last decades. Amino acids and proteins could be important biomarkers which offer information of the initiation and state of some diseases. Proteinuria and aminoaciduria may be an important sign of glomerular diseases, post-infectious, diabetes mellitus and some type of malignancies. Ultra low-level of amino acid and protein detection in urine could be the outstanding progress in diagnostic and monitoring in disease management. Powerful tool for early diagnosis and cellular microenvironment analysis could be offered by nano-scaled transducer platform coupled to aromatic amino acid as the bioreceptors. Meanwhile, carbon nanotubes (CNTs), synthetic carbon allotropes, discovered by Iijima in 1991,11 present new opportunities for biomedical researches due to their unique thermal, physical, chemical and electronic properties.12–14 These properties depend on their diameter, length and curvature. CNTs can be single-walled (SWCNT), double-walled or multi-walled. These polyaromatic molecules with low dimension and high surface-to-volume ratio have fast response time and high sensitivity. Thus SWCNTs exhibit charge-sensitive conductance as an excellent sensor. To improve the adsorption feature, SWCNTs can be functionalized through doping, decorating or defecting with impurity atoms sensor.15–17 The shift in Fermi level with dopant metal can modify the reactivity and the electronic properties of SWCNT.18 Because of the hydrophobic surface of pristine SWCNT, functionalized nanomaterial could be a good candidate as a nanobiosensor because of the biocompatibility and aqueous solubility.19 In this paper we introduce a reliable nanoreceptor based on the hybrid of Pd doped single walled carbon nanotube with phenylalanine (Phe) aromatic amino acid which shows promising stability and effective applications for protein detection in biomedical applications. A thorough investigation of the structure and bonding of suggested nanoreceptor have been studied in the present work. In this paper, we have also investigated the effects of different solvents on the structure and electronic properties of titled nanoreceptor by DFT SCRF theory. Evolving understanding of chronic kidney disease (CKD) and, in particular, the cardiovascular risks that CKD confers, demands more sensitive detection of protein in urine.20 At all levels of protein excretion albumin is usually a major protein in urine.21–23 Human serum albumin (HSA) is the principal extracellular protein of blood plasma, synthesized and secreted from liver cells. It plays an important role in maintaining normal osmolarity in plasma as well as in interstitial fluids. It is a globular protein consisting of a single peptide chain of 585 amino acids, largely helical (∼67%) and having 67 kDa mass. It is composed of three structurally homologous domains (I, II, and III), each containing subdomains A and B stabilized by 17 disulfide bridges. Each domain contains 10 helices; helices 1–6 form the respective subdomains A, and helices 7–10 comprise subdomains B.24–26 This protein, in particular, was selected to explore the recognition behavior of the mentioned biosensor.
2. Computational details
2.1. Quantum mechanics setup
All the computations were performed with Gaussian 09 program package27 using the density functional theory (DFT). A segment of (5,5) armchair SWCNT containing 70 carbon atoms, 19 hydrogen atoms and a Pd atom which replaced in the middle of the SWCNT fragment, was chosen as a model. Full geometry optimization was computed at B3LYP method28 with 6-311+G(d) basis set and DGDZVP extrabasis set for Pd atom. HOMO–LUMO energy gap, MESP, AIM and NBO analysis were performed at the same level. Structure and electronic properties of Pd/SWCNT during the adsorption of Phe molecule via amine (Complex 1) and carboxyl (Complex 2) active sites were studied. The adsorption energy, Eads, is calculated according to expression (1):| | |
Eads = EPhe–Pd/SWCNT − (EPhe + EPd/SWCNT)
| (1) |
where EPhe–Pd/SWCNT is the total energy of Pd/SWCNT with Phe molecule and EPhe and EPd/SWCNT are the total energy of Pd/SWCNT and Phe molecule respectively. All optimized geometries were verified to be local minima since no imaginary frequencies were found in frequency calculations. NBO model was performed for charge analysis and AIM theory was used to get detailed information about the interactions.29–32
DFT-based reactivity descriptors have been calculated to predict reactivity and selectivity sites of the titled nanoreceptor according to Koopman's theorem equations:33
| |
 | (2) |
| |
 | (3) |
where
μ is the chemical potential and
η is chemical hardness. Parr introduced the global electrophilicity index using the chemical potential and chemical hardness:
34| |
 | (4) |
2.2. AutoDock setup
In silico modeling approaches such as molecular docking35 are effective tools for predicting putative binding sites and binding affinities. This program has been used widely because it displays good free energy correlation values between docking simulations (observed) and experimental data. AutoDock combines two methods to achieve these goals: rapid grid-based energy evaluation and efficient search of torsional freedom.36,37
The docking program AutoDock (version 4.2) was used to perform the molecular modeling of Phe–Pd/SWCNT binding to human serum albumin (HSA). The crystal structure of HSA (entry PDB code 1AO6) was downloaded from the Protein Data Bank. Hydrogen atoms were added, all water molecules were removed. Then rotations and torsions for the ligand were automatically assigned in the ADT (AutoDock Tools). Kollman united atom partial charges were assigned. All other parameters were default settings. The searching grid box was sufficiently large to wrap the whole protein, the ligand was blindly docked into the protein using the Lamarckian generic algorithm (GA). A total of 200 GA runs were performed, resulting in 200 docking conformations. We considered only the minimum energy conformation state of ligand bound protein complex in our study out of 200 generated binding modes. The hydrogen bonding and hydrophobic interactions between Phe–Pd/SWCNT and HSA were visualized by LigPlot+ and PyMol molecular graphic programs.
3. Results and discussion
3.1. Geometry optimization
The full optimized geometries of Phe molecule and Pd/SWCNT are shown in Fig. 1. Doping of the Pd atom caused the deformation of six-member near the doping site of SWCNT because of the larger diameter of Pd. When Phe molecule adsorbed toward the Pd/SWCNT, two representative adsorption configurations, in which the amine and carboxyl groups are close to the nanotube are formed, which are shown in Fig. 2 by panel a and b from side and top view respectively. As listed in Table 1, after Phe adsorption, Phe bond lengths changed. N–H and C–N in Phe increase in Complex 1. The bond lengths of all Pd–C in Pd/SWCNT increase in Complex 2. The bond length of C16–O21 increased during Phe adsorption in the corresponding Complex 2. Phe–Pd/SWCNT interaction distances are 2.37 and 2.29 Å in Complex 1 and 2 respectively. The values of adsorption energies are −86.08 and −87.23 kJ mol−1 for Complex 1 and 2 respectively (see Table 2). The high value of chemisorptions adsorption energy of complexes specially demonstrate that Pd functionalized SWCNT is extremely sensitive to its surrounding environment and could be an excellent platform for CNT based nanobiosensor.
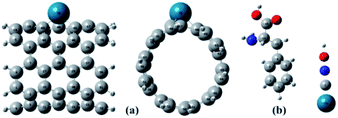 |
| | Fig. 1 The full optimized geometries of (a) Pd/SWCNT from side and top view and (b) Phe molecule. | |
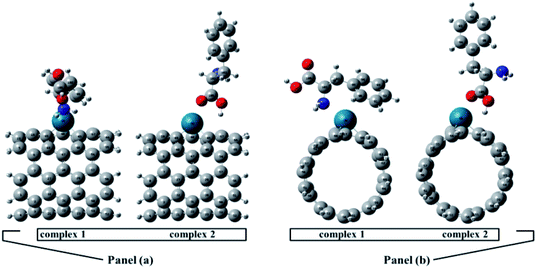 |
| | Fig. 2 Phe molecule adsorbed toward the Pd/SWCNT, the amine and carboxyl groups are close to the nanotube are formed, which are shown by panel (a) and (b) from side and top view respectively. | |
Table 1 Geometrical parameters (in Å) of phenylalanine and Pd/SWCNT before and after adsorption and its percentage changes
| Bond Label |
Before adsorption |
After adsorption (amine site) |
Percentage change (amine site) |
After adsorption (carbonyl site) |
Percentage change (carbonyl site) |
| Phe |
| C4–C12 |
1.514 |
1.513 |
−0.08 |
1.513 |
−0.05 |
| C12–C13 |
1.551 |
1.547 |
−0.26 |
1.558 |
0.44 |
| C13–C16 |
1.538 |
1.534 |
−0.24 |
1.529 |
−0.54 |
| C13–N18 |
1.458 |
1.471 |
0.88 |
1.456 |
−0.10 |
| N18–H19 |
1.018 |
1.020 |
0.21 |
1.019 |
0.08 |
| N18–H20 |
1.019 |
1.021 |
0.19 |
1.018 |
−0.10 |
| C16–O21 |
1.211 |
1.209 |
−0.18 |
1.234 |
1.86 |
| C16–O22 |
1.358 |
1.353 |
−0.39 |
1.318 |
−3.03 |
| O22–H23 |
0.976 |
0.977 |
0.04 |
1.005 |
2.83 |
| C12–H14 |
1.099 |
1.098 |
−0.11 |
1.098 |
−0.13 |
| C12–H15 |
1.094 |
1.094 |
0.02 |
1.096 |
0.24 |
| C13–H17 |
1.098 |
1.098 |
−0.07 |
1.094 |
−0.38 |
![[thin space (1/6-em)]](https://www.rsc.org/images/entities/char_2009.gif) |
| Pd/SWCNT |
| Pd–C40 |
2.063 |
2.051 |
−0.60 |
2.003 |
−3.01 |
| Pd–C45 |
1.974 |
2.018 |
2.18 |
1.979 |
0.24 |
| Pd–C49 |
1.974 |
2.010 |
1.76 |
1.979 |
0.22 |
Table 2 Total energies, dipole moments, adsorption energies and some DFT descriptors for investigated moleculesa
| Complex |
Etot (eV) |
Dipole moment (D) |
Eads (in kJ mol−1) |
EHOMO (eV) |
ELUMO (eV) |
Eg (eV) |
η |
μ |
ω |
| η: chemical hardness, μ: chemical potential, ω: global electrophilicity index. |
| Phe |
−15090.177 |
2.074 |
— |
−6.356 |
−0.023 |
6.333 |
3.166 |
−3.189 |
1.606 |
| Pd/SWCNT |
−206203.011 |
2.169 |
— |
−4.154 |
−2.543 |
1.611 |
0.805 |
−3.349 |
6.963 |
| Complex 1 |
−221294.080 |
8.683 |
−86.080 |
−3.680 |
−2.329 |
1.351 |
0.676 |
−3.005 |
6.680 |
| Complex 2 |
−221294.092 |
3.333 |
−87.226 |
−4.116 |
−2.415 |
1.701 |
0.851 |
−3.265 |
6.268 |
3.2. DFT-based reactivity descriptors
An important criterion of chemical reactivity and stability is the absolute hardness, which is calculated form Frontier Molecular Orbital (FMO) energies. DFT calculations have been performed on open (5,5) Pd doped armchair SWCNT to investigate DFT-based reactivity descriptors. The HOMO–LUMO energy gap is the difference between the highest occupied molecular orbital (HOMO) and the lowest unoccupied molecular orbital (LUMO) of neutral systems.38 The HOMO–LUMO orbitals computed at B3LYP level with 6-311+G(d) basis set and generated via Gauss view 5.0, are shown in Fig. 3. The HOMO–LUMO energy gap decrease noticeably after the Phe adsorption. Larger frontier molecular orbital energy gap verifies the low chemical reactivity and high kinetic stability. Lower bond gap for Complex 1 represents the softer system with higher electrophilicity index. The electron flow between HOMO and LUMO decrease the energy which is a measure of electrophilicity index. The increase of HOMO–LUMO energy gap in Complex 2 results in a decrease of the conductance of this biosensor. Results are presented in Table 2.
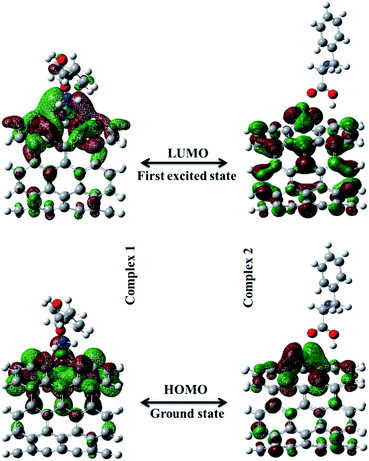 |
| | Fig. 3 The HOMO–LUMO orbitals computed at B3LYP level with 6-311+G(d) basis set for Complex 1 and Complex 2. | |
3.3. Quantum theory atom in molecule (QTAIM) analysis
QTAIM analysis were performed to get detailed information about the inter and intramolecular interactions.29,39–41 The sign of the Laplacian of electron density has been used to distinguish the closed-shell (non-covalent) interactions such as ionic and van der Waals and open shell (covalent) interactions.42,43 In the case of covalent interactions ρ(r) is of the order of 0.1 a.u. while for non-covalent interaction is of the order of 0.01 or even less. The electron densities ρ(r) for Complex 1 and 2 are 0.05 and 0.0519 and its Laplacian ∇2ρ(r) are 0.2138 and 0.2564 respectively, which lie between the covalent and non-covalent limits. Larger electronic density at Pd–O bond critical point in Complex 2 could be attributed to a stronger interaction. The positive values of Laplacian ∇2ρ(r) confirm the domination of kinetic energy and closed shell (non covalent) interactions between Pd/SWCNT and Phe molecule. DFT B3LYP method with 6-311+G(d) basis set was used for AIM calculations employing the AIM2000 package44
3.4. Natural bond orbital (NBO) analyses
An efficient method to investigate the conjugative interactions and the charge transfer in nanobiosensors is NBO analysis. The donor–acceptor interactions are evaluated from the second order perturbation energies, E(2). Intensive interactions between donor–acceptor result from larger value of E(2).45 Table 3 presents some important interactions by the energy threshold equal to 4 (kcal mol−1). The magnitude of the charge transfer from lone pair (1) of N to lone pair*(5) Pd is 24.53 kcal mol−1 in Complex 1 and lone pair (2) of O to lone pair*(7) Pd is 16.87 (kcal mol−1) in Complex 2 are the most important interactions. Results are presented in Table 3.
Table 3 Some important interactions by the energy threshold equal to 4 (kcal mol−1) for Complex 1 and Complex 2
| NBO Complex 1 |
NBO Complex 2 |
| Donor NBO |
Acceptor NBO |
E(2) kcal mol−1 |
Donor NBO |
Acceptor NBO |
E(2) kcal mol−1 |
| LP (1) N 108 |
LP*(5) Pd 70 |
24.53 |
LP (2) O 113 |
LP*(7) Pd 70 |
16.87 |
| LP (1) N 108 |
LP*(6) Pd 70 |
21.57 |
LP (2) O 113 |
LP*(5) Pd 70 |
11.98 |
| LP (1) N 108 |
σ*(1) C 49–Pd 70 |
9.37 |
LP (1) O 113 |
LP*(6) Pd 70 |
11.22 |
| σ N 108–H 110 |
LP*(6) Pd 70 |
6.30 |
LP (1) O 113 |
LP*(7) Pd 70 |
8.30 |
| σ N 108–H 109 |
LP*(6) Pd 70 |
5.29 |
LP (2) O 113 |
LP*(6) Pd 70 |
7.31 |
| LP*(6) Pd 70 |
σ*(1) N 108–H 109 |
3.12 |
LP (2) O 113 |
σ*(1) C 45–Pd 70 |
6.13 |
| |
|
|
LP (1) O 113 |
LP*(5) Pd 70 |
4.10 |
3.5. Molecular electrostatic potential (MPE) surface analysis
Electrostatic potential maps enable us to visualize the size, shape and charge distribution of nanobiosensors. Different colors represent the values of surface electrostatic potentials. The red color represents the most negative and the blue color corresponds to the most positive site. MPE surfaces for the investigated nanoreceptor over the optimized electronic structures using DFT/B3LYP method with 6-311+G(d) basis set are plotted in Fig. 4. The free carboxylic acid site in Complex 1 provides the most nucleophilic region (most positive site). The bluish green colors surrounded by the free amine site in Complex 2 are related to a less positive region.
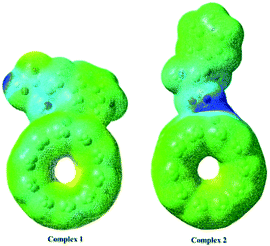 |
| | Fig. 4 MPE surfaces for the investigated nanoreceptor over the optimized electronic structures using DFT/B3LYP method with 6-311+G(d) basis set. | |
3.6. Electronic densities of state
The electronic densities of state (DOSs) were calculated for the Phe molecule, Pd/SWCNT, Complex 1 and 2. When Pd/SWCNT interacts with the Phe molecule, a large charge transfer from Phe to Pd/SWCNT occurs which changes the conductance of the nanotube. As shown in Fig. 5, the shape of the DOSs of Complex 1 and 2 under the Fermi level bear much similarity to Pd/SWCNT. Significant changes in DOSs occur near the Fermi level and a slightly right move happens to DOSs. A peak with high density appears in Complex 2 near the Fermi level, which indicates the conductivity of the system. Phe DOS shows a wide range band gap in the Fermi level.
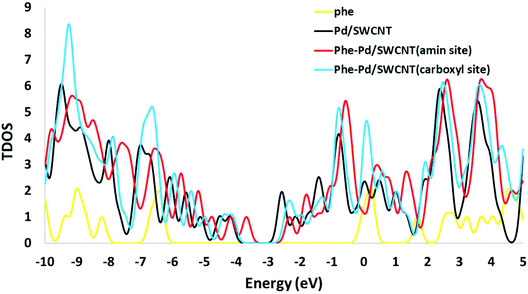 |
| | Fig. 5 The calculated density of states (DOS) for the Phe, Pd/SWCNT transducer and titled nanoreceptor (amine and carboxyle sites). | |
3.7. Solvent effects
Our ultimate goal of the design of the amino acids/functionalized single walled carbon nanotube matrix based biosensor is amino acid and protein detection for in vitro and in vivo medical diagnostics, so the solvent environment can affect the sensing performance. Because of the hydrophobic nature of SWCNT and Phe, they can be sequestered from the aqueous environment. Thus the investigation of indirect influence of polar and nonpolar solvents on the stabilizing active conformers of the biosensor seems to be crucial. As in the presence of the solvent, the electron density would be redistributed, full geometry optimized calculation was carried out at the DFT level by the B3LYP method using a 6-311+G(d) basis set which exhibits good performance on geometries and electron affinities of the compounds. The solvent effects were considered by employing the self-consistent reaction field (SCRF) method with the Tomasi's polarized continuum Model (PCM) in the default setting implemented in Gaussian program. In this method, the solute is placed in a cavity and the solvent is presented as a structureless homogeneous polarizable medium.
The solvent effects have been explored in two sections; structural and electronics. To complete the investigation of titled nanobiosensor, solvent environment was considered in a wide spectrum of dielectric constant, ε, that was selected ranging from 2.24 (CCl4) to 78.5 (water).
3.7.1. Solvent effects on the geometric structure. The geometry obtained in the gas phase study was utilized as the initial geometry and the full optimized geometry was performed using DFT/B3LYP/6-311+G(d) in combination with SCF-PCM method. By the absence of imaginary frequencies, all the geometries in different media were characterized to be the most stable point on the potential energy surface. The geometries of Phe/Pd/SWCNT in solutions are somewhat different from those in the gas phase. Though the changes of the geometrical parameters are quite small but in Complex 1 the interaction distance decreases with increasing solvent polarity (from carbon tetra chloride to acetone to ethanol to DMSO to water), while the interaction distance increases in Complex 2. The results of topological analysis show that the electronic densities at the interaction distances increase by decreasing the interaction distances. It is worth mentioning that the electronic charge is depleted in the intermolecular distance and ∇2ρ > 0. The adsorption energies decrease by increasing the solvent polarity. The corresponding results calculated by PCM and models at the same level are listed in Table 4.
Table 4 Geometrical parameters (in Å), topological parameters (in a.u.) and adsorption energies (in kJ mol−1) for Complex 1 and Complex 2 in different solvents
| Phe/PdSWCNT |
Complex 1 |
Complex 2 |
| Interaction distance |
ρ |
∇2ρ |
Eads (kJ mol−1) |
Interaction distance |
ρ |
∇2ρ |
Eads (kJ mol−1) |
| Water |
2.3338 |
0.05593 |
0.23137 |
−55.1117 |
2.3196 |
0.04557 |
0.22539 |
−44.4259 |
| DMSO |
2.3408 |
0.05504 |
0.22622 |
−55.8203 |
2.3192 |
0.04563 |
0.22578 |
−45.3940 |
| Ethanol |
2.3425 |
0.05482 |
0.22536 |
−56.5343 |
2.3185 |
0.04574 |
0.22643 |
−47.3730 |
| Acetone |
2.3431 |
0.05475 |
0.22458 |
−56.8380 |
2.3181 |
0.04580 |
0.22680 |
−48.1941 |
| CCl4 |
2.3616 |
0.05255 |
0.21505 |
−74.2398 |
2.3027 |
0.04783 |
0.24009 |
−71.5203 |
| Gas phase |
2.3654 |
0.05194 |
0.21376 |
−86.0795 |
2.2874 |
0.04965 |
0.25348 |
−87.2264 |
The dipole moments of the complexes in solutions increase gradually with the increasing of dielectric constants. The increasing inductive effect of the solvent polarity will increase the solute polarity. It is clear that the Phe with π electrons are more polarizable (more easily perturbed) and that may result in unfavorable dipole–dipole interactions.
From Table 5 it can be seen that the total energy of the complexes in solvents ET, are lower than that in the gas (solvent free) phase and shift to lower values with the increasing of electric permittivity of the solvents (calculated energy is dependent on the size of the dielectric constants of solvents). Phe molecule with electronegative atoms seems to be contributed in nonspecific attractive interactions with more polar solvent. The solvent influences the electronic structure of the complexes to a great extent and the energy level of them will be shifted due to the solvent–solute interactions (stabilization energy, Estab, the relative energy of the title compound in a solvent to that in the gas phase) which is a key physical property controlling electron transfer processes. It can be seen that the stabilization energy increases with the increase of the solvent electric permittivity and this suggests that the biosensor is stable in more molar solvents. Excellent correlation could be found between the stabilization energy and the dipole moment on the complexes in different media (R2 = 0.9973 and 0.9995 for Complex 1 and 2 respectively).
Table 5 Total energy (in eV), dipole moment (D) and stabilization energy (in kJ mol−1) for the investigated compounds in different solvents with different dielectric constant
| Phe/PdSWCNT |
Phe |
Pd/SWCNT |
Complex 1 |
Complex 2 |
| Water (ε = 78.54) |
| Total energy (Etot, eV) |
−15096.037 |
−206279.805 |
−221376.413 |
−221376.304 |
| Dipole moment (D) |
2.439 |
9.036 |
14.389 |
7.112 |
| Estab (kJ mol−1) |
−30.158 |
−94.947 |
−94.138 |
−82.305 |
![[thin space (1/6-em)]](https://www.rsc.org/images/entities/char_2009.gif) |
| DMSO (ε = 46.7) |
| Total energy (Etot, eV) |
−15096.032 |
−206279.780 |
−221376.391 |
−221376.283 |
| Dipole moment (D) |
2.428 |
8.829 |
14.096 |
6.987 |
| Estab (kJ mol−1) |
−29.653 |
−92.529 |
−91.923 |
−80.349 |
![[thin space (1/6-em)]](https://www.rsc.org/images/entities/char_2009.gif) |
| Ethanol (ε = 24.55) |
| Total energy (Etot, eV) |
−15096.021 |
−206279.728 |
−221376.337 |
−221376.242 |
| Dipole moment (D) |
2.408 |
8.404 |
13.748 |
6.736 |
| Estab (kJ mol−1) |
−28.571 |
−87.636 |
−86.662 |
−76.354 |
![[thin space (1/6-em)]](https://www.rsc.org/images/entities/char_2009.gif) |
| Acetone (ε = 20.7) |
|
|
|
|
| Total energy (Etot, eV) |
−15096.015 |
−206279.709 |
−221376.313 |
−221376.223 |
| Dipole moment (D) |
2.398 |
8.2326 |
13.6040 |
6.632 |
| Estab (kJ mol−1) |
−28.095 |
−85.595 |
−84.448 |
−74.658 |
![[thin space (1/6-em)]](https://www.rsc.org/images/entities/char_2009.gif) |
| CCl4 (ε = 2.24) |
| Total energy (Etot, eV) |
−15095.852 |
−206279.149 |
−221375.768 |
−221375.741 |
| Dipole moment (D) |
2.249 |
4.017 |
10.523 |
4.175 |
| Estab (kJ mol−1) |
−12.189 |
−31.503 |
−31.853 |
−27.986 |
3.7.2. Solvent effects on the electronic properties. To investigate the change of electronic properties of Phe/Pd/SWCNT in various media, three different analyses were performed: molecular orbital, NBO and DOS analysis. Frontier molecular orbitals which predict the molecular interactions play an important role in the electronic properties of biosensors. We can find that the energies of the lowest unoccupied molecular orbital (ELUMO) and the highest occupied molecular orbital (EHOMO) both decrease with the increase in solvent dielectric constants. In addition, the analysis of the molecular orbitals can provide much useful information about the chemical reactivity and stability. The energy gaps (Eg) between the EHOMO and ELUMO, which characterize the molecular chemical stability, in Complex 2 decrease with the increase in dielectric constants but an inverse trend was found in the Complex 1. The higher energy gap in DMSO polar aprotic solvent explains that the charge transfer interaction in the Complex 1 is more favourable than that of water polar protic solvent. The conceptual DFT based reactivity and stability descriptors have also been reported in Table 6. The electronic chemical potential decreases with the increase in dielectric constants. As it can be seen, the grater electronic chemical potential, the less stable and more reactive is the Complex 1 in the solvents. Results show that the Complex 2 is more stable in a nonpolar solvent. Electrophilicity index value, which is the measure of the stabilization energy after the electron acceptance in the solvent media, increases with the increase in solvent dielectric. The NBO results (see Table 7) demonstrate that the interacting stabilization energies of the more intensive interactions between electron antibonding of proton donors and the lone pairs of proton acceptors in Complex 1 are increasing by increasing the solvent dielectric constant. In NBO analysis of Complex 2, the charge transfer between the lone pair of oxygen atom and the lone pair* of Pd atom and σ* C49–Pd are most significant and interaction energies decrease by increasing the solvent dielectric constant. The calculated density of states (DOS) for the titled nanoreceptor is shown in Fig. 6. The solvent dielectric constant doesn't influence mainly the electronic states near the Fermi level but a slightly right move happens to the DOS of the complexes in more polar solvents.
Table 6 Molecular orbital analysis for Complex 1 and Complex 2 in different solvents with different dielectric constants
| Complex 1 |
| Molecular parameters (eV) |
Water |
DMSO |
Ethanol |
Acetone |
CCl4 |
| EHOMO |
−3.896 |
−3.890 |
−3.875 |
−3.870 |
−3.736 |
| ELUMO |
−2.452 |
−2.444 |
−2.434 |
−2.430 |
−2.357 |
| Egap |
1.445 |
1.446 |
1.442 |
1.440 |
1.380 |
| Chemical potential (μ) |
−3.174 |
−3.167 |
−3.155 |
−3.150 |
−3.046 |
| Chemical hardness (η) |
0.722 |
0.723 |
0.721 |
0.720 |
0.690 |
| Global electrophilicity index (ω) |
6.974 |
6.934 |
6.901 |
6.890 |
6.727 |
| Complex 2 |
| Molecular parameters (eV) |
Water |
DMSO |
Ethanol |
Acetone |
CCl4 |
| EHOMO |
−4.190 |
−4.184 |
−4.175 |
−4.172 |
−4.125 |
| ELUMO |
−2.491 |
−2.484 |
−2.473 |
−2.469 |
−2.419 |
| Egap |
1.699 |
1.700 |
1.702 |
1.703 |
1.706 |
| Chemical potential (μ) |
−3.340 |
−3.334 |
−3.324 |
−3.320 |
−3.272 |
| Chemical hardness (η) |
0.849 |
0.850 |
0.851 |
0.851 |
0.853 |
| Global electrophilicity index (ω) |
6.569 |
6.540 |
6.492 |
6.474 |
6.274 |
Table 7 Some important interactions by the energy threshold = 4 (kcal mol−1) for Complex 1 and Complex 2 in different solvents with different dielectric constants
| |
NBO donor |
NBO acceptor |
Water |
DMSO |
Ethanol |
Acetone |
CCl4 |
| Complex 1 |
σ C 103–N 108 |
LP*(4) Pd 70 |
3.13 |
2.8 |
2.77 |
2.75 |
2.02 |
| σ N 108–H 109 |
LP*(4) Pd 70 |
6.08 |
5.75 |
5.72 |
5.72 |
5.41 |
| σ N 108–H 110 |
LP*(4) Pd 70 |
7.89 |
7.62 |
7.59 |
7.58 |
6.38 |
| LP (1) N 108 |
LP*(4) Pd 70 |
34.36 |
32.96 |
32.93 |
32.92 |
22.33 |
| LP (1) N 108 |
σ* C 40–Pd 70 |
14.53 |
14.5 |
14.41 |
14.38 |
10.07 |
| Complex 2 |
σ C 106–O 113 |
LP*(4) Pd 70 |
3.54 |
3.55 |
3.54 |
3.54 |
2.71 |
| LP (1) O 113 |
LP*(4) Pd 70 |
23.34 |
23.31 |
23.22 |
23.22 |
16.2 |
| LP (2) O 113 |
LP*(4) Pd 70 |
22.55 |
22.56 |
22.56 |
22.56 |
13.53 |
| LP (2) O 113 |
LP*(5) Pd 70 |
2.48 |
2.62 |
2.93 |
3.08 |
2.42 |
| LP (2) O 113 |
σ* C 49–Pd 70 |
9.65 |
9.66 |
9.67 |
9.68 |
6.28 |
| LP (3) O 113 |
LP*(6) Pd 70 |
2.21 |
2.21 |
2.21 |
2.21 |
2.09 |
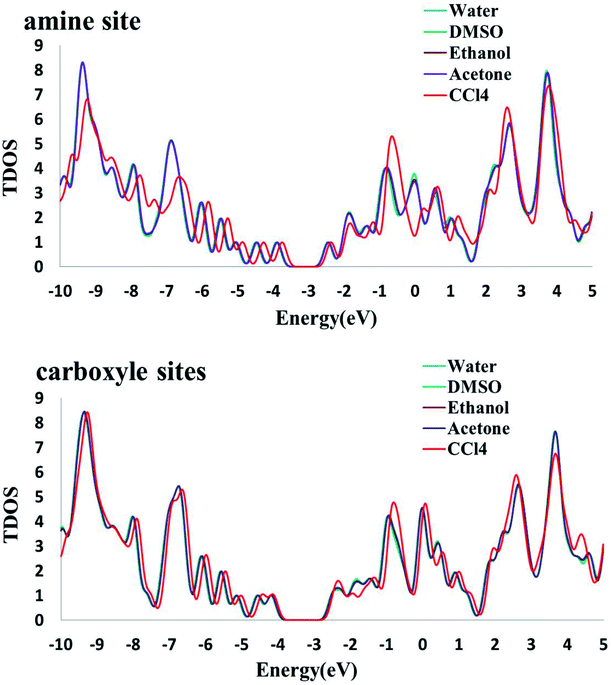 |
| | Fig. 6 The calculated density of states (DOS) for the titled nanoreceptor (amine and carboxyl sites) in different solvents. | |
3.8. Docking study results
To gain deep insight into the recognition and binding between HSA and Phe–Pd/SWCNT, molecular docking was performed. Phe–Pd/SWCNT was blindly docked into the crystal structures of HSA. Previous studies have revealed that there are two primary binding sites (i.e., site I and site II) located in the subdomains IIA and IIIA of HSA. The binding affinity offered by site I is mainly through hydrophobic interactions, whereas site II involves a combination of hydrophobic, hydrogen bonding, and electrostatic interactions.46–48 Extensive crystallographic studies identified additional drug binding sites across the molecule, many of which are likely to be the secondary binding pockets that get occupied at high ligand concentrations.49 As depicted in Fig. 7, Phe–Pd/SWCNT could bind on subdomain IIA and IB with a free energy of binding −10.5 kcal mol−1 and inhibition constant of the biosensor–HSA complex 42.75. The binding at domain IB has been predicted to be energetically as favourable as the binding to domain IIA, although subdomain IIA was more likely the major binding site of Phe–Pd/SWCNT on HSA.
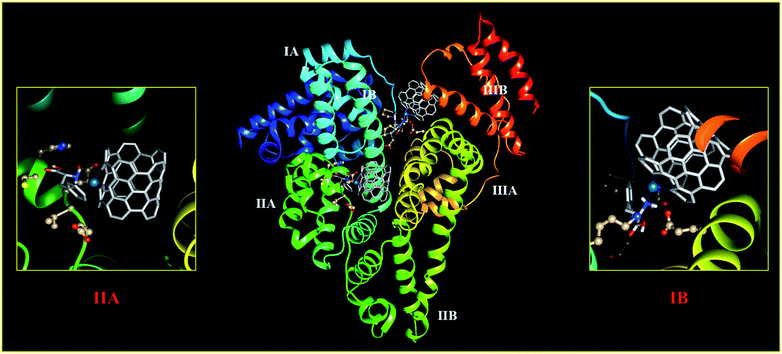 |
| | Fig. 7 Molecular docked model of the interaction mode between Phe–Pd/SWCNT (showing stick representation) and HSA (cartoon form). | |
The best orientations obtained with Autodock for the purposed biosensor for the primary drug binding site (domain IIA) and IB of BSA are shown in Fig. 8 (the structures and energies of the docked conformations are presented in ESI†). From this figure, it can be seen that Phe–Pd/SWCNT occupies the upper pocket of the drug binding site of IIA (Fig. 8A), and it is in close contact (hydrophobic interaction) with Glu294, His288 and Cys289; this binding is also supported by one hydrogen bond (Glu292). In contrast, Phe–Pd/SWCNT binds to a part of IB (Fig. 8B), and its interaction with Asn100, Pro110 and Asp108 on the surface is weak, with two hydrogen bonds seen between Phe–Pd/SWCNT and the drug binding site of HSA (Lys190, Glu425). Hydrogen bonding parameters are presented in ESI.†
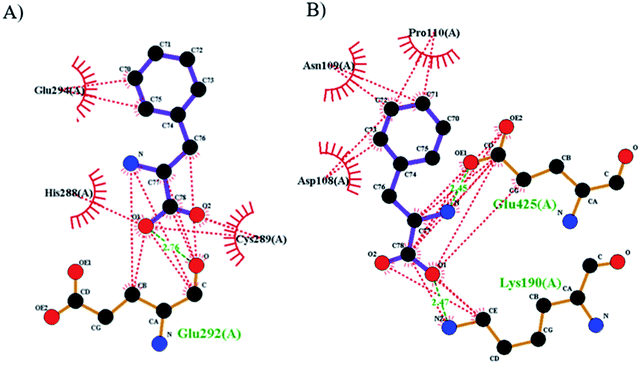 |
| | Fig. 8 The two-dimensional schematics representation of the hydrogen bond and hydrophobic interactions between the phenylalanine amino acid of the Pd/SWCNT and HSA (dashed lines hydrogen bonds, spiked residues form hydrophobic interactions with valsartan), (A) bonded on subdomain IIA and (B) on IB. | |
4. Conclusions
Early detection of proteins could help to reduce the disease progress. Phe amino acid hybrid with the Pd/SWCNT supporting enhanced transducer provides a high sensitive biocompatible bioelectrode in nanobiosensors for use in early disease diagnosis. The carboxylic acid active groups of the titled nanobiosensor could incorporate in the peptide bonding with the free amine groups on the surface of the proteins. Molecular geometry, topological parameters, HOMO and LUMO energy, AIM, NBO, MPES and DFT based chemical reactivity descriptors were employed to thoroughly analyze a new novel nanobiosensor of Phe/PdSWCNT hybrid by the use of DFT/B3LYP method with 6-311+G(d) basis set. The adsorption of Phe molecule on the Pd/SWCNT via the amine and carboxylic acid site has been studied. The strength of chemisorbed carboxylic site is slightly higher than the other. AIM analysis reveals the nearly non-covalent intermolecular interaction. The strong adsorption of Phe on the Pd/SWCNT leads to changes in the HOMO–LUMO gap of the nanobiosensor components. It is observed that the adsorption energies decrease by increasing the solvent polarity and the increasing inductive effect of the solvent polarity will increase the solute polarity. Moreover the stabilization energy increases with the increasing the solvent electric permittivity and this suggests that the biosensor is stable in more molar solvents. As result, Phe–Pd/SWCNT could be purposed as a biocompatible biosensor with high chemical stability.
Conflicts of interest
There are no conflicts to declare.
Acknowledgements
The authors wish to thank Graduate University of Advanced Technology, Kerman, Iran, CONICET-PIP 11220130100436CO, PICT-2016-4085 and SGCyT-UNS, for their support.
References
- T. E. Creighton, Proteins: structures and molecular properties, Macmillan, 1993 Search PubMed.
- R. Garrett and C. Grisham, Biochemistry, Saunders College Publishing, New York, NY, USA, 1999 Search PubMed.
- L. C. Clark and C. Lyons, Ann. N. Y. Acad. Sci., 1962, 102, 29–45 CrossRef CAS PubMed.
- Y. Wang, P. P. Joshi, K. L. Hobbs, M. B. Johnson and D. W. Schmidtke, Langmuir, 2006, 22, 9776–9783 CrossRef CAS PubMed.
- J. Wang, Electroanalysis, 2005, 17, 7–14 CrossRef CAS.
- W. C. Poh, K. P. Loh, W. D. Zhang, S. Triparthy, J.-S. Ye and F.-S. Sheu, Langmuir, 2004, 20, 5484–5492 CrossRef CAS PubMed.
- C. Hu and S. Hu, Langmuir, 2008, 24, 8890–8897 CrossRef CAS PubMed.
- K. Balasubramanian and M. Burghard, Anal. Bioanal. Chem., 2006, 385, 452–468 CrossRef CAS PubMed.
- J. Hannon, A. Afzali, C. Klinke and P. Avouris, Langmuir, 2005, 21, 8569–8571 CrossRef CAS PubMed.
- D. S. Rawat, L. Heroux, V. Krungleviciute and A. D. Migone, Langmuir, 2006, 22, 234–238 CrossRef CAS PubMed.
- S. Iijima, Nature, 1991, 354, 56–58 CrossRef CAS.
- H. Dai, A. Javey, E. Pop, D. Mann, W. Kim and Y. Lu, Nano, 2006, 1, 1–13 CrossRef CAS.
- M. R. LaBrosse, W. Shi and J. K. Johnson, Langmuir, 2008, 24, 9430–9439 CrossRef CAS PubMed.
- G. Arora, N. J. Wagner and S. I. Sandler, Langmuir, 2004, 20, 6268–6277 CrossRef CAS PubMed.
- M. Yoosefian and N. Etminan, RSC Adv., 2015, 5, 31172–31178 RSC.
- E. Mirhaji and M. Yoosefian, J. Mol. Liq., 2017, 246, 124–130 CrossRef CAS.
- M. Yoosefian and N. Etminan, Phys. E Low-dimens. Syst. Nanostruct., 2016, 81, 116–121 CrossRef CAS.
- C. Rajesh, C. Majumder, H. Mizuseki and Y. Kawazoe, J. Chem. Phys., 2009, 130, 124911 CrossRef PubMed.
- M. Shim, A. Javey, N. W. Shi Kam and H. Dai, J. Am. Chem. Soc., 2001, 123, 11512–11513 CrossRef CAS PubMed.
- W. F. Keane and G. Eknoyan, Am. J. Kidney Dis., 1999, 33, 1004–1010 CrossRef CAS PubMed.
- F. C. Ballantyne, J. Gibbons and D. S. O'Reilly, Ann. Clin. Biochem., 1993, 30, 101–103 CrossRef PubMed.
- P. A. Peterson, P.-E. Evrin and I. Berggård, J. Clin. Invest., 1969, 48, 1189–1198 CrossRef CAS PubMed.
- W. G. Miller, D. E. Bruns, G. L. Hortin, S. Sandberg, K. M. Aakre, M. J. McQueen, Y. Itoh, J. C. Lieske, D. W. Seccombe and G. Jones, Clin. Chem., 2009, 55, 24–38 CrossRef CAS PubMed.
- X. M. He and D. C. Carter, Nature, 1992, 358, 209 CrossRef CAS PubMed.
- S. Curry, H. Mandelkow, P. Brick and N. Franks, Nat. Struct. Mol. Biol., 1998, 5, 827 CrossRef CAS PubMed.
- I. Petitpas, T. Grüne, A. A. Bhattacharya and S. Curry, J. Mol. Biol., 2001, 314, 955–960 CrossRef CAS PubMed.
- M. Frisch, G. Trucks, H. Schlegel, G. Scuseria, M. Robb, J. Cheeseman, G. Scalmani, V. Barone, B. Mennucci and G. Petersson, Gaussian Inc., Wallingford CT, 2010.
- A. D. Becke, J. Chem. Phys., 1993, 98, 5648–5652 CrossRef CAS.
- O. B. Ol'ha, I. S. Voiteshenko, H. Pérez-Sánchez and D. M. Hovorun, New J. Chem., 2017, 41, 7232–7243 RSC.
- H. Raissi, M. Yoosefian, A. Hajizadeh, M. Karimi and F. Farzad, Bull. Chem. Soc. Jpn., 2012, 85, 87–92 CrossRef CAS.
- O. B. Ol’ha, R. O. Zhurakivsky and D. M. Hovorun, J. Mol. Model., 2013, 19, 4119–4137 CrossRef PubMed.
- H. Raissi, A. Jalbout, M. Yoosefian, M. Fazli, A. Nowroozi, M. Shahinin and A. De Leon, Int. J. Quantum Chem., 2010, 110, 821–830 CAS.
- T. Koopmans, Physica, 1934, 1, 104–113 CrossRef.
- R. G. Parr, L. v. Szentpaly and S. Liu, J. Am. Chem. Soc., 1999, 121, 1922–1924 CrossRef CAS.
- D. A. Gschwend, A. C. Good and I. D. Kuntz, J. Mol. Recognit., 1996, 9, 175–186 CrossRef CAS PubMed.
- G. M. Morris, D. S. Goodsell, R. S. Halliday, R. Huey, W. E. Hart, R. K. Belew and A. J. Olson, J. Comput. Chem., 1998, 19, 1639–1662 CrossRef CAS.
- G. M. Morris, R. Huey, W. Lindstrom, M. F. Sanner, R. K. Belew, D. S. Goodsell and A. J. Olson, J. Comput. Chem., 2009, 30, 2785–2791 CrossRef CAS PubMed.
- K. Fukui, Science, 1982, 218, 747–754 CrossRef CAS PubMed.
- M. Yoosefian and A. Mola, J. Mol. Liq., 2015, 209, 526–530 CrossRef CAS.
- H. Raissi, M. Yoosefian, F. Mollania and S. Khoshkhou, Struct. Chem., 2013, 24, 123–137 CrossRef CAS.
- O. H. O. Brovarets’ and D. M. Hovorun, J. Biomol. Struct. Dyn., 2018, 1–28 Search PubMed.
- M. Marín-Luna, I. Alkorta and J. Elguero, Comput. Theor. Chem., 2016, 1076, 101–108 CrossRef.
- M. Yoosefian, N. Etminan, M. Z. Moghani, S. Mirzaei and S. Abbasi, Superlattices Microstruct., 2016, 98, 325–331 CrossRef CAS.
- F. Biegler-Konig, J. Schonbohm, R. Derdau, D. Bayles and R. Bader, AIM 2000, version 1, Bielefeld, Germany, 2000 Search PubMed.
- H. Raissi, M. Yoosefian and F. Mollania, Comput. Theor. Chem., 2012, 996, 68–75 CrossRef CAS.
- J. Ghuman, P. A. Zunszain, I. Petitpas, A. A. Bhattacharya, M. Otagiri and S. Curry, J. Mol. Biol., 2005, 353, 38–52 CrossRef CAS PubMed.
- M. Fasano, S. Curry, E. Terreno, M. Galliano, G. Fanali, P. Narciso, S. Notari and P. Ascenzi, IUBMB Life, 2005, 57, 787–796 CrossRef CAS PubMed.
- S. Curry, Drug Metab. Pharmacokinet., 2009, 24, 342–357 CrossRef CAS PubMed.
- A. J. Ryan, J. Ghuman, P. A. Zunszain, C.-w. Chung and S. Curry, J. Struct. Biol., 2011, 174, 84–91 CrossRef CAS PubMed.
Footnote |
| † Electronic supplementary information (ESI) available. See DOI: 10.1039/c9ra09243a |
|
| This journal is © The Royal Society of Chemistry 2020 |
Click here to see how this site uses Cookies. View our privacy policy here.  Open Access Article
 c and
Elnaz Mirhajia


![[thin space (1/6-em)]](https://www.rsc.org/images/entities/char_2009.gif)


![[thin space (1/6-em)]](https://www.rsc.org/images/entities/char_2009.gif)
![[thin space (1/6-em)]](https://www.rsc.org/images/entities/char_2009.gif)
![[thin space (1/6-em)]](https://www.rsc.org/images/entities/char_2009.gif)
![[thin space (1/6-em)]](https://www.rsc.org/images/entities/char_2009.gif)


