DOI:
10.1039/C9RA09253F
(Paper)
RSC Adv., 2020,
10, 43-52
The efficient degradation of organic pollutants in an aqueous environment under visible light irradiation by persulfate catalytically activated with kaolin-Fe2O3
Received
7th November 2019
, Accepted 9th December 2019
First published on 23rd December 2019
Abstract
In recent years, persulfate (PS) has been widely studied as a promising oxidant. In this work, a new K-Fe2O3 catalyst was synthesized via a facile impregnation method. K-Fe2O3 samples were utilized as heterogeneous photocatalysts for the degradation of aquatic organic pollutants (rhodamine, RhB, and ciprofloxacin, CIP). The catalysts showed excellent catalytic activity in the presence of PS under the irradiation of visible light, owing to the generation of SO4˙− and ·OH active radicals. The degradation ratio and COD removal ratio for RhB were 99.8% and 88.3%. More importantly, the system retained a high degradation activity for RhB within a wide operating pH range of 2.9–10. The results of cycling degradation experiments confirmed that the K-Fe2O3 catalyst was stable and recoverable. Large-scale experiments for treating dye wastewater under irradiation by natural sunlight were carried out, showing that this study can provide a new perspective for the treatment of wastewater.
1. Introduction
As a new type of advanced oxidation process (AOP), the activation of persulfate (PS) has recently gained more interest, and it has been used to treat dyes and toxic substances in wastewater thanks to its easy operation, high reactivity and low cost.1–5 Heat,6 UV light irradiation,7 microwaves,8 and transition-metal ions9 have been applied to enhance the production of oxidizing species (sulfate radical, SO4˙−). Iron ions have widely been used in the system of activation for persulfate due to their non-toxicity and environmental friendliness. Therefore, the addition of iron ions is most common during the activation reaction, which is very similar to the Fenton reaction, so some researchers also call it a Fenton-like reaction.10 Many researchers have found that a system composed of ferric ions and PS had high photocatalytic activity. The Fe2+/PS system can catalyze PS to produce SO4˙−, and SO4˙− has a higher redox potential than most other free radicals (E0 = 2.5–3.1 V), as shown in eqn (1).11 Then, OH˙ is formed after further reaction (eqn (2) and (3)).12 Therefore, the Fe2+/PS system exhibited a capability for the oxidative removal of organic pollutants.13| | |
S2O82− + Fe2+ → SO42− + SO4˙− + Fe3+
| (1) |
| | |
SO4˙− + H2O → SO42− + OH˙ + H+
| (2) |
| | |
SO4˙− + OH− → SO42− + OH˙
| (3) |
However, it is generally known that hydrogen peroxide needs to be added continuously, and the pH requirements are strict (the optimal pH range is only 2–4) for the traditional Fenton system.14–16 As a comparison, PS is added to the system instead of hydrogen peroxide, and PS can exist in a water environment for a longer time.17 Generally speaking, the pH application range is wider in the system of activation of persulfate. Moreover, the reaction between S2O82− and Fe2+ is too rapid to control, which could lead to the result that excess ferrous ions and SO4˙− in the solution react quickly within a short time. Some of the SO4˙− radicals in the system are consumed, which leads to a decrease in the utilization of SO4˙− (eqn (4)).18 Ferric ions are prone to precipitation under alkaline conditions, resulting in secondary pollution. In recent years, heterogeneous catalysts have attracted the attention of researchers, and can overcome the shortcomings mentioned above.19–21 Clays have been used as catalyst carriers because of their high surface area and rich reserves.22 A large number of studies have been carried out to use modified clay as a photo-Fenton catalyst for the degradation of pollutants.23,24 However, iron-pillared clay as a heterogeneous catalyst activated S2O82− for the degradation of organic dyes under visible light irradiation has hardly been explored.
| | |
SO4˙− + Fe2+ → SO42− + Fe3+
| (4) |
Herein, we successfully fabricated Fe2O3 pillared kaolin photocatalysts, which displayed superior oxygen activation ability for the degradation of rhodamine B (RhB) and antibiotic ciprofloxacin (CIP) in the presence of PS. The optimal reaction conditions of the system were studied, including catalyst dosage, PS concentration, RhB concentration, pH and inorganic anions. The inhibition effects of inorganic anions on the system were also observed. An environmental model application experiment using Fe2O3 pillared kaolin was carried out. Furthermore, a cycling experiment confirmed that the catalyst has excellent stability. A reaction mechanism for the system was proposed based on the experimental results of free radical capture.
2. Experimental
2.1. Chemicals
Ferric nitrate (Fe(NO3)3·9H2O), sodium chloride (NaCl), sodium carbonate (Na2CO3) hydrochloric acid (HCl), potassium persulfate (K2O8S2), sodium hydroxide (NaOH), isopropanol (IPA, C3H8O), methanol (MeOH, CH3OH), ethanol (C2H6O), p-benzoquinone (BQ, C6H4O2), kaolin (Al2O3·2SiO2·2H2O), and ciprofloxacin (CIP, C17H19ClFN3O3) of analytical grade, were purchased from Sinopharm Chemical Reagent Co. Ltd. Rhodamine B (RhB, C28H31ClN2O3), methyl orange (MO, C14H14N3NaO3S), and methylene blue (MB, C16H18N3S·Cl) were obtained from the market. In all the experiments, all solutions were prepared with deionized water.
2.2. Synthesis
In a typical procedure, first, 8.05 g of Fe(NO3)3·9H2O and 1.06 g of Na2CO3 respectively were added to 100 mL of water under stirring, and the solutions were labelled A and B. Solution A was added dropwise to solution B. Secondly, the mixed solution was aged at room temperature for 24 h, and was labelled solution C (brown). 100 mL of solution C was added dropwise to Na-modified kaolin (a mixture of kaolin and 3 wt% NaCl) and stirred continuously at 60 °C for 2 h, and then allowed to stand at 65 °C for 12 h. Thirdly, the solid powder was washed with water and ethanol three times each. Fourthly, the obtained dark brown product was dried in an oven at 60 °C for 6 hours. Finally, the catalyst was further calcined at 400 °C for 3 hours in air and denoted as K-Fe2O3.
2.3. Characterization
The phase of the catalyst was determined by X-ray diffraction (XRD, D8-Advance, Bruker, Germany) with a diffraction angle from 5° to 70°. The morphologies and microstructures of the samples were observed by scanning electron microscopy (SEM, Zeiss Sigma) and high-resolution transmission electron microscopy (HRTEM, FEI Tecnai G2 f20 s-twin 200 kV). X-ray photoelectron spectroscopy (XPS, K-Alpha model by Thermo Fisher Scientific) analysis was performed, and all binding energies were calibrated with the binding energy of C 1s as reference. The specific surface areas of the samples were measured with a gas sorption analyzer Autosorb-iQ instrument. Fourier transform infrared (FT-IR) spectroscopy (Shimadzu FTIR-8400, Japan) was used to detect the change in chemical bonds of the catalyst before and after utilization.
2.4. Degradation experiments
The photocatalytic performance of the K-Fe2O3 catalyst was evaluated by the degradation of RhB in water, using an LED lamp (λ = 420 nm, 300 W) as light source. 0.5 g L−1 of the K-Fe2O3 catalyst, 8 mM of K2O8S2 and 10 mg L−1 of RhB aqueous solution (100 mL) were added to a 250 mL glass beaker under stirring at 25 °C. 5 mL of the suspension was taken from the tubes at predetermined time intervals and then centrifuged. Lastly, the concentration of RhB was analyzed using a UV-vis spectrophotometer (UV-1240, Shimadzu Corporation, Japan) at the maximum absorption wavelength of 554 nm.
3. Results and discussion
3.1. Characterization and properties of catalysts
As shown in Fig. 1a, the phase and purity of the as-prepared samples were investigated by XRD analysis. Most of characteristic peaks agreed well with the standard card for kaolin (JCPDS: 25-0021). In addition, the diffraction peaks at 2θ = 33.1° and 35.6° corresponded to the (104) and (110) planes of Fe2O3 (JCPDS: 33-0664), respectively. This implied that the introduction of Fe2O3 did not change the main structure of kaolin. Moreover, the morphology of the catalyst can be clearly observed by SEM analysis. Fig. 1b and d displays the SEM images of kaolin and K-Fe2O3. We can see that all the catalyst samples had a layered structure and a lot of amorphous Fe2O3 could be observed on the surface of the kaolin.25 Therefore, the adsorption capacity of the modified catalyst has been greatly improved.26 The results from XRD and SEM analyses of the samples suggest that the K-Fe2O3 catalyst has been successfully synthesized. Nitrogen adsorption–desorption isotherms of the as-prepared K-Fe2O3 are shown in Fig. 1c. The inset of Fig. 1c shows the pore size distribution of the samples. We can see that the range of the main pore size distribution was 5–15 nm. The BET surface areas of the kaolin and K-Fe2O3 catalyst were 11.818 and 27.715 m2 g−1. Remarkably, the surface area substantially increased after pillaring, which was consistent with the result of SEM.
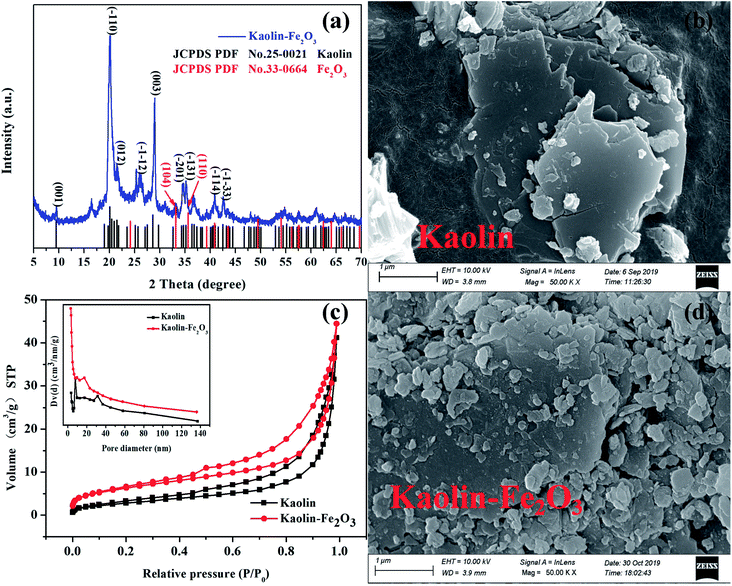 |
| | Fig. 1 (a) The XRD pattern of as-prepared K-Fe2O3, (c) N2 adsorption–desorption isotherms and the pore size distribution curve (inset) for K-Fe2O3 and (b and d) SEM images of kaolin and K-Fe2O3. | |
To further verify the chemical constitution of K-Fe2O3, the EDX elemental mapping images and the HRTEM image of K-Fe2O3 are shown in Fig. 2 and 3. As we know, there are only three elements in kaolin: Si, Al and O (Al2O3·2SiO2). However, a homogeneous distribution of Fe, Si, Al and O can be found in the as-prepared samples. Moreover, many clear lattice fringes are displayed in the HRTEM image of K-Fe2O3. The widths of these lattice fringe spacings were measured by using the corresponding tools. Lattice fringe spacings of 0.25 nm correspond to the (110) crystal plane of Fe2O3, which is consistent with the result from XRD. These results indicate that the Fe2O3 particles were successfully incorporated into the inside of the kaolin.
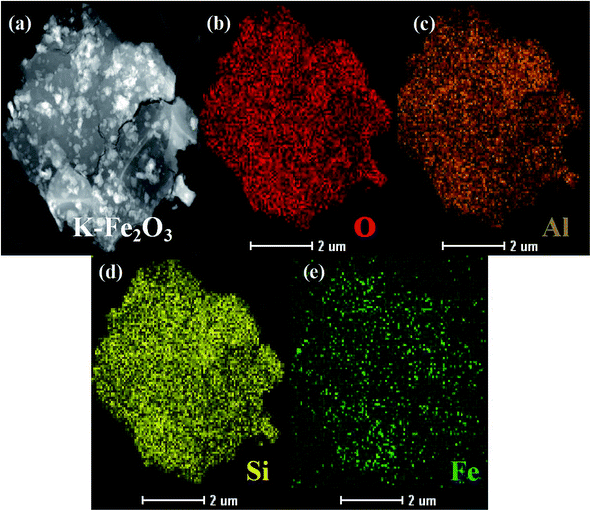 |
| | Fig. 2 (a–e) EDX elemental mapping images of K-Fe2O3. | |
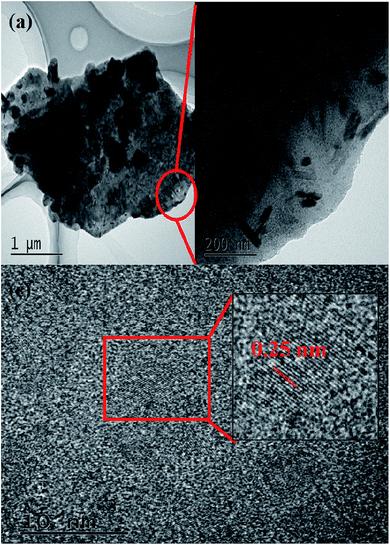 |
| | Fig. 3 (a and b) TEM images and (c) a HRTEM image of K-Fe2O3. | |
XPS analysis was investigated to further study the chemical composition of the catalyst. As presented in Fig. 4a, the XPS survey spectrum showed that O, Al, Si, and Fe elements were present in K-Fe2O3 (the C element came from the carbon source in the instrument). Fig. 4b shows the XPS spectra of Fe 2p. The peaks appearing at 711 eV, 714.6, 724.6 and 727.5 eV correspond to Fe 2p3/2 and Fe 2p1/2 in Fig. 4b, and are assignable to Fe3+. The satellite peak at 718.8 eV is characteristic of Fe3+, suggesting that the Fe in the as-prepared samples is mostly Fe3+.27 Moreover, the XPS spectrum of the Fe 2p peak for pure Fe2O3 is shown in Fig. 4b, where it is found that the characteristic peaks of Fe 2p agree well with the K-Fe2O3 samples. The results of XPS confirmed that Fe2O3 existed in the as-prepared samples.
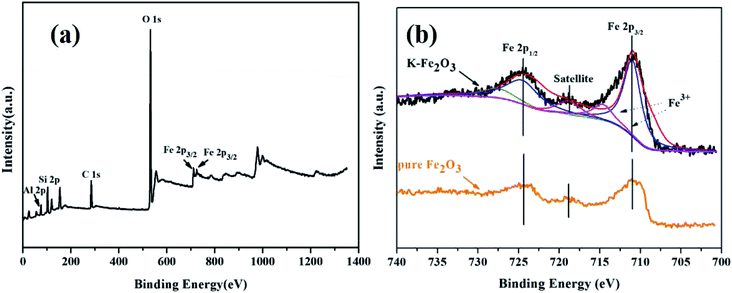 |
| | Fig. 4 XPS spectra: (a) survey spectrum of K-Fe2O3 and (b) Fe 2p spectra of K-Fe2O3 and pure Fe2O3. | |
3.2. Degradation of organic pollutants by K-Fe2O3
3.2.1. Photo-Fenton degradation of RhB. The effects of visible light and PS on the photocatalytic performance of K-Fe2O3 under different comparative conditions were studied. The results of the degradation of RhB are presented in Fig. 5a. Firstly, in the RhB/visible light system (curve I), there was almost no degradation effect. This shows that the photolysis ability of RhB is very weak. In the RhB/K-Fe2O3/darkness system (curve II), the degradation ratio of RhB was only 8% within 60 min, indicating that the K-Fe2O3 catalyst had a weak adsorption capacity. More obvious discoloration phenomena appeared in the RhB aqueous solution after extra addition of PS (curve VI). Moreover, in the RhB/K-Fe2O3/PS/visible light system (curve VII), the degradation ratio of RhB increased to 99.8%. Next, in the RhB/K-Fe2O3/visible light system (curve IV), a 42.8% degradation ratio of RhB was observed. The results of curve VII and curve IV show that the addition of PS was crucial to changing the photocatalytic activity of K-Fe2O3. Finally, as shown in curve V, without the K-Fe2O3 catalyst, the degradation ratio of RhB (54.7%) was slightly higher than that of curve IV. This was because S2O82− could oxidize some RhB molecules into degraded products under visible light irradiation. Fig. 5b shows that the degradation curves of the different reaction systems followed a first-order kinetics model, and the reaction kinetic constant (k) in curve VII was more than 3.5 times higher than that of the other all curves. The results of the controlled experiments showed that the catalyst, PS and visible light all played an important role in the above system.
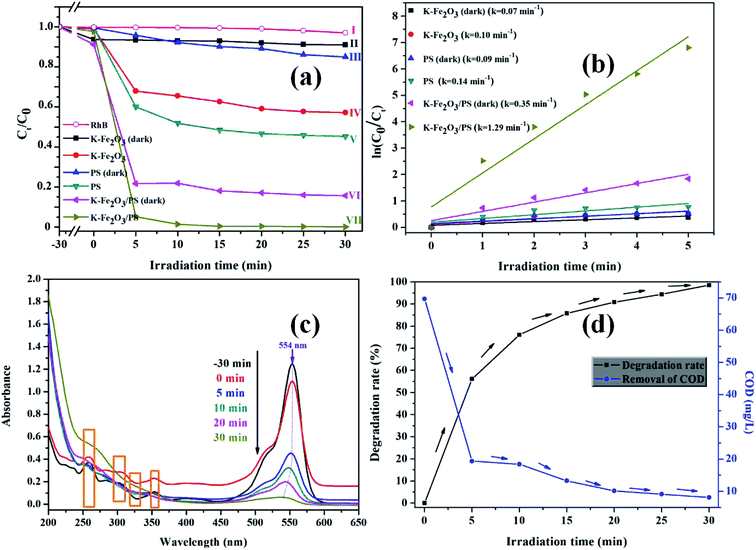 |
| | Fig. 5 (a) Photocatalytic degradation activity curves for RhB under different conditions: (I) RhB/visible light; (II) RhB/K-Fe2O3/darkness; (III) RhB/PS/darkness; (IV) RhB/K-Fe2O3/visible light; (V) RhB/PS/visible light; (VI) RhB/K-Fe2O3/PS/darkness, (VII) RhB/K-Fe2O3/PS/visible light, (b) kinetic curves of RhB degradation under the above experimental conditions, (c) time-dependent UV-visible absorption spectra of RhB solution over K-Fe2O3, and (d) the degradation ratio of RhB and the removal ratio of COD in the K-Fe2O3/PS/visible system. Initial conditions: CRhB = 10.0 mg L−1, Wcatalyst = 50 mg, CPS = 8 mM, pH = natural. | |
As shown in Fig. 5c, there was a significant decrease in the UV-vis absorption peak at 554 nm within 5 min after turning on the light. This result was in good agreement with degradation activity curve VII. Interestingly, the maximum absorption wavelength of RhB shifted from 554 to 542 nm. Meanwhile, the absorption wavelengths at 260, 302, and 352 nm disappeared after the reaction. This might be because the dye molecule went through N-deethylation,28,29 indicating that the catalyst has successfully destroyed the structure of the RhB molecules. In order to further confirm the photocatalytic performance of the K-Fe2O3 catalyst, we measured the change in chemical oxygen demand (COD) value in aqueous solution during the degradation reaction, and the result is displayed in Fig. 5d. The value of COD in the solution dropped from 69.8 mg L−1 to 8.2 mg L−1 under optimal reaction conditions, and the degradation ratio and COD removal ratio for RhB were 99.8% and 88.3%, respectively, exhibiting the excellent mineralization capacity of Fe2O3.
3.2.2. Effect of PS concentration. The influence of PS concentration of the initial solution on the degradation of RhB in the K-Fe2O3/PS/visible light system is shown in Fig. 6b. It can obviously be observed from the figure that when the concentration of PS increased from 1 mmol L−1 to 4 mmol L−1, the degradation ratio of RhB increased from 70.3% to 92.4% within 60 min. But the initial PS concentration had a saturation value (≥8 mM), and although the concentration of PS continued to increase, the photocatalytic activity of K-Fe2O3 remained almost unchanged. In order to ensure a good degradation efficiency and save materials, in this study, the optimal initial PS concentration was 1.0 mM.
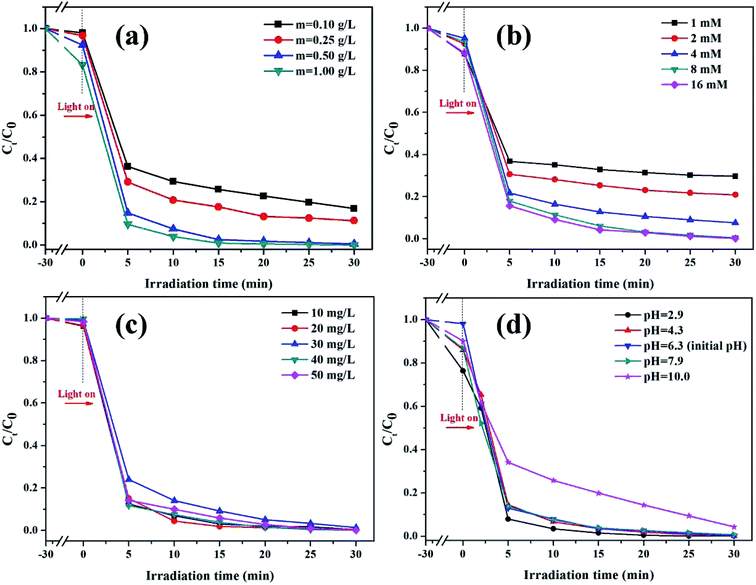 |
| | Fig. 6 (a) The effect of catalyst dosage ([PS] = 8 mM, pH = 6.3, [RhB] = 100 mL, 10 mg L−1), (b) the effect of PS concentration ([K-Fe2O3] = 0.5 g L−1, pH = 6.3, [RhB] = 100 mL, 10 mg L−1), (c) the effect of RhB concentration ([K-Fe2O3] = 0.5 g L−1, [PS] = 8 mM, pH = 6.3), and (d) the effect of the initial pH on the degradation of RhB in the K-Fe2O3/PS/visible light system ([K-Fe2O3] = 0.5 g L−1, [PS] = 8 mM, [RhB] = 100 mL, 10 mg L−1). | |
3.2.3. Effect of catalyst dosage. The influence of the dosage of K-Fe2O3 catalyst on the degradation of RhB in the K-Fe2O3/PS/visible light system is shown in Fig. 6a. When the dosages of the catalyst were 0.1 g L−1, 0.25 g L−1, 0.5 g L−1 or 1.0 g L−1, the degradation ratios of RhB were 83.2%, 88.8%, 99.5% and 100% after 60 min. An increase in the catalyst may increase the number of active sites in the reaction system by increasing the contact area between the catalyst and contaminant molecules. This phenomenon was observed at the beginning of the degradation reaction. However, when the catalyst dosage exceeded a maximum value (0.5 g L−1), the degradation effect of RhB had not changed much, because the excessive catalyst blocked the visible light irradiation.30 Additionally, for recycling, the dosage of catalyst should not be too small. In this study, the optimal catalyst dosage was 0.5 g L−1.
3.2.4. Effect of RhB concentration. As we know, for the same oxidation system, the degradation effect may vary greatly with different concentrations of pollutant.31 The influence of the concentration of RhB in the initial solution on the degradation of RhB in the K-Fe2O3/PS/visible light system is shown in Fig. 6c. We found that even if the concentration of the dye (10.0 mg L−1) was increased by 5 times (50.0 mg L−1), the degradation ratio of RhB by the K-Fe2O3/PS/visible light system was still over 98%. In contrast, other studies have reported different experimental phenomena.32 With an increase in the concentration of RhB, the above system had a negative effect on the degradation of RhB. The results of this experiment demonstrate the strong oxidation performance of the K-Fe2O3 catalyst and the system could indiscriminately degrade different concentrations of RhB. This also showed that the synthesized K-Fe2O3 catalyst has a good environmental application performance under the activation of PS.
3.2.5. Effect of pH. Generally, the oxidation system did not exhibit an excellent degradation effect in alkaline wastewater. In order to explore the influence of initial solution pH on the degradation of RhB in the K-Fe2O3/PS/visible light system, as shown in Fig. 6d, we adjusted the initial pH of RhB solution to 2.9–10.0 with NaOH/HCl. Interestingly, even when the initial pH was 10.0, the degradation ratio of RhB still reached more than 95% within 60 min. This might be attributed to the electronegativity and strong adsorption of clay minerals.33 Without adjusting the initial solution pH, the degradation ratio of RhB was 98.8% (pH = 6.3). At pH = 2.9, the K-Fe2O3/PS/visible light system showed the best degradation efficiency (100%). This was because the Fe2+/PS system could produce active free radicals under acidic, neutral or even alkaline conditions (eqn (2) and (3)). The above results showed that this system could overcome the shortcoming of pH value in dye wastewater treatment.34,35
3.2.6. Effect of inorganic anions. In practice, organic wastewater contains a variety of complex components, which can scavenge active radicals and reduce the degradation ratio of pollutants.36 Typically, the effects of different inorganic anions (Cl−, SO42−, CO32−, NO3−) on the degradation of RhB in the K-Fe2O3/PS/visible light system were studied. From Fig. 7a, we can see that 4 kinds of inorganic ions have certain negative effects on the degradation reaction. Besides, it is shown that the inhibition of RhB degradation by the K-Fe2O3/PS/visible light system followed the trend: SO42− < NO3− < Cl− < CO32−. The main reason was that inorganic anions react with free radicals (SO4−˙ and OH˙) to form other products with weak oxidizing properties (CO3−˙, Cl˙, Cl2−˙, NO3˙), as shown in eqn (5)–(9).37,38 SO42− and NO32− did not cause significant inhibition of RhB degradation, which might be because SO42− did not react with SO4˙− radicals and the reaction rate constant of eqn (9) was very low.39 In order to further study the influence of inorganic ions on the degradation performance for the persulfate system, the pH value of the solution after adding different inorganic ions was measured. We can see that the pH value of the other systems was almost unchanged, except for the CO32− ion (pH = 9.4). Additionally, degradation experiments were carried out under only PS and visible light irradiation, and the results are shown in Fig. 7b. The degradation ratio of RhB in the system without any ions was the highest and the degradation trend of the PS/visible light system is consistent with that of the K-Fe2O3/PS/visible light system, which further illustrated that SO4−˙ could react with inorganic ions. This result of this experiment can help environmental practitioners optimize organic pollutant removal efficiency by removing some of the anions.| | |
SO4˙− + CO32− → SO42− + CO3−˙ k = 6.1 × 10⁶ M−1 S−1
| (5) |
| | |
OH˙ + CO32− → OH− + CO3−˙ k = 3.9 × 10⁸ M−1 S−1
| (6) |
| | |
SO4˙− + Cl− → SO42− + Cl˙ k = 3.1 × 10⁸ M−1 S−1
| (7) |
| | |
Cl˙ + Cl− → Cl2−˙ k = 8.0 × 10⁹ M−1 S−1
| (8) |
| | |
SO4˙− + NO3− → SO42− + NO3˙ k = 2.0 × 10² M−1 S−1
| (9) |
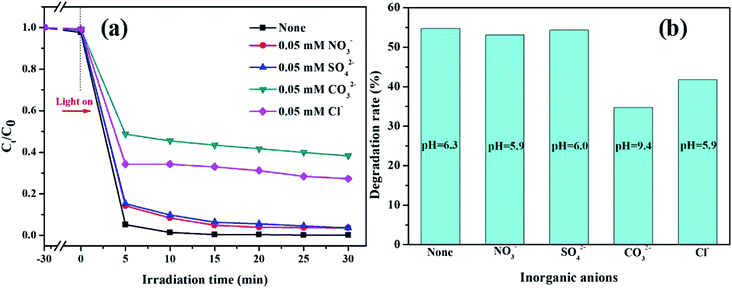 |
| | Fig. 7 (a) The effects of different inorganic anions on the degradation of RhB in the K-Fe2O3/PS/visible light system ([K-Fe2O3] = 0.5 g L−1, [PS] = 8 mM, pH = 6.3, [RhB] = 100 mL, 10 mg L−1), and (b) the effects of different inorganic anions on the degradation of RhB in the PS/visible light system ([PS] = 8 mM, [RhB] = 100 mL, 10 mg L−1). | |
3.3. Environmental application of kaolin-Fe2O3
Based on the above results, we found that the K-Fe2O3/PS/visible light system exhibited an excellent performance in degrading RhB in aqueous solution. At the same time, we wondered whether the system could degrade other organic pollutants in the solution. The abuse of antibiotics has led to the increasingly serious pollution of the natural environment by antibiotics.40 In this study, the degradation of a colorless antibiotic ciprofloxacin (CIP) was carried out. Fig. 8a shows the UV-visible absorption spectra changes of CIP solution (maximum absorption wavelength = 270 nm) over K-Fe2O3, indicating that the degradation ratio of CIP reached 63% under optimal experimental conditions within 30 min. In addition, we carried out large-scale treatment experiments for dye wastewater (location: 112.51° East, 23.11° North, experimental time: Sept. 12, 9:30 AM to 12:00 AM, 12:30 PM to 15:30 PM). As shown in Fig. 8b, an obvious decolorization was observed in 20 L of RhB dye wastewater after 150 min. Furthermore, a kind of wastewater with a complex composition, including three common azo dyes Rhodamine B (RhB), methyl orange (MO) and methylene blue (MB) was treated under the same conditions. K-Fe2O3 still exhibited high photocatalytic performance for a mixed solution. These phenomena suggested that the K-Fe2O3/PS/visible light system had general applicability for the degradation of organic pollutants.
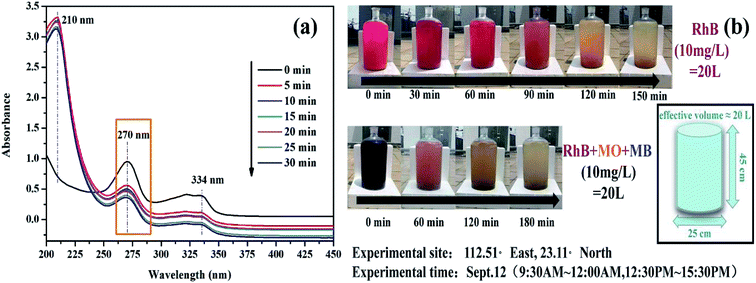 |
| | Fig. 8 (a) Time-dependent UV-visible absorption spectra of CIP solution over K-Fe2O3, and (b) a large-scale photodegradation system under natural sunlight irradiation with K-Fe2O3 catalyst ([K-Fe2O3] = 0.5 g L−1, [PS] = 8 mM, [CIP] = 100 mL, 10 mg L−1, pH = natural). | |
3.4. Stability of K-Fe2O3
We explored the stability of the K-Fe2O3 through cycling degradation experiments. As shown in Fig. 9a, the degradation ratios of RhB were 99% on the first run and 96% on the sixth run, which showed that the K-Fe2O3 catalyst was stable during the degradation process. The slight change in the degradation ratio of RhB may be due to the loss of catalyst in the recovery process.41 Additionally, in order to study the phase change of the catalyst during the degradation reaction process, the FT-IR patterns of fresh K-Fe2O3 and used K-Fe2O3 are displayed in Fig. 9b. No marked shift in the main characteristic bands at 1057, 582, and 482 cm−1 was observed. Besides, the characteristic bands of pure RhB (3407 cm−1) were not found in the spectra of the used K-Fe2O3 catalyst, indicating that the dyes were indeed degraded rather than adsorbed.42 Moreover, the XPS and XRD patterns of the K-Fe2O3 catalyst after using for 0 min and 300 min are displayed in Fig. 9c and d. The Fe 2p peak of the used catalyst shifted slightly toward the low binding energy direction, indicating that part of the Fe species on the surface of the K-Fe2O3 catalyst was converted to Fe(II) during the degradation reaction. This further proved that the Fe species on the K-Fe2O3 surface are the main active sites for the K-Fe2O3/PS/visible light system.43 As shown in Fig. 9d, the main peaks of the XRD pattern of the catalyst did not shift after use. The above results confirmed that the K-Fe2O3 catalyst has excellent stability.
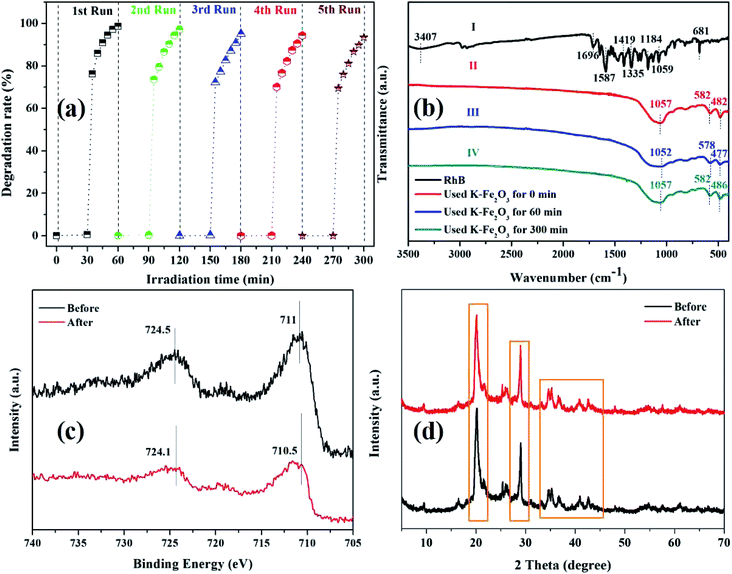 |
| | Fig. 9 (a) The recycling performance of the K-Fe2O3 catalyst for the degradation of RhB in aqueous solution, (b) the FT-IR patterns of pure RhB powder and the catalyst after use for 0 min, 60 min, and 300 min, (c) the XPS pattern of the catalyst after use for 0 min and 300 min, and (d) the XRD pattern of the catalyst after use for 0 min and 300 min. | |
3.5. Reaction mechanism
As can be seen in Fig. 10, without using any free radical scavenger, a 99.8% degradation ratio was reached in the control group. When IPA (·OH radical scavenger), BQ (O2˙− radical scavenger) and MeOH (SO4˙− radical scavenger) were added into the reaction solution during the RhB degradation, the degradation ratios of RhB dropped to 69.9%, 82.6% and 92.4% within 60 min, respectively. On the one hand, the addition of MeOH greatly inhibited the degradation reaction, and this also showed that SO4˙− was the major active species in the K-Fe2O3/PS/visible light system. On the other hand, the ·OH radical also made a certain contribution to degrading RhB in the solution. Similar phenomena have been reported by other researchers, such as Guo et al.44 and Hu et al.45 The above results indicated that the K-Fe2O3/PS/visible light Fenton-like system can produce two active radicals, SO4˙− and ·OH, and the organic pollutants were efficiently removed through the common oxidation of the two radicals.
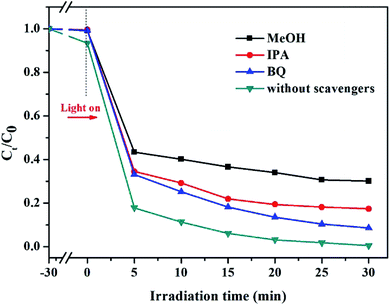 |
| | Fig. 10 Photocatalytic activities of the K-Fe2O3 catalyst for the degradation of RhB with different scavengers ([RhB] = 10 mg L−1, pH = initial value, [K-Fe2O3] = 0.5 g L−1, [PS] = 8 mM). | |
A possible degradation mechanism of organic pollutants in the K-Fe2O3/PS/visible light system is proposed. As displayed in Fig. 11, firstly, the surface of the K-Fe2O3 catalysts produced induced electrons and photo-induced holes under visible light irradiation (eqn (10)). Secondly, the aggregated electrons reacted with S2O82− to produce SO4˙− and ferric ions in aqueous solution activated S2O82− to produce SO4˙− (eqn (11) and (12)). Thirdly, SO4˙− could react with H2O to produce OH˙ radicals (eqn (13)) which further accelerate the degradation reaction rate and improve the catalytic performance of the system. Finally, the produced radicals with strong oxidizing properties would attack organic pollutants to degrade it and then produce CO2 and H2O (eqn (14)).46
| | |
Photocatalyst + hν → e− + h+
| (10) |
| | |
e− + S2O82− → SO42− + SO4˙−
| (11) |
| | |
S2O82− + Fe2+ → SO42− + SO4˙− + Fe3+
| (12) |
| | |
SO4˙− + H2O → SO42− + OH˙ + H+
| (13) |
| | |
·OH/SO4˙− + organic pollutants → CO2 + H2O
| (14) |
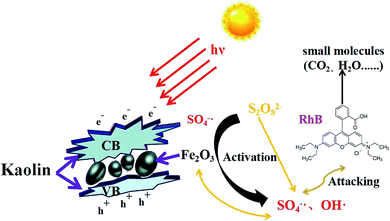 |
| | Fig. 11 The proposed mechanism for the degradation of organic pollutants in the Fe2O3-pillared kaolin/PS/visible light system. | |
4. Conclusions
A K-Fe2O3 photocatalyst was prepared by a facile method. In a K-Fe2O3/PS/visible light system, a 99.8% degradation ratio of RhB was reached under optimal experimental conditions. The effects of catalyst dosage, PS concentration, RhB concentration and solution pH on the catalytic activity were researched. Most interestingly, we found that K-Fe2O3 still showed high degradation activity for RhB over a wide range of pH (2.9–10). The practical application of the K-Fe2O3/PS/visible light system for real dye wastewater remediation (MO, MB, RhB) was also shown. On the other hand, the inhibition effects of inorganic anions on the system were observed. Furthermore, five cyclic runs showed that the catalyst had good stability and its chemical structure remained unchanged. Trapping experiments confirmed that SO4˙− and ·OH were the main active radicals in the organic pollutant photodegradation process. Finally, we proposed a schematic mechanism for the degradation of organic pollutants in the K-Fe2O3/PS/visible light system. This study has important value for practical organic wastewater treatment applications.
Conflicts of interest
There are no conflicts to declare.
Acknowledgements
This work was supported by Innovation Projects of Colleges and Universities in Guangdong Province (2018KTSCX249), the Zhaoqing City Science and Technology Innovation Guidance Project (2017S002) and the Innovative Entrepreneurship Project of Chinese College Students (201810580075, 201910580156).
References
- K. Zhou, Q. Zhang, J. Li, B. Wang, S. Jiang and Y. Shi, RSC Adv., 2014, 4, 13205 RSC.
- J. Ma, Y. Yang, X. Dai, Y. Chen, H. Deng, H. Zhou, S. Guo and G. Yan, Chemosphere, 2018, 190, 296–306 CrossRef CAS PubMed.
- S. Ganesh Babu, P. Aparna and G. Satishkumar, Ultrason. Sonochem., 2017, 34, 924–930 CrossRef PubMed.
- Y.-J. Shih, T. B. Nguyen and C.-W. Chen, Chemosphere, 2016, 150, 294–303 CrossRef CAS PubMed.
- L. Chen, X. Peng, J. Liu, J. Li and F. Wu, Ind. Eng. Chem. Res., 2016, 51, 13632–13638 CrossRef.
- D. Miao, J. Peng, X. Zhou, L. Qian, M. Wang and L. Zhai, Chemosphere, 2018, 207, 174–182 CrossRef CAS PubMed.
- H. Hori, A. Yamamoto, E. Hayakawa, S. Taniyasu, N. Yamashita and S. Kutsuna, Environ. Sci. Technol., 2005, 39, 2383–2388 CrossRef CAS PubMed.
- C. Qi, X. Liu, C. Lin, X. Zhang, J. Ma and H. Tan, Chem. Eng. J., 2014, 249, 6–14 CrossRef CAS.
- Y. F. Rao, L. Qu, H. Yang and W. Chu, J. Hazard. Mater., 2014, 268, 23–32 CrossRef CAS PubMed.
- D. Zhou, H. Zhang and L. Chen, J. Chem. Technol. Biotechnol., 2015, 90, 775–779 CrossRef CAS.
- P. Zhou, J. Zhang, J. Liu, Y. Zhang, J. Liang and Y. Liu, RSC Adv., 2016, 6, 99532–99539 RSC.
- X. Zou, T. Zhou, J. Mao and X. Wu, Chem. Eng. J., 2014, 257, 36–44 CrossRef CAS.
- M. Nie, C. Yan, X. Xiong, X. Wen, X. Yang and Z. Lv, Chem. Eng. J., 2018, 348, 455–463 CrossRef CAS.
- C. Xiao, J. Li and G. Zhang, J. Cleaner Prod., 2018, 180, 550–559 CrossRef CAS.
- G. Ran and Q. Li, RSC Adv., 2019, 9, 25414–25422 RSC.
- Y. Hu, Y. Zhang and Y. Tang, RSC Adv., 2012, 2, 6036–6041 RSC.
- L. Jiang, J. Wang, X. Wu and G. Zhang, Water, Air, Soil Pollut., 2017, 228, 463 CrossRef.
- S. Yang and D. Che, RSC Adv., 2017, 7, 42233–42241 RSC.
- L. Xu and J. Wang, Environ. Sci. Technol., 2012, 46, 10145–10153 CrossRef CAS PubMed.
- S. Navalon, M. Alvaro and H. Garcia, Appl. Catal., B, 2010, 99, 1–26 CrossRef CAS.
- J. H. Ramirez, C. A. Costa and L. M. Madeira, et al., Appl. Catal., B, 2007, 71, 44–56 CrossRef CAS.
- G. T. Wei, Y. S. Li, L. Y. Zhang, Z. M. Li, Y. Deng and L. H. Shao, Clay Miner., 2017, 52, 439–451 CrossRef CAS.
- M. A. De León, M. Sergio and J. Bussi, et al., Environ. Sci. Pollut. Res., 2019, 26, 12720–12730 CrossRef PubMed.
- J. Herney-Ramirez, M. Lampinen and M. A. Vicente, et al., Ind. Eng. Chem. Res., 2008, 47, 284–294 CrossRef CAS.
- H. Mao, K. Zhu, B. Li, C. Yao and Y. Kong, Appl. Surf. Sci., 2014, 292, 1009–1019 CrossRef CAS.
- T. Mishra and D. K. Mahato, J. Environ. Chem. Eng., 2016, 4, 1224–1230 CrossRef CAS.
- X. Zheng, et al., Chem. Eng. J., 2019, 374, 793–801 CrossRef CAS.
- K. N. D. S. Nascimento, M. C. A. D. Oliveira and P. S. Oliveira, et al., Fibers Polym., 2015, 16, 2177–2183 CrossRef CAS.
- H. Dong, Z. Li, X. Xu, Z. Ding and X. Fu, Appl. Catal., B, 2009, 89, 51–556 CrossRef.
- Y. Guo, G. Zhang and H. Gan, J. Colloid Interface Sci., 2012, 369, 323–329 CrossRef CAS PubMed.
- P. Guo and X. Jin, Catal. Commun., 2018, 106, 101–105 CrossRef CAS.
- M. Zhou, H. Yang, T. Xian, R. S. Li, H. M. Zhang and X. X. Wang, J. Hazard. Mater., 2015, 289, 149–157 CrossRef CAS PubMed.
- G. Zhang, Y. Gao, Y. Zhang and Y. Guo, Environ. Sci. Technol., 2010, 44, 6384–6389 CrossRef CAS PubMed.
- H. Zhang, Z. Xiong, F. Ji, B. Lai and P. Yang, Chemosphere, 2017, 176, 192–201 CrossRef CAS PubMed.
- J. Ma, Q. Yang, Y. Wen and W. Liu, Appl. Catal., B, 2017, 201, 232–240 CrossRef CAS.
- S. Yang and D. Che, RSC Adv., 2017, 7, 42233–42241 RSC.
- J. Ma, Y. Yang, X. Jiang, Z. Xie and H. Chen, Chemosphere, 2017, 190, 296–306 CrossRef PubMed.
- H. Peng, W. Zhang, L. Xu, R. Fu and K. Lin, Chem. Eng. J., 2016, 306, 226–232 CrossRef CAS.
- C. Qi, X. Liu, J. Ma, C. Lin, X. Li and H. Zhang, Chemosphere, 2016, 151, 280–288 CrossRef CAS PubMed.
- K. Wang, G. Zhang, J. Li, Y. Li and X. Wu, ACS Appl. Mater. Interfaces, 2017, 50, 43704–43715 CrossRef PubMed.
- J. Li, J. Wang, G. Zhang, Y. Li and K. Wang, Appl. Catal., B, 2018, 234, 167–177 CrossRef CAS.
- Y. Gao, H. Gan, G. Zhang and Y. Guo, Chem. Eng. J., 2013, 217, 221–230 CrossRef CAS.
- M. m. Ding, et al., J. Hazard. Mater., 2020, 382, 121064 CrossRef CAS PubMed.
- T. Guo, C. Dang, S. Tian, Y. Wang, D. Cao and Y. Gong, Chem. Eng. J., 2018, 347, 535–542 CrossRef CAS.
- P. Hu and M. Long, Appl. Catal., B, 2016, 181, 103–117 CrossRef CAS.
- T. Y. Shang, L. H. Lu and Z. Cao, et al., Chem. Commun., 2019, 55, 5408–5419 RSC.
|
| This journal is © The Royal Society of Chemistry 2020 |
Click here to see how this site uses Cookies. View our privacy policy here.  Open Access Article
 *b,
Dexin Gan*a and
Chun Xiaob


