
 Open Access Article
 This Open Access Article is licensed under a Creative Commons Attribution-Non Commercial 3.0 Unported Licence
Theoretical study on NOx adsorption properties over the α-MnO2(110) surface
Xingguang Haoa,
Xin Song a,
Kai Lia,
Chi Wangb,
Kunlin Lia,
Yuan Lia,
Xin Sun*a and
Ping Ning*ac
a,
Kai Lia,
Chi Wangb,
Kunlin Lia,
Yuan Lia,
Xin Sun*a and
Ping Ning*ac
aFaculty of Environmental Science and Engineering, Kunming University of Science and Technology, Kunming 650500, PR China. E-mail: sunxin_kmust@163.com; ningpingkmust@163.com; Fax: +86-871-65920507; Tel: +86-871-65920507
bFaculty of Chemical Engineering, Kunming University of Science and Technology, Kunming 650500, PR China
cNational-Regional Engineering Center for Recovery of Waste Gases from Metallurgical and Chemical Industries, Kunming University of Science and Technology, Kunming 650500, PR China
First published on 5th March 2020
Abstract
Herein, α-MnO2 was studied as an adsorbent for the removal of NOx (NO, NO2) derived from flue gas. First-principles calculations based on the density functional theory (DFT) were performed to investigate the NOx adsorption properties over the α-MnO2(110) surface. NO strongly adsorbed over the α-MnO2(110) surface via chemisorption spontaneously under 550 K. The NO2 molecules adsorbed over the surface via chemisorption and physisorption when the terminal N- and O atoms approached the surface, respectively. The joint adsorption of NOx was more stable than the isolated adsorption system. Furthermore, the net charge was transferred from the molecule to the surface. The surface and temperature affected the entropy, enthalpy, NO adsorption and NO2 desorption in the temperature range of 300–550 K. The equilibrium constants decreased with an increase in temperature, which reduced the conversion rate.
1. Introduction
More than 90% of the total emissions of nitrogen oxides (NOx) originate from stationary sources (copper smelter off-gas, power plants, etc.)1–4 due to the burning of coke under high-temperature combustion conditions. The spread of NOx in the atmosphere can lead to a global disaster, including ozone depletion, acid rain, photochemical smog and greenhouse effects.5,6 Thus, the removal of these contaminants in compliance with environmental emission standards is necessary. NO and NO2 are the main monitoring objects, which typically make up the total emission of NOx from industries.7,8 So far, many methods for controlling NOx contamination, including SCR (selective catalytic reduction) in the gas phase, absorption in the liquid phase and adsorption in the solid phase, have been developed and applied in industries.9–11 However, the leakage of NH3 causes air pollution in SCR methods and produces a large amount of wastewater and results in an increase in cost in absorption methods. Comparing the two above-mentioned methods, adsorption is better for the removal of NOx owing to its excellent characteristics of larger surface area, better selectivity, higher adsorption capacity and rate, better regeneration, and chemical stability. The sorbents CuO, SnO2, CeO2, Al2O3, TiO2, and V2O5 have been chosen as the ideal materials to remove NOx in industries.12–15 However, the high cost of these noble metal oxides limits their application; therefore, there is a need to find inexpensive materials to remove NOx efficiently. Chen et al. found that α-MnO2 exhibits the highest adsorption capacity for NOx among the α-, β-, γ- and σ-MnO2 phase structures and the abovementioned sorbents.16 Therefore, α-MnO2 can act as a suitable sorbent to reduce NOx emissions. However, very little is known about the NOx adsorption mechanism over the α-MnO2 surface. Thus, it is necessary to understand the mechanism with the density functional theory (DFT).Cockayne et al. computed the atomic, electronic, and magnetic properties of α-MnO2 crystals using the DMol3 package in Materials Studio to provide quantitative predictions.17 DFT calculations were performed using the abovementioned package to investigate the α-MnO2(110) surface by Liu et al., and the hydroxyl α-MnO2(110) surface was also simulated with reasonable changes from the crystal structure.18 For oxygen-rich and oxygen-lean α-MnO2(110) surfaces, Tang et al. explored the surface structure sensitivity of manganese oxides for low-temperature SCR methods to remove NO using the DMol3 package.19,20 Thus, herein, the DMol3 package in Materials Studio was used to simulate a process of NOx adsorption over the α-MnO2(110) surface.
This study was aimed at investigating the adsorption mechanism and fundamental chemical reactivity of NOx over the α-MnO2 (110) surface based on DFT. The thermodynamic properties (Gibbs free energy change, enthalpy, entropy and equilibrium constant), adsorption properties (adsorption energy) and electronic transfer properties (Mulliken charge) were evaluated to determine the optimal adsorption site over the (110) surface. Moreover, the potential energy diagrams of the different pathways for NOx adsorption over the surface were presented and the joint adsorption and analysis temperature effect on the equilibrium constant of NOx was calculated.
2. Computational method and models
In this research, all calculations were performed with DFT using periodic boundary conditions.21–24 All DFT calculations were completed using DMol3 with the GGA (generalized gradient approximation) scheme and PBE (Perdew, Burke and Ernzerhof) exchange-correlation functional to describe the exchange-correlation effects.18,19 Atomic basis sets were applied numerically in terms of the double numerical plus polarization function (DNP) basis set version 3.5 and a global orbital cutoff of 4.7 Å was applied. The geometry optimization convergence tolerances of the energy, gradient, and displacement were 1 × 10⁻⁵ Hartree (Ha), 2 × 10⁻³ Ha Å−1, and 5 × 10⁻³ Å, respectively. The core electrons were modeled using a density functional semi-core pseudopotential (DSPP) method for Mn atoms, and the all-electron method was used for the core electrons of the N and O atoms. For bulk lattice optimization, energies were converged with (3 × 3 × 9) k points in a Monkhorst–Pack grid. The crystal structure of the optimized α-MnO2 is shown in Fig. 1a, which is a body-centered tetragonal lattice type with the space group I4/m and its optimized unit cell parameters (a = b = 9.815 Å, c = 2.847 Å) within +0.67% and −0.49% error of the experimentally determined lattice constants,25 indicating that the calculation results are reliable.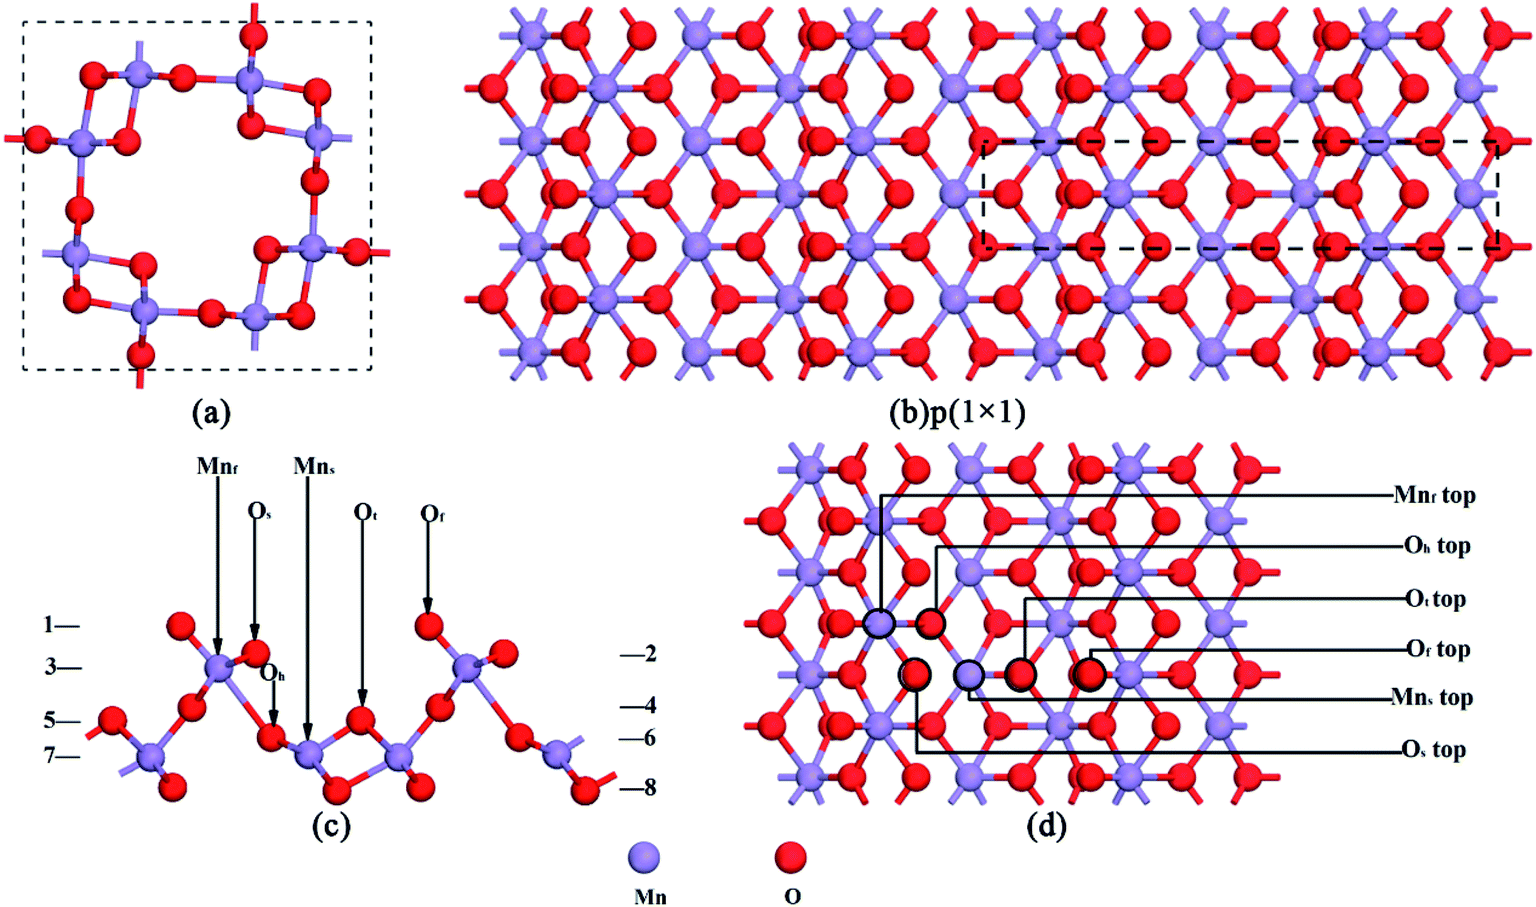 | ||
| Fig. 1 (a) Optimized α-MnO2 crystal structure. (b) α-MnO2(110) surface configuration. (c) Side view of the α-MnO2(110) surface with eight layers. (d) Top view of the α-MnO2(110) surface with different adsorption positions. | ||
The α-MnO2(110) surface was the most thermodynamically stable bulk termination and catalytically active surface.21,26 Therefore, the calculation of the thermodynamic properties and adsorption energies was performed using the α-MnO2(110) surface. The surface slab was cleaved from the optimized structure of α-MnO2. 8 layers of atoms were extracted. The p(1 × 1) supercell was built with a vacuum region of 15 Å along the z-axis, which is shown in Fig. 1b and c. The Monkhorst–Pack k point sampling was set as 3 × 3 × 1.18,27 The SCF tolerance and number of cycles were 1.0 × 10⁻⁶ Ha and 1000, respectively. In the region of the surface, there were four different types of coordinative oxygen atoms, where the first layer oxygen atom Of lies on the top of the surface, the Os atom lies on the second layer oxygen atom, the Ot atom lies on the fifth layer oxygen atom and the Oh atom lies on the sixth layer oxygen atom. The third- and seventh-layer atoms were Mn atoms, which could be chosen as an adsorption position. They were named Mnf and Mns, respectively. The atoms in the region were all relaxed, as shown in Fig. 1d. All the structures were optimized at the same level of theory.
3. Results and discussion
To investigate the stability of the NOx molecules adsorbed over the α-MnO2(110) surface, the adsorption energy (Eads) was calculated according to eqn (1).| Eads = Esurf−gas − Esurf − Egas | (1) |
Moreover, to determine the exothermicity of the adsorption process and to investigate the favorability of the spontaneous reaction as a function of temperature, the equilibrium constant (Keq),28–32 Gibbs free energy change, entropy (S) and enthalpy (H) were calculated according to the thermodynamic data from the frequency. The general relationships for the statistical thermodynamic partition functions (translational, rotational, and vibrational partition functions) were introduced.33 The equilibrium constant (Keq) can be defined as eqn (2).
| ln(Keq) = −ΔG/RT | (2) |
The Gibbs free energy change during the adsorption process was calculated using eqn (3).
 | (3) |
The net charge-transfer (Q) was calculated using eqn (4).
| Q = Mulliken chargeafter − Mulliken chargebefore | (4) |
The heat (Q) that an adsorption system adsorbs at a specific temperature was calculated using eqn (5).
| Q = nCp,TT | (5) |
The entropy value (S) was calculated using eqn (6).
| S = Q/T | (6) |
The enthalpy value (H) was calculated using eqn (7).
| H = U + pV | (7) |
3.1 Adsorption of NO molecule over the α-MnO2(110) surface
Deshwal et al. found that the major component of NOx was NO (ca. 90%) in flue gas.35 Also, NO was found to be an intermediate in the industrial production of nitric acid.36,37 Therefore, it is important to investigate the NO adsorption mechanism over the α-MnO2(110) surface to remove the vast majority of NOx as a raw material for the production of nitric acid. Before adsorption, the bond length of the free NO molecule was calculated to be 1.163 Å, which is close to the experimental value (1.17 Å).38,39 Then, an isolated adsorption system is formed, and the NO molecule adsorbs over the different adsorption positions of the α-MnO2(110) surface. The optimized models of NO adsorption are presented in Fig. 2. The adsorption energies, bond length, distance and net charge-transfer for NO adsorption over the α-MnO2(110) surface are shown in Table 1.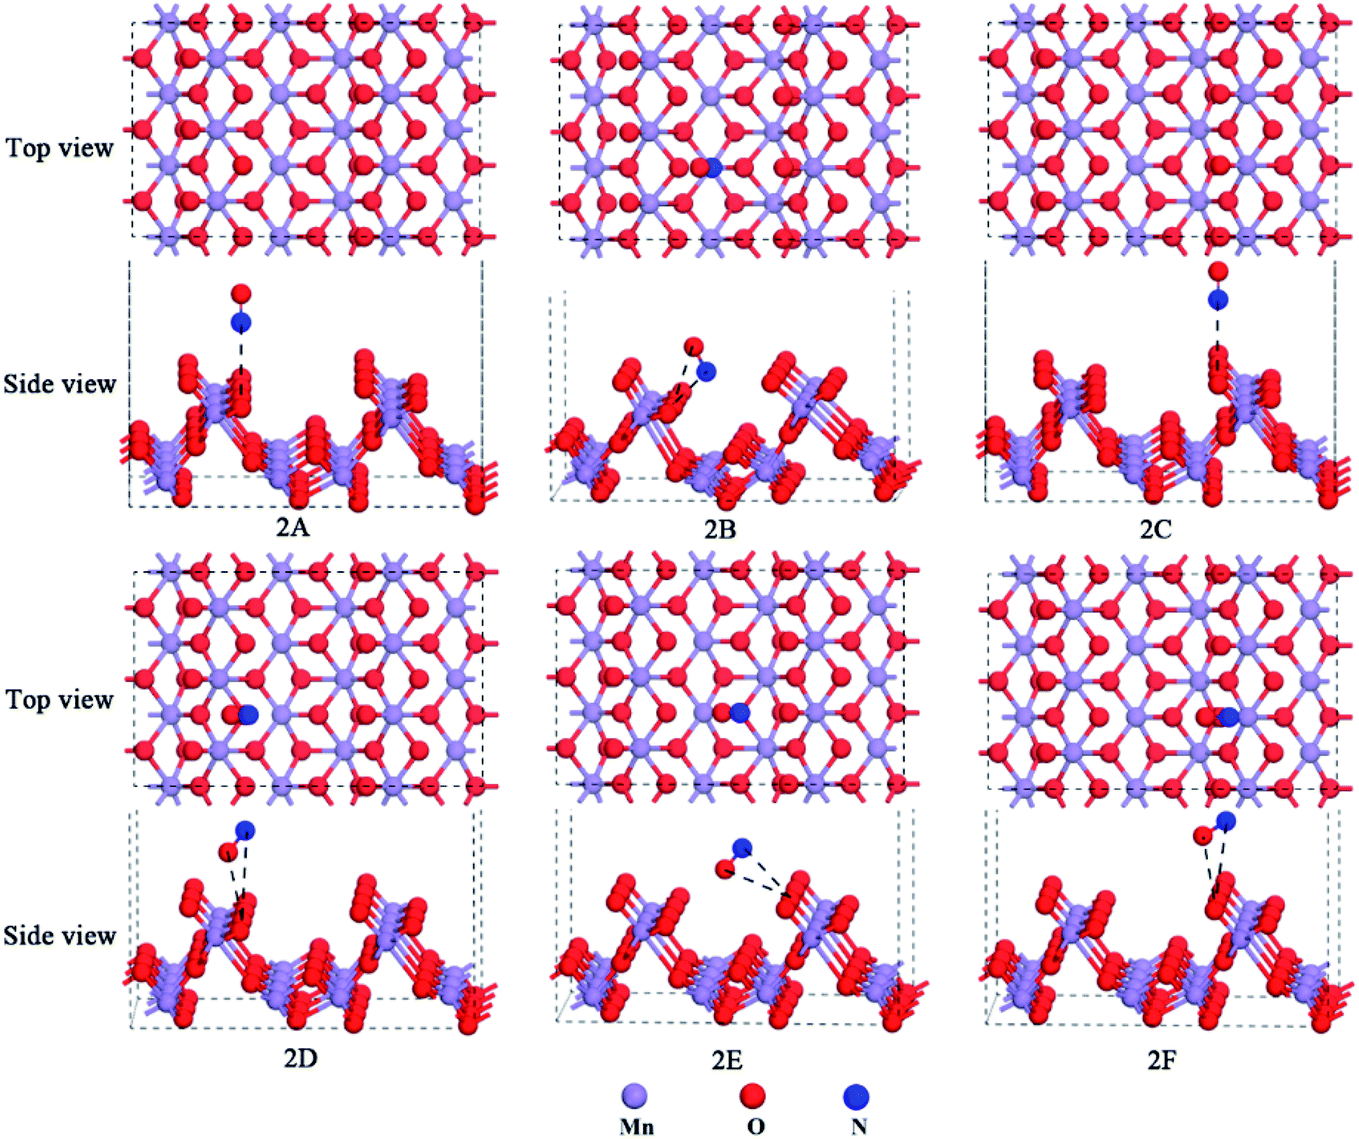 | ||
| Fig. 2 Optimized models of NO adsorption over the α-MnO2(110) surface. | ||
| Model | Eads | LN–X | LO–X | dN![[double bond, length as m-dash]](https://www.rsc.org/images/entities/char_e001.gif) O O |
QNO |
|---|---|---|---|---|---|
| a Eads is the adsorption energies (kJ mol−1); LN–X is the distance between N of the adsorbed NO molecule and closest adsorbate atom (Å); LO–X is the distance between O of the adsorbed NO molecule and closest adsorbate atom (Å); dNO is the bond length of the adsorbed NO molecule; and QNO is the net-charge transfer of the NO molecule (e). |
|||||
| 2A | −53.97 | 3.014 | — | 1.131 | 0.34 |
| 2B | −85.05 | 1.969 | 2.592 | 1.127 | 0.41 |
| 2C | −48.65 | 3.012 | — | 1.133 | 0.31 |
| 2D | −56.42 | 3.699 | 2.863 | 1.128 | 0.35 |
| 2E | −63.93 | 2.869 | 2.928 | 1.124 | 0.38 |
| 2F | −53.53 | 3.290 | 2.727 | 1.130 | 0.33 |
As shown in Table 1, the adsorption strength for NO adsorption over the surface followed the order of 2C < 2F < 2A<2D < 2E < 2B. This indicates that all the NO adsorption sites exhibited chemisorption, suggesting an exothermic process and a stable adsorption system. The NO molecule adsorbed over the surface is chemisorption, which was modeled by attaching the molecule to the surface by its N atom as well as by its O atom. In the adsorption process, the net charge-transfer based on the Mulliken population analysis was investigated to determine the charge-transfer mechanism between the molecule and surface. The results presented in Table 1 show that the adsorbed NO molecule was positively charged on all the models. This means that electrons transfer from NO to the surface, which indicates that NO acts as a donor to provide electrons. The reason for this that the electronic arrangement of the N and O of NO is 2s2p3 and 2s22p4, respectively, and they form polar covalent bonds via sp hybridization. The hybridization of the atomic orbital of N and O forms a σ bond, a 2-electron π bond and a 3-electron π bond among the polar covalent bonds. There is a lone-pair of electrons in the 2p orbitals of the N atom and also the O atom. Besides, the Mulliken charge was easily affected by the basis set. Hence, there is a lone-pair of electrons from the 2p orbitals with an unpaired electron to be filled in the surface, which is influenced by the basis set. Moreover, the optimized bond lengths of the adsorbed NO molecule in the equilibrium state were all shorter than that in the free case, illustrating that the surface makes the molecule more stable and it is difficult to break the covalent bond after it is adsorbed over the surface. In addition, the optimized distance between the N or O atoms of the adsorbed NO molecule and O or Mn atoms of the surface was probably short enough to form a chemical bond among the NO molecules and the surface. For the six different configurations, it was found that all the distances between the molecule and the surface were less than 3.76 Å,40 which showed that our calculation was reasonable.
The most stable model is 1B in Table 1, which lies on the Mns top site, but approaches the Os site with both O and N in the N-down orientation and the distance of 2.592 Å and 1.969 Å, respectively. The adsorption energy was −85.05 kJ mol−1. Combining the bond lengths of NO, the distance between the molecules and the surface was 1.969 Å and 1.127 Å, and thus it can be concluded that the distance between the adsorbed molecules and the surface is due to the formation of chemical bonds. The reason for this that the formed chemical bond will lead to the covalent bond interaction in the adsorbed NO molecule becoming smaller than that in the free NO molecule. This explanation has been already applied to the adsorption of CO molecules on the orthorhombic structure of the LaMnO3(110) surface.34
Also, the thermodynamic properties (S, H and ΔG) as a function of temperature were calculated and DMol3 was used to plot the thermodynamic properties, as shown in Fig. 3. Furthermore, all the data for NO were demonstrated to be reliable compared to the experimental data.41 In Fig. 3a, the entropy values of all the configurations increase and their growth rate decrease when NO was almost parallel to the x-axis compared to the other configurations within the range of 44.92 to 56.63 cal mol−1 K as the temperature increased. As calculated using eqn (5) and eqn (6), the blue line in Fig. 3a and c should be parallel, but it is not and also the red line. This is because of the conversion of exergy and heat caused by increasing the temperature in the system. Obviously, exergy has a greater influence on entropy. Due to the stability of the NO molecule in the gaseous phase, it has a stable heat capacity and its covalent bond never breaks in the temperature range of 200–1000 K parallel to the x-axis. Also, the values for the NO adsorption system of Model 2B (Sads) were higher than that in the other conditions and close to the values of the α-MnO2(110) surface (Ssurf) at the same temperature, and the gap between the surface and the adsorption system increased with an increase in temperature. This indicates that the entropy of the adsorption system is affected more by the surface than by the NO molecule with a change in temperature and makes the molecule unstable to leave the surface. Also, we found that Sads < Ssurf + SNO and the value of Sads − Ssurf was lower in the range of 33.37–33.95 cal mol−1 K−1 compared to SNO (44.92–56.63 cal mol−1 K). This indicates that the NO molecule binds on the surface stably and does not undergo desorption and dissociation. In Fig. 3b, the growth rate and enthalpy values of the adsorption system and the surface increase and are close to each other when the free NO molecule is almost parallel to the x-axis with a positive increase in temperature. This indicates that all the configurations are endothermic and the enthalpy of the adsorption system is mainly affected by the surface clearly with an increase in temperature. Besides, the enthalpy was calculated using eqn (7), which is approximately equal to the heat at a constant pressure. Thus, it is influenced by heat, which is a function of temperature, and the heat capacity to cause the rate to increase. Meanwhile, heat in the phase transition does not occur in the adsorption system, as reflected in Fig. 3b by the slight changes in the enthalpy value in the range of 200–1000 K. The phenomenon that the distance between the adsorption system and the surface increases with an increase in temperature reveals that the adsorption system will adsorb more heat than the surface. In Fig. 3d, the plot of ΔG shows an increasing trend with negative values under 550 K and finally becomes positive with an increase in temperature. This indicates that the system functions spontaneously under 550 K and is suitable for laboratory experiments.42–44 Finally, we calculated the thermodynamic properties at 298.15 K, including H = 293.36 cal mol−1 K, S = 141.86 kcal mol−1, ΔG = −9.25 kcal mol−1, and Cp = 274.14 cal mol−1 K−1. This indicates that at room temperature, the reaction is spontaneous.
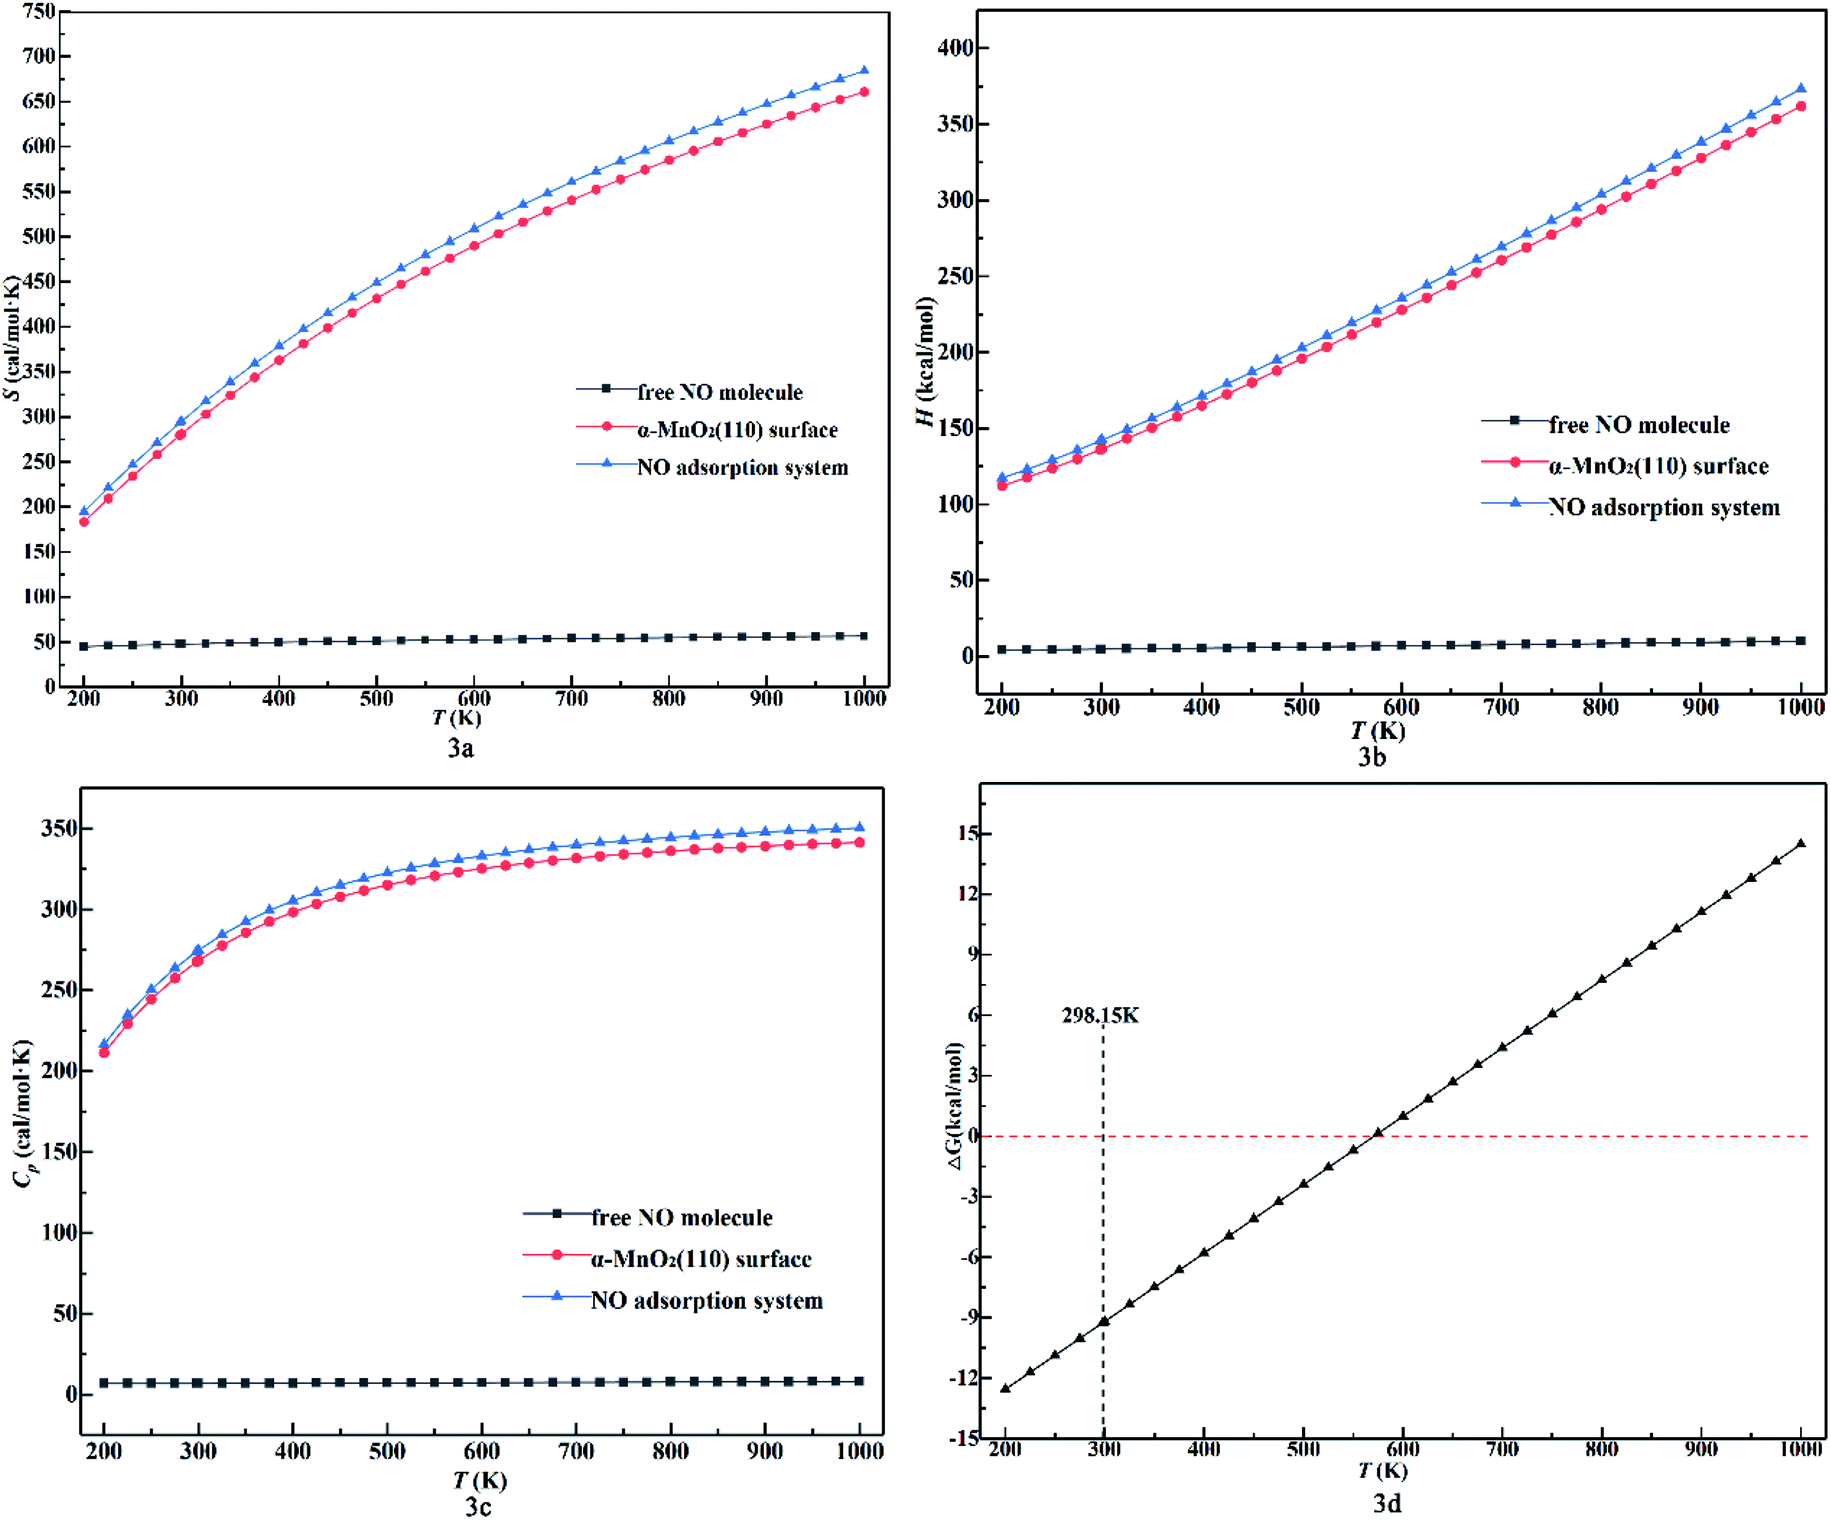 | ||
| Fig. 3 (a) Entropy value. (b) Enthalpy value. (c) Heat capacity value and (d) Gibbs free energy change for NO adsorption system of Model 2B as a function of temperature (kcal mol−1) (the black dashed line represents temperature of 298.15 K, and the red dashed line represents ΔG of 0). | ||
The potential energy diagram for the different pathways of NO adsorption over the (110) surface including the reactants, intermediates and products is shown in Fig. 4. The energies of the optimized structures were relative to the reactants. The desorption of the NO molecule is highly endothermic by 85.05 kJ mol−1, and its dissociation, i.e., N adsorption over the surface and O desorption, is highly endothermic by 384.34 kJ mol−1, 415.42 kJ mol−1 and 379.02 kJ mol−1 for 2A, 2B and 2C, respectively (the adsorption orientation in the N-down mode), while O adsorption over the surface and N desorption are highly endothermic by 718.60 kJ mol−1, 726.12 kJ mol−1 and 715.72 kJ mol−1 for 2D, 2E and 2F, respectively, in the case of the O-down mode. This means that NO prefers to adsorb over the surface rather than dissociate due to the higher energy required to break the covalent bond and lower adsorption energy after geometry optimization of the dissociation model. If an NO molecule was dissociating, it will receive priority in binding N over the surface. Therefore, once NO adsorbs over the surface, it will neither easily desorb nor dissociate from the surface.
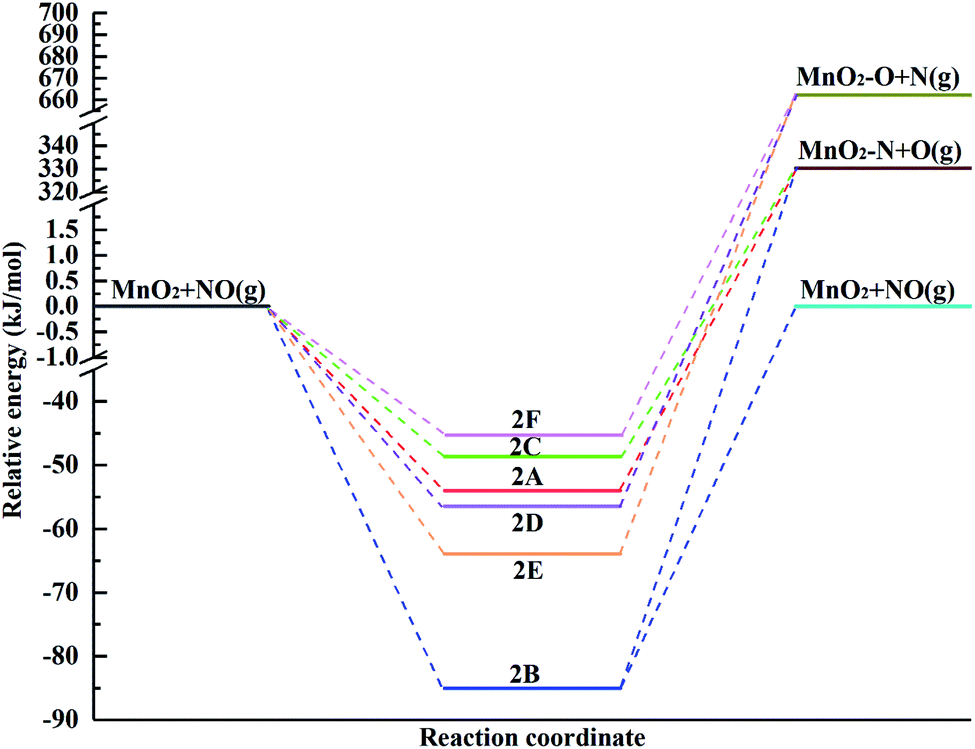 | ||
| Fig. 4 Potential energy diagram for the different pathways for the adsorption of the NO molecule over the α-MnO2(110) surface. | ||
3.2 Adsorption of NO2 molecule over the α-MnO2(110) surface
NO2 is reddish-brow toxic gas, which can act as a raw material in the nitric acid industry.45,46 The parameters for the free NO2 were calculated to be dN–O = 1.211 Å, dNO = 1.211 Å, and θNO2 = 132.95°, in good agreement with that by Greenwood et al.47 The interactions of NO2 with different active sites of the α-MnO2(110) surface were studied. Several possible models of NO2 molecule adsorption over the α-MnO2(110) surface were built and then geometry optimization was performed to determine the optimum model. Besides, the adsorption of NO2 was modeled by attaching the molecule to the surface by its terminal N atom and by its terminal O atom vertically. After geometry optimization, the stable configurations of NO2 over the α-MnO2(110) surface are presented in Fig. 5 and Table 2 exhibits the adsorption energies, bond lengths, distance between the NO2 molecule and the surface, bond angles and net charge-transfer for NO2 adsorption over the α-MnO2(110) surface. It was found that the most stable configuration for NO2 over the surface is 5A, which is on a hollow site that is surrounded by Mns and Oh but approaches Os the closest, and its adsorption energy of −69.74 kJ mol−1 indicates chemisorption via the N-terminal approaching the surface. In contrast, 5D was physisorption with −20.05 kJ mol−1 via the O-terminal approach, with the approach of the closest Of, which is the most stable model on the Mns–Ot bridge site in the physical adsorption process. Also, the angle increases from 132.95° to 135.44° and the bond lengths decrease from 1.211 Å to 1.192 Å in the chemisorption process, while the angle increases to 138.67° and the bond lengths decrease to 1.194 Å and 1.201 Å. This can be influence by the net-charge transfer and adsorption energy. The former indicates that the surface is a receiver of charge from the molecule and that the NO2 molecule forms covalent bonds with an unpaired electron from the 2p orbitals of O and N.
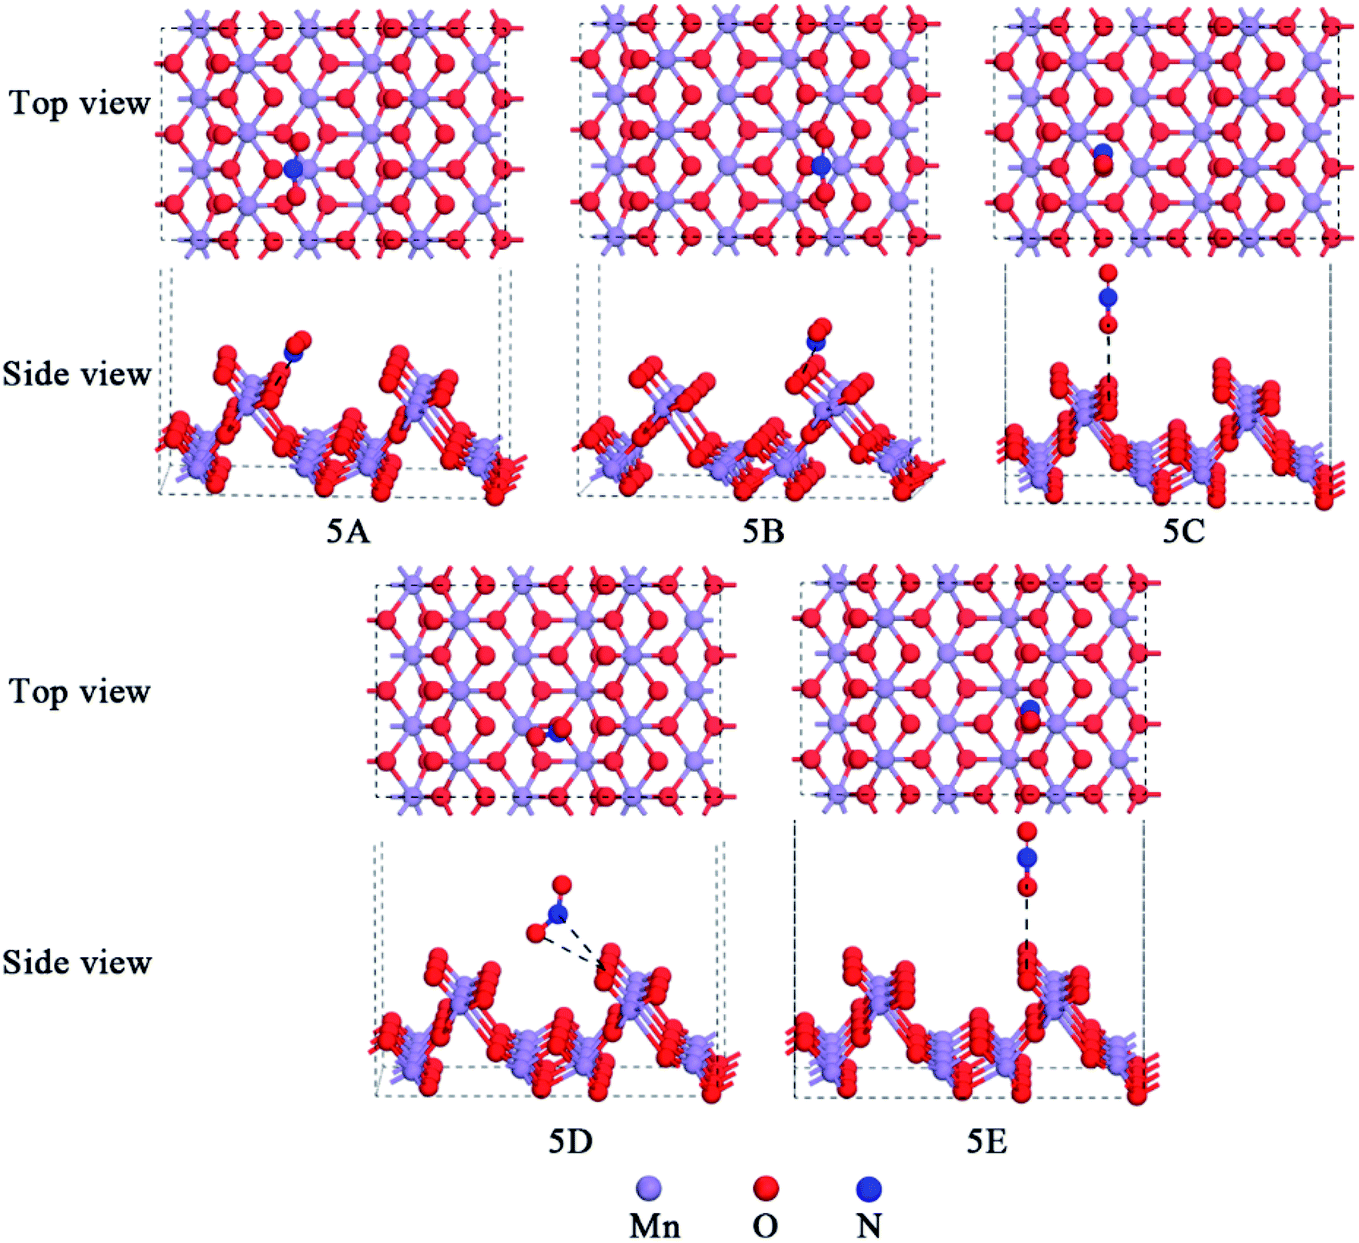 | ||
| Fig. 5 Models of NO2 adsorption over the α-MnO2(110) surface after optimization. | ||
| Model | Eads | LN–X | LO–X | θNO2 | dN–O | dNO |
QNO2 |
|---|---|---|---|---|---|---|---|
| a Eads is the adsorption energy (kJ mol−1); LN–X is the distance between N of the adsorbed NO2 molecule and closest adsorbate atom (Å); LO–X is the distance between O of the adsorbed NO2 molecule and closest adsorbate atom (Å); dN–O and dNO are the bond lengths of the NO2 molecule after adsorption (Å); QNO2 is the net-charge transfer of the NO2 molecule (e); and θNO2 is the bond angle of the adsorbed NO2 molecule (°). |
|||||||
| 5A | −69.74 | 2.335 | — | 135.44 | 1.192 | 1.192 | 0.26 |
| 5B | −56.81 | 1.829 | — | 135.78 | 1.193 | 1.195 | 0.25 |
| 5C | −14.98 | — | 3.355 | 137.44 | 1.197 | 1.200 | 0.17 |
| 5D | −20.05 | 3.097 | 3.172 | 138.67 | 1.194 | 1.196 | 0.21 |
| 5E | −13.08 | — | 3.365 | 136.98 | 1.198 | 1.201 | 0.15 |
It is important to investigate the chemisorption and physisorption for NO2 adsorption over the surface and determine how to influence the properties of the surface based on analysis of the thermodynamic data. Models 5A and 5D were chosen because they are most stable configurations in the process of chemisorption and physisorption, respectively. The temperature and adsorption energy can influence the thermodynamic data. Thus, the DMol3 thermodynamic properties as a function of temperature was plotted, as shown in Fig. 6. In Fig. 6a, the entropy value increases while its growth rate decreases. Also, with an increase in temperature, the growth rate for chemisorption is higher than that for physisorption initially and lower finally. This indicates that the chemical bond formed during chemisorption between the molecule and the surface changes the reactivity, which is the sensitivity to the desorption of the NO2 molecule. In Fig. 6b, enthalpy value and its growth rate increases with an increase in temperature and becomes almost parallel for chemisorption and physisorption. This indicates that the adsorption system adsorbs heat with an increase in temperature. Also, the distance between chemisorption and physisorption is caused by the surface activity relative to the adsorption energy. Fig. 6c shows that the Gibbs free energy increases proportionally with respect to temperature for both chemisorption and physisorption. This indicates that ΔG can be influenced by temperature and the adsorption energy. Under 250 K, the physisorption values are higher than 0, while the chemisorption values are lower than 0 at the same temperature. This reveals that the adsorption energy from the surface influences the reaction to be spontaneous or not at low temperature.
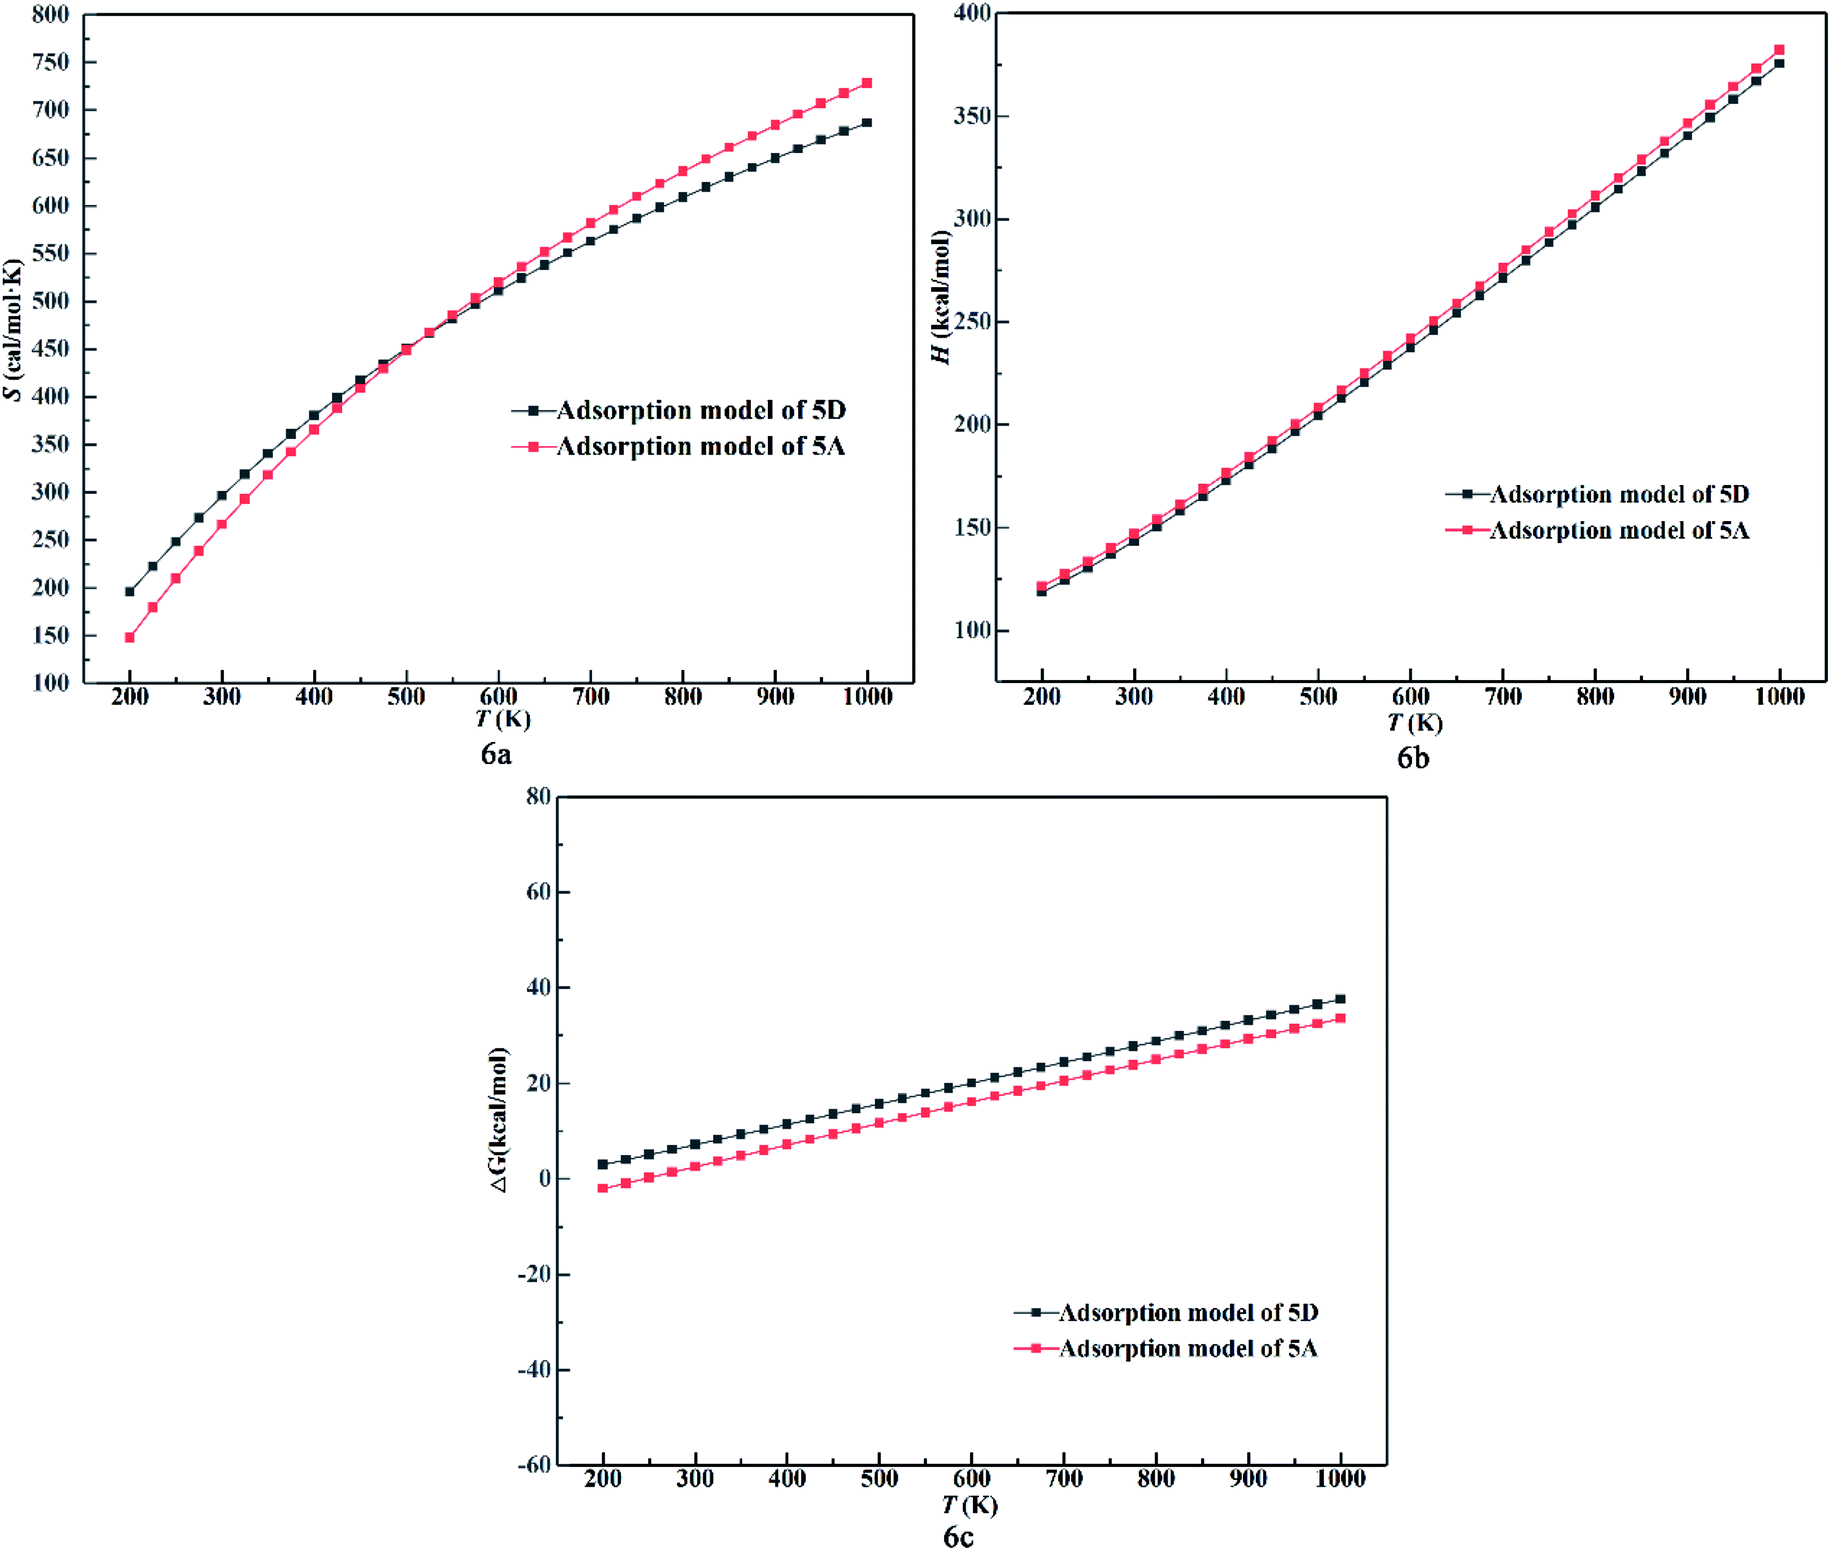 | ||
| Fig. 6 (a) Entropy value, (b) enthalpy value and (c) Gibbs free energy change of 5A and 5D as a function of temperature. | ||
The energy diagram of NO2 adsorption and possible desorption over the surface including reactants, intermediates and products is shown in Fig. 7. The energies of the optimized structures are related to the reactants. The stability of the surface complex follows the order of 5A>5B > 5D > 5C > 5E. In the chemisorption process, the formation of intermediate 5A and 5D in the physisorption process is highly exothermic, indicating that the surface complexes 5A and 5D are the most likely structures to be formed. In the case of 5A and 5B, they exhibit chemisorption with the formation of a chemical bond between the surface and the molecule. Also, the dissociation of the NO molecule adsorbed over the surface occurs via N-down and O desorption, which are highly endothermic by 447.05 kJ mol−1 and 434.12 kJ mol−1, respectively, indicating that this cannot occur. 5C, 5D and 5E exhibit physisorption. The process of forming intermediates 5C and 5E leads to NO2 dissociation of the adsorbed NO via O-down and O desorption, which are highly endothermic by 130.54 kJ mol−1 and 128.64 kJ mol−1, respectively. Due to the higher adsorption energy for the formation of 5D, it will lead to O adsorption and NO desorption with 418.48 kJ mol−1.
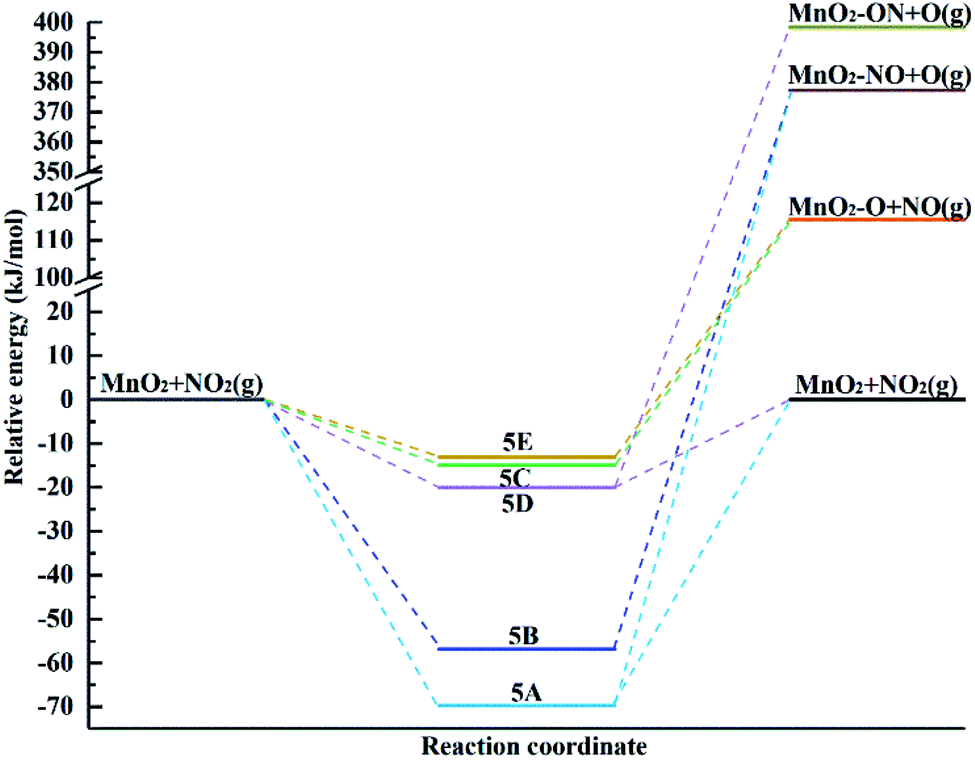 | ||
| Fig. 7 Potential energy diagram for the different pathways for the adsorption of the NO2 molecule over the α-MnO2(110) surface. | ||
3.3 Joint adsorption and temperature effect on the equilibrium constants of NOx
The major components of NOx are NO and NO2 in flue gas. Hence, it is necessary to determine the mechanism of how NO and NO2 jointly adsorbed over the surface influence each other that. Previously, the calculated values of Eads_NO = −85.05 kJ mol−1 and Eads_NO2 = −69.74 kJ mol−1 showed that NO adsorbs over the surface mainly via the chemisorption mechanism. As seen in Fig. 8, when NO and NO2 jointly adsorb over the surface, the adsorption energy is −157.36 kJ mol−1, i.e., the chemisorption effect is enhanced. Also, dNO = 1.118 Å (in NO) and dN–O = dN–O = 1.202 Å (in NO2). In comparison with the isolated adsorption system, the joint adsorption makes NO more stable and NO2 more vulnerable. Meanwhile, the distance between O (in NO) and O (in NO2 from the single bond) is 3.307 Å longer than the bond length of the covalent bond, which cannot form a chemical bond between NO and NO2 in the joint adsorption system. Besides, the joint adsorption energy is higher than the isolated adsorption energy with a value of −2.57 kJ mol−1. This indicates that the adsorption of both NO and NO2 over the surface will enhance the adsorption effect and improve their stability.
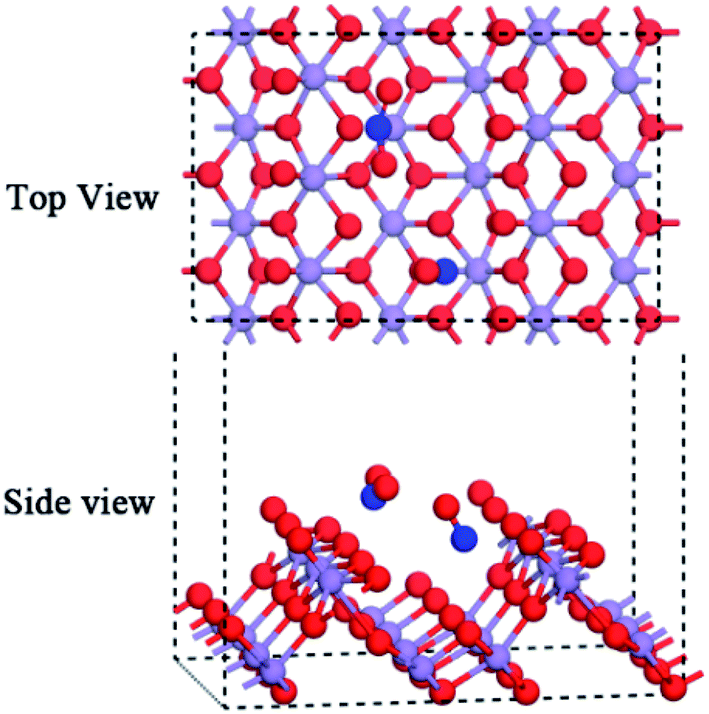 | ||
| Fig. 8 Joint adsorption of NO and NO2 over the α-MnO2(110) surface. | ||
Temperature can influence the conversion rates relate to the equilibrium constants for NOx adsorption over the α-MnO2(110) surface. The equilibrium constants for the adsorption of NO, NO2 and joint adsorption over the α-MnO2(110) surface in the temperature range of 200–1000 K are shown in Fig. 9. The results indicate that all the adsorption systems have positive slopes in the studied temperature range and the equilibrium increases as the temperature increase. The joint adsorption has the largest slope, indicating that temperature has the strongest effect on the equilibrium constant for joint adsorption. Also, a negative value was obtained for the isolated adsorption, but not for the joint adsorption, indicating that the isolated adsorption system can desorb from the surface at a high temperature, while the joint adsorption can enhance the stability of NO and NO2 adsorbed over the surface in the temperature range of 200–1000 K. The equilibrium constants of NO and joint adsorption were reduced by 61.32% and 95.81%, respectively, when the temperature increased from 300 K to 550 K, indicating that the adsorption efficiency of the sorbent of α-MnO2 can decrease greatly at temperatures above 550 K. Moreover, NO2 adsorbed over the surface is easier to desorb from the surface because of its lowest equilibrium constant at the same temperature. The joint adsorption energy was higher than that of the isolated adsorption system because of the van der Waals force among the molecules.
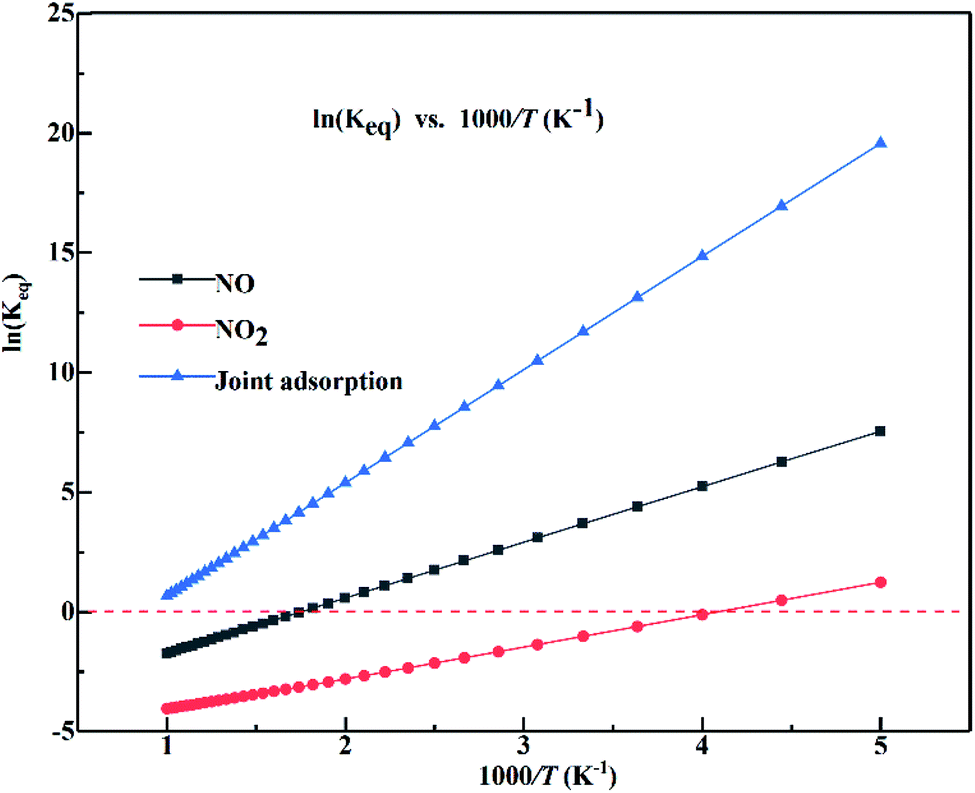 | ||
| Fig. 9 Equilibrium constants for the adsorption of NO, NO2 and their joint adsorption over the α-MnO2(110) surface as a function of temperature (the red dashed line represents ln(Keq) of 0). | ||
4. Conclusion
The detailed adsorption mechanism of NOx over the α-MnO2(110) surface was firstly investigated via a systematic density functional theory study. NO strongly adsorbs over the α-MnO2(110) surface via chemisorption spontaneously. The NO2 molecule adsorbs over the surface via chemisorption and physisorption when its terminal N- and O atoms approach the surface, respectively. Besides, the adsorption energy of NO (−85.053 kJ mol−1) is higher than of NO2 (−69.741 kJ mol−1), indicating that NO adsorbs over the surface initially. The joint adsorption of NOx is more stable than the isolated adsorption system at 200–1000 K according to the analysis of the thermodynamic data of H and S. S can be influenced by exergy and heat. H can be influenced by heat, but heat in the phase transition does not occur in the adsorption system. The values of H and S for NO adsorption over the surface can be influenced greater by the surface rather than NO in the chemisorption process. Besides, the adsorption is spontaneous under 550 K according to the analysis of the thermodynamic data of △G. In the case of NO2, the different adsorption mechanisms from the analysis of H, S and ΔG can be explained as follows: a chemical bond can be formed during chemisorption to change the sensitivity of the surface and H can be influenced by the temperature and the surface, which influences ΔG. The potential energy diagram for the different pathways for the adsorption of NO and NO2 over the α-MnO2(110) surface showed NO adsorption over the surface and NO2 desorption in the temperature of 300–550 K. Also, joint adsorption maintained a positive value for the equilibrium constants in the temperature range of 200–1000 K, indicating that joint adsorption is beneficial for the adsorption of more contamination at high temperature. Besides, the equilibrium constants of NO and joint adsorption were reduced by 61.32% and 95.81%, respectively, when the temperature increased from 300 K to 550 K, indicating that the adsorption efficiency of the α-MnO2 sorbent can decrease greatly at temperatures above 550 K. Hence, it is a better approach to regenerate α-MnO2-based sorbents that have already adsorbed NO, which oxides to NO2 and then heats the adsorption system. Besides, NO and NO2 jointly adsorbed over the surface can remove more NOx at high temperature.Conflicts of interest
There are no conflicts to declare.Acknowledgements
This work was supported by National Key R&D Program of China (2018YFC0213400), National Natural Science Foundation of China (51708266, 51408282 and 21667015), China Scholarship Council (201808535082) and the Analysis and Testing Foundation of Kunming University of Science and Technology.References
- J. Li, H. Chang, L. Ma, J. Hao and R. T. Yang, Catal. Today, 2011, 175, 147–156 CrossRef CAS
.
- L. Wei, S. Cui, H. Guo and X. MaCollege, Mol. Catal., 2018, 445, 102–110 CrossRef CAS
- X. Cheng, Z. Cui, L. Contreras, M. Chen, A. Nguyen and B. Zhao, Jom, 2019, 71, 1897–1903 CrossRef CAS
- D. Tong, Q. Zhang, F. Liu, G. Geng, Y. Zheng, T. Xue, C. Hong, R. Wu, Y. Qin and H. Zhao, Environ. Sci. Technol., 2018, 52, 12905–12914 CrossRef CAS PubMed
- W. Xu, R. Wang, Y. Du, X. Li and X. Xie, New J. Chem., 2019, 43, 2640–2648 RSC
- A. Nikokavoura and C. Trapalis, Appl. Surf. Sci., 2018, 430, 18–52 CrossRef CAS
- J. J. Shan, Z. Yuan, S. R. Zhang, Z. Tong, S. Rouvimov and F. Tao, J. Phys. Chem. C, 2013, 117, 8329–8335 CrossRef CAS
- S. Wang, L. Zhang, L. Wang, W. U. Qingru, F. Wang and J. Hao, Front. Environ. Sci. Eng., 2014, 8, 631–649 CrossRef CAS
- L. Sun, K. Li, Z. Zhang, X. Hu, H. Tian, Y. Zhang and X. Yang, Catal. Sci. Technol., 2019, 9, 1602–1608 RSC
- C. V. Raghunath and M. K. Mondal, Chem. Eng. J., 2017, 314, 537–547 CrossRef CAS
- C. Hu, X. J. Kong, R. Q. Yu, T. T. Chen and X. Chu, Anal. Sci., 2017, 33, 783–788 CrossRef CAS PubMed
- G. Xu, Z. Lin, C. He, D. Ma and Z. Lu, Sens. Actuators, B, 2015, 221, 717–722 CrossRef CAS
- J. Sun, H. Chen, H. Wu, C. Zhou and H. Yang, Can. J. Chem. Eng., 2019, 97, 2498–2504 CrossRef CAS
- N. R. Jaegers, J. K. Lai, Y. He, E. Walter, D. A. Dixon, M. Vasiliu, Y. Chen, C. Wang, M. Y. Hu and K. T. Mueller, Angew. Chem., 2019, 131, 12739–12746 CrossRef
- D. Ma, Y. Liu, B. Huang, L. Wang and F. Dong, New J. Chem., 2019, 43, 15161–15168 RSC
- H. Chen, Y. Wang and Y. Lv, RSC Adv., 2016, 6, 54032–54040 RSC
- E. Cockayne and L. Li, Chem. Phys. Lett., 2012, 544, 53–58 CrossRef CAS
- Y. Liu, L. Yu, M. Sun, G. Diao, B. Lan and G. Cheng, Comput. Theor. Chem., 2014, 1031, 1–6 CrossRef CAS
- X. Tang, W. Chao, S. Liang, Q. Cao, B. Hu and Z. Huang, Appl. Catal., B, 2011, 101, 598–605 CrossRef
- H. U. Pingping, Z. Huang, W. Hua, G. U. Xiao and X. Tang, Appl. Catal., A, 2012, 437–438, 139–148 Search PubMed
- G. A. E. Oxford and A. M. Chaka, J. Phys. Chem. C, 2011, 115, 16992–17008 CrossRef CAS
- X. Song, L. Sun, P. Ning, C. Wang, X. Sun, K. Li and M. Fan, New J. Chem., 2019, 43, 10066–10072 RSC
- S. Xin, N. Ping, W. Chi, L. Kai and S. Xin, Appl. Surf. Sci., 2017, 414, 345–352 CrossRef
- S. Xin, N. Ping, L. Kai, S. Xin, W. Chi and L. Sun, Chem. Eng. J., 2018, 348, 630–636 CrossRef
- J. Luo, C. Hu, X. Meng, J. Crittenden, J. Qu and P. Peng, ACS Sustainable Chem. Eng., 2017, 5, 2255–2264 CrossRef CAS
- G. A. E. Oxford and A. M. Chaka, J. Phys. Chem. C, 2012, 116, 11589–11605 CrossRef CAS
- H. J. Monkhorst and J. D. Pack, Phys. Rev. B: Solid State, 1976, 13, 5188–5192 CrossRef
- B. Delly, J. Chem. Phys., 2000, 113, 7756–7764 CrossRef
- J. A. W. Elliott and C. A. Ward, Langmuir, 1997, 13, 951–960 CrossRef CAS
- K. B. Gyeong, L. Xinxin and B. Paul, Langmuir, 2009, 25, 2781–2789 CrossRef PubMed
- B. Paul and K. B. Gyeong, J. Mol. Model., 2011, 17, 505–514 CrossRef PubMed
- B. Zhang, L. Jing, C. Zheng and C. Ming, Chem. Eng. J., 2014, 256, 93–100 CrossRef CAS
- D. Loffreda, Surf. Sci., 2006, 600, 2103–2112 CrossRef CAS
- C. Shi, L. Sun, H. Qin, X. Wang, L. Ling and J. Hu, Comput. Mater. Sci., 2015, 98, 83–87 CrossRef CAS
- B. R. Deshwal, S. J. Dong, H. L. Si, S. H. Moon, J. H. Jung and H. K. Lee, J. Hazard. Mater., 2008, 150, 649–655 CrossRef CAS PubMed
- I. I. Zakharov and B. F. Minaev, Theor. Exp. Chem., 2011, 47, 93–100 CrossRef CAS
- I. I. Zakharov and B. F. Minaev, J. Struct. Chem., 2012, 53, 1–11 CrossRef CAS
- H. Gao and Z. Liu, RSC Adv., 2017, 7, 13082–13091 RSC
- M. P. Jigato, K. Somasundram, V. Termath, N. C. Handy and D. A. King, Surf. Sci., 1997, 380, 83–90 CrossRef
- O. Leenaerts, B. Partoens and F. Peeters, Phys. Rev. B: Condens. Matter Mater. Phys., 2008, 77, 1–6 CrossRef
- D. D. Wagman, W. H. Evans, V. B. Parker, R. H. Schumm, I. Har-low, S. M. Bailey, K. L. Churney and R. L. Nuttall, The NBS Tables of Chemical Thermodynamic Properties, J. Phys. Chem. Ref. Data, 1982, 1100 Search PubMed
- W. S. Kijlstra, D. S. Brands, H. I. Smit, E. K. Poels and A. Bliek, J. Catal., 1997, 171, 219–230 CrossRef CAS
- Z. Wu, B. Jiang and Y. Liu, Appl. Catal., B, 2008, 79, 347–355 CrossRef CAS
- S. Andreoli, F. A. Deorsola, C. Galletti and R. Pirone, Chem. Eng. J., 2015, 278, 174–182 CrossRef CAS
- K. M. Eid and H. Y. Ammar, Appl. Surf. Sci., 2012, 258, 7689–7698 CrossRef CAS
- M. Breedon, M. J. S. Spencer and I. Yarovsky, J. Phys. Chem. C, 2010, 114, 16603–16610 CrossRef CAS
- N. N. Greenwood and A. Earnshaw, Chemistry of the elements, Butterworth-Heinemann, Oxford, 2nd edn, 1997, p. 1700 Search PubMed
| This journal is © The Royal Society of Chemistry 2020 |