DOI:
10.1039/C9RA09810K
(Paper)
RSC Adv., 2020,
10, 1430-1438
Removal of manganous dithionate (MnS2O6) with MnO2 from the desulfurization manganese slurry†
Received
23rd November 2019
, Accepted 28th December 2019
First published on 8th January 2020
Abstract
Manganese desulfurization has been increasingly explored, but the generated manganous dithionate (MD) by-product affects the valuable use of the desulfurized slurry. In this study, α-MnO2, β-MnO2, γ-MnO2, and δ-MnO2 were prepared for MD removal in desulfurization manganese slurry. Results showed that δ-MnO2 had the best activity among the four because of its porosity and favorable surface properties. The operation conditions showed that 12.00 g L−1 MD can be removed by more than 80.00% under the conditions of 1.4 mol L−1 sulfuric acid, 100 g L−1 δ-MnO2 dosage, and reaction at 90 °C for 3 h. The MD removal with MnO2 followed the decomposition–oxidation pass and direct oxidation–reduction reaction and consequently induced structure destruction and crystalline transfer. MD removal with natural MnO2 ore was also examined, and natural MnO2 ore in the δ type was found to have prominent activity. Thus, this type of natural MnO2 may serve as a good alternative to pure MnO2 for decreasing the cost of MD removal from desulfurization manganese slurry.
1. Introduction
Manganese is a strategic material applied in the metallurgical industry and for some nonferrous applications.1 Traditional manganese metallurgy is a typical hydrometallurgical technology that generally involves ore milling, acid leaching, purification, and final electrowinning as the four main steps.1,2 Given the sustained consumption of high-grade manganese ores, low-grade ore is increasingly being utilized. This condition causes the traditional hydrometallurgical process to be increasingly uncompetitive and uneconomical due to the increasing energy waste and serious environmental issue.
A new manganese-leaching method originally proposed for flue-gas desulfurization and for studying NO removal application has been developed, and thus provides a promising prospect for the manganese industry.3–8 For flue-gas desulfurization, the commonly accepted reaction processes are expressed in eqn (1)–(6).7,9,10 In these reactions, ores containing manganese oxide compounds (MnO2, Mn2O3, Mn3O4) work as the active material to react with SO2.
| |
 | (1) |
| | |
SO2(g) + 1/2O2(g) + H2O(l) → H2SO4(l)
| (2) |
| | |
Mn2O3(s) + H2SO4(l) + SO2(g) → MnSO4(l) + MnO2(s) + H2O(l)
| (3) |
| | |
Mn2O3(s) + H2SO4(l) + SO2(g) → 2MnSO4(l) + H2O(l)
| (4) |
| | |
Mn3O4(s) + 2H2SO4(l) → 2MnSO4(l) + MnO2(s) + H2O(l)
| (5) |
| | |
Mn3O4(s) + 2H2SO4(l) + SO2(g) → 3MnSO4(l) + H2O(l)
| (6) |
During continuous SO2 removal, ore manganese is leached to generate lixivium-containing MnSO4, which is used for electrolytic manganese production (EMP). Compared with traditional acid leaching, desulfurization-based leaching omits sulfuric acid preparation and is energy saving because no calcination is required. Consequently, the technique renovation of manganese metallurgy industry may be greatly developed if traditional acid manganese leaching is replaced by manganese ore-based flue-gas desulfurization.
However, redox reaction between manganese oxide and SO2, especially MnO2, has the inevitable by-product manganous dithionate (MD), which is formed following 7 or 8 dues to incomplete oxidation.10,11 MD significantly restrains electrowinning during EMP.10,12 This process may be result in low product purity and some secondary pollution if the final product is MnSO4. Therefore, the MD of manganese ore-based desulfurization must be managed to determine the economic value of this technology and further broaden its application.
| | |
MnO2(s) + 2H2SO3(l) → MnS2O6(l) + 2H2O(l)
| (7) |
or
| | |
MnO2(s) + 2SO2(g) → MnS2O6(l)
| (8) |
A low MD concentration (<6 g L−1) of desulfurized manganese slurry obtained may be due to the following two different aspects: (1) the formation suppression during desulfurization and (2) desulfurized slurry MD removal. Regulating the acidity of manganese slurry, inlet SO2 concentration, and manganese composition can reduce MD formation.13–15 However, we found that controlled MD formation is usually achieved at the expense of desulfurization performance and/or manganese leaching.16 Consequently, a highly efficient MD removal method must be further explored.
Theoretically, MD can be decomposed into MnSO4 and SO2 at a relatively high temperature (>140 °C) or strong acid condition (eqn (9)).4 Qu et al. studied manganese leaching with MnS2O6 and they found that S2O62− can be somehow oxidized by MnO2 (eqn (10)).17 However, studies on the MD elimination using MnO2 is still superficial, primarily focusing on the exploration of technical conditions. The reaction mechanism and kinetics remain unclear. Moreover, laboratory studies commonly use pure MnO2. Thus, the significance of research results for industrial application remains to be verified.
| | |
MnS2O6(l) → MnSO4(l) + SO2(g)
| (9) |
| | |
MnS2O6(l) + MnO2(s) → 2MnSO4(l)
| (10) |
In this study, four types of MnO2 with different crystalline structures were prepared by coprecipitation and hydrothermal methods to eliminate MD from desulfurized manganese slurry. The susceptibility and influences of MnO2 crystalline, dosage, slurry acidity, and reaction temperature on MD removal were tested and discussed. The reaction mechanism of MD removal with MnO2 was proposed on the basis of the experimental phenomenon and characterization before and after the reaction. Finally, the applicability of natural MnO2 for MD removal was verified. The results showed good confirmation of the entire study.
2. Experimental
2.1 Materials and methods
MD-containing slurry was self-made using the pilot-scale system of manganese ore slurry-flue-gas desulfurization. The raw slurry had a pH of 1.6 and contained 15.35 g L−1 Mn2+ ion and 12.00 g L−1 MnS2O6. The KMnO4 (AR), MnSO4·H2O (AR), (NH4)2S2O8 (AR), and H2SO4 (98%) were bought from Chron Chemicals (Chengdu, China) without further treatment. Natural MnO2 ore was shipped from the Gabonese Republic. Its main components based on the ICP-OES analysis after digestion are listed in Table 1.
Table 1 Analysis of the natural manganese ore used (wt%)
| Components |
Mn |
Ca |
Mg |
Co |
| Content |
40.35 |
0.72 |
3.41 |
0.025 |
| Components |
Ni |
Zn |
Fe |
Cu |
| Content |
0.025 |
0.001 |
0.010 |
0.0032 |
2.2 Preparation of different MnO2
α-MnO2, γ-MnO2, and δ-MnO2 were prepared via coprecipitation. Specifically, 2.18 g of KMnO4 (AR, Chron Chemicals, Chengdu, China) and 3.50 g of MnSO4·H2O (AR, Chron Chemicals) were dissolved in 50 mL of deionized (DI) water (the mole ratio of KMnO4/MnSO4·H2O was 2/3). A new beaker was then preloaded with 100 mL of DI water and placed in an 80 °C water bath. The prepared MnSO4 and KMnO4 solutions were poured into the beaker at the same time, and the mixture was continuously mixed with a magnetic stirrer for 2 h. When the reaction process was completed, the obtained liquid–solid mixture was naturally cooled to room temperature and followed with repeated DI water washing until the pH of filtrate was almost 7. Finally, the mixture was dried at 80 °C for 12 h, and the obtained subparticle was the α-MnO2. Compared with α-MnO2 preparation, γ-MnO2 synthesis involved a relatively lower thermostatic reaction temperature of 40 °C. For the preparation of δ-MnO2, a different KMnO4/MnSO4·H2O ratio of 4/3 was used. This solution was prepared with 2.18 g of KMnO4 and 1.75 g of MnSO4·H2O dissolved in 50 mL of DI water and was used as reactants for the following synthesis process.
The hydrothermal method was used to prepare β-MnO2 by using the precursors MnSO4·H2O and (NH4)2S2O8 (AR, Chron Chemicals). First, 8.45 g of MnSO4·H2O and 11.41 g of (NH4)2S2O8 were separately dissolved in 80 mL of DI water as substitute solution. For β-MnO2 preparation, MnSO4·H2O solution was slowly instilled into (NH4)2S2O8 and allowed to react for 20 min with continuous magnetic stirring. Subsequently, the mixture was transferred to PTFE jars and subjected to a 12 h hydrothermal reaction at 140 °C. Subsequently, the mixture was naturally cooled to room temperature, and the following treatments, including filtration, washing, and drying, were performed similar to the coprecipitation method.
2.3 Removal of MD
Approximately 50 mL of desulfurized solution was placed into a 100 mL conical flask and then added with the calculated volume of sulfuric acid and MnO2 or manganese ore. The flask was sealed with parafilm and placed in a thermostatic water bath for MD removal with continuous magnetic stirring. When the reaction was completed, the reaction mixture was rapidly filtered, and the MD concentration of the filtrate was measured to calculate the removal efficiency of MD (eqn (11)), where η (%) is the of MD removal efficiency, and C0 and Ci (g L−1) are the initial and final MD concentrations, respectively.
MD concentration before and after the removal reaction was determined by the distillation-iodometric method with some improvements.18 Specifically, 1.0 mL of the filtrate was placed into a triangular flask and then added with 10.0 mL of 1+1 H2SO4. The flask was heated for distillation until acid mist formed and then cooled down naturally. The two-stage standard iodine solution (0.0100 ± 0.0005 mol L−1) was used for SO2 adsorption, and highly pure nitrogen gas was used as carrier gas during the entire distillation. After the entire reaction, residual iodine was titrated using standard sodium thiosulfate (0.0100 ± 0.0005 mol L−1). To calculate MD concentration, a blank test was needed, which involved the use of the same volume of DI water in place of the sample. The blank was subjected to the same treatment and titration. For the blank test, the titration volume of sodium thiosulfate was V0 (mL), and the volume of sodium thiosulfate used for the sample titration was V1 (mL). The concentration of MD was calculated as in eqn (12), where CMD is the concentration of MD (g L−1), V is the sample volume used for test (mL), c is the concentration of sodium thiosulfate (mol L−1), and m is the molar mass of MD (215.07).
| |
 | (11) |
| |
 | (12) |
2.4 Characterization
The crystallographic form of the prepared MnO2 and natural manganese ore was analysed using an X-Pert PRO MPD diffractometer (Panalytical, NL) employing Cu Kα radiation at 30 kV and 20 mA. The step-scanning run over 2θ ranged at 10–80°, and crystalline phases were identified by the reference data from the International Center for Diffraction Data (JCPDs). Scanning electron microscopy (JEOL 7100F, Japan) with an acceleration voltage of 15.0 kV was used for the morphology characterization of the prepared MnO2. SEM images with different magnifications were captured to obtain as much information as possible. X-ray photoelectron spectroscopy (XSAM-800, Kratos Co., UK) with Al (1486.6 eV) under ultra-high vacuum at 12.0 kV and 15.0 mA was applied to determine MnO2 surface chemistry before and after MD removal. Energy calibration was performed by recording the core level spectra of Au 4f7/2 (84.0 eV) and Ag 3d5/2 (368.30 eV).
3. Results and discussion
3.1 MnO2 preparation and characterization
Fig. 1 presents the SEM images of the prepared four different MnO2. α-MnO2 showed a homogeneous nanorod structure with a length of approximately 200–400 nm. β-MnO2 represented a similar structure to that of α-MnO2, but its diameter was relative larger and the length extended to range of 600–800 nm. In contrast with the above two compounds, γ-MnO2 and δ-MnO2 resembled a nanosphere structure. γ-MnO2 nanosphere ranged from 200 nm to 500 nm in diameter and seemed to be assembled by organized short cylindrical nanorods radiating outward. The δ-MnO2 sphere was likely to be constructed by a multi-layer nanowire, and the sphere diameter was relatively large ranging at approximately 500–800 nm. The morphology characterization of the prepared MnO2 was consistent with that in previous studies,19,20 confirming the preparation method used in this study. The XRD patterns in the Fig. S1† confirmed the classification, and the patterns of α-MnO2, β-MnO2, γ-MnO2, and δ-MnO2 were highly concordant with their reference data JCPDS 44-0141 (α-MnO2), JCPDS 24-0735 (β-MnO2), JCPDS 14-0644 (γ-MnO2), and JCPDS 80-1098 (δ-MnO2).21–23
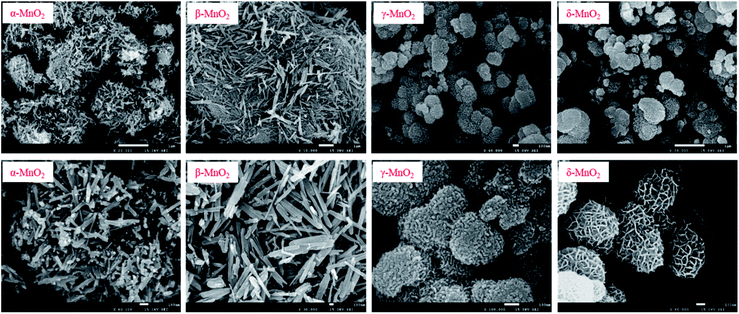 |
| | Fig. 1 SEM images of the MnO2 prepared with different crystalline. | |
To identify the composition and surface chemistry, we carried out X-ray photoelectron spectroscopy (XPS) characterization of all four types of MnO2. Fig. S2† shows the high-resolution Mn 2p spectrum, and the Mn 2p3/2 characteristic peaks located close to 642.0 eV. This result identified that the manganese is typically Mn(IV)O2, even though some differences occurred causing energy peak shift.23 Fig. 2 illustrates the high-resolution O 1s spectrum. The characteristic peaks with a binding energy range of 529–530 eV corresponded with the lattice oxygen (OL). Peaks with 531–532 eV binding energies were assigned to the defect oxide or surface oxygen ions (OA), and those higher than 533 eV were due to the adsorbed water (OH).23–25 Compared with that of the three other samples, the O 1s spectrum of β-MnO2 showed a shift to the relatively lower binding energy region, which may be attributed to hydrothermal reaction and is commonly observed in previous works.23,26 Table 2 lists the OA contents of the α-, β-, γ-, and δ-MnO2, which were 46.96%, 29.74%, 42.67%, and 43.32%, respectively. Theoretically, a high content of surface OA indicates that the sample has strong oxidizability because of its high mobility for the potential oxidation reaction.27 Thus, the oxidation susceptibility of the four types of MnO2 followed the order α-MnO2 > γ-MnO2 > δ-MnO2 > β-MnO2. Notably, the liquid–solid reaction was a multi-factorial process. Thus, effective contact surface area and interfacial mass transfer and must be analysed to make a comprehensive conclusion.
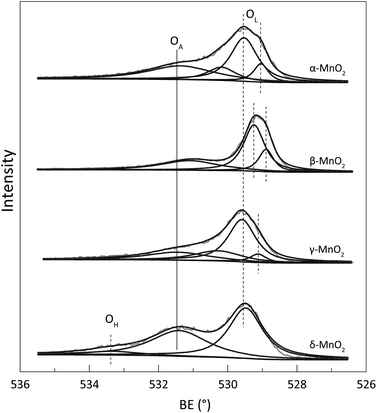 |
| | Fig. 2 The O 1s spectrum of the prepared α-, β-, γ- and δ-MnO2. | |
Table 2 The surface oxygen chemistry based on the O 1s manipulationa
| Samples |
OL |
OA |
OH |
| BE |
% |
BE |
% |
BE |
% |
| NA: not detected. |
| α-MnO2 |
529.04–529.53 |
53.05 |
530.18–531.36 |
46.96 |
NA |
NA |
| β-MnO2 |
528.89–529.24 |
70.26 |
531.10 |
29.74 |
NA |
NA |
| γ-MnO2 |
529.12–529.59 |
57.33 |
530.27–531.45 |
42.67 |
NA |
NA |
| δ-MnO2 |
529.48 |
50.80 |
531.40 |
43.32 |
533.34 |
5.88 |
3.2 MD removal with different MnO2
Fig. 3 demonstrates the activity of four different MnO2 for the MD removal from the true desulfurized manganese slurry. The activity of four different MnO2 used for the MD removal followed the sequence δ-MnO2 > α-MnO2 > β-MnO2 > γ-MnO2. δ-MnO2 showed the best activity the MD oxidation under 1.4 mol L−1 sulfuric acid at 60 °C, with an MD removal efficiency of 25.63%.
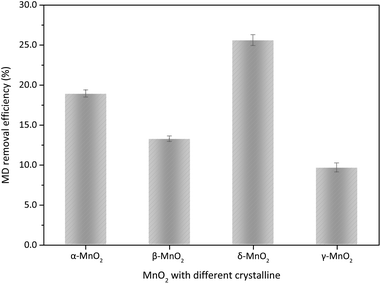 |
| | Fig. 3 The MD removal with different type of MnO2 (reaction conditions: 8.00 g L−1 MD, 1.4 mol L−1 sulfuric acid, 100 g L−1 of MnO2 addition, reacted at 60 °C for 3 h). | |
The valence of sulphur in MD is a transient state V, S2O62− removal with MnO2 is an oxidation process, and the activity of surface oxygen directly relate to the removal performance. As shown in Table 2, the OA content of four different MnO2 followed the order β-MnO2 < γ-MnO2 < δ-MnO2 < α-MnO2. If the surface OA of MnO2 is key factor to MD removal, α-MnO2 should show the relatively best and β-MnO2 exhibit the relatively worst MD removal performance. As shown in Fig. 3, the δ-MnO2 demonstrated relative lower surface OA compared with α-MnO2, while it showed the highest MD removal efficiency. This finding indicates that surface OA content was not the limiting factor for MD removal of four different MnO2, it should be the effective surface area and/or interfacial mass transfer, which greatly affected the activity of MD removal.
MnO2 with different crystallographic structures show different tunnel structures; α-MnO2 and β-MnO2 have [2 × 2] and [1 × 1] 1D tunnel structures, respectively; γ-MnO2 has [1 × 1] and [1 × 2] alternating 1D structure, and α-MnO2 has a layered structure.19,28 For the three types of 1D structure MnO2, their average chemical binding of Mn–O were 1.98 Å (α-MnO2), 1.88 Å (β-MnO2) and 1.91 Å (γ-MnO2).23 This finding indicates that α-MnO2 has the best surface oxygen mobility among the structures.29 Moreover, the [2 × 2] tunnel structure has stronger oxidation susceptibility than the [1 × 1] 1D tunnel structure.23,30 These findings, including the experimental results in this study, may be used to explain why δ-MnO2 had relatively better activity for MD removal than γ-MnO, β-MnO2 and γ-MnO2. In contrast with α-, β-, and γ-MnO2, δ-MnO2 had a layered structure and showed a reticular, hollow nanosphere morphology (Fig. 1). Zhang et al. characterized δ-MnO2, showing the relative largest BET surface area among the four types of MnO2.20,23 This result indicates that δ-MnO2 may provide more contacted reaction surface area and much more active sites could be exposed for interfacial reaction compared with the other forms. Moreover, the detected surface OH forecasted that δ-MnO2 had better hydrophilia, which results in better molecular diffusion and mass transfer in aqueous reaction system. Therefore, we can conclude that the better MD removal performance of δ-MnO2 is attributed to the synergy work of the relative high OA content, improved porosity, and hydrophilia.
3.3 Influences of reaction parameters
In this section, the δ-MnO2 that has the best reaction activity was used to discuss the influences of operation parameters on MD removal, including the reaction temperature, duration time, sulfuric acid content, MnO2 dosage and MD concentration.
3.3.1 Reaction temperature. The operation conditions, including initial MD concentration, sulfuric acid content, and δ-MnO2 addition, were kept constant. The influence of reaction temperature on the MD removal was discussed. As shown in Fig. 4, MD removal efficiency gradually increased with increased reaction temperature, indicating that the temperature significantly affected MD removal. At 60 °C, 25.63% of MD decomposed after 3 h of reaction. This value increased to 95.07% with increased temperature to almost 100 °C. Under high reaction temperature, the high molecular kinetic energy of reactants increased the probability of effective collision. Moreover, the MD molecules will become unstable under high reaction temperature and is active to react with δ-MnO2. Considering economy and practical operation, the optimum reaction temperature should be 90 °C, and more than 85.00% of the MD could be removed.
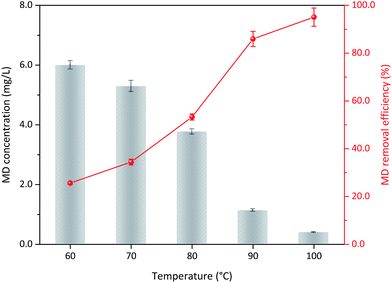 |
| | Fig. 4 The influence of reaction temperature on the MD removal with δ-MnO2 (reaction conditions: 8.00 g L−1 MD, 1.4 mol L−1 sulfuric acid, 100 g L−1 δ-MnO2, reacted 3 h). | |
3.3.2 Duration time. The operation conditions, including initial MD concentration, sulfuric acid and δ-MnO2 addition, and reaction temperature, were kept constant. The results confirmed that MD removal changed with duration time. As the reaction continued, MD concentration gradually decreased (Fig. 5). Only 51.68% of the MD could be decomposed within 1 h of reaction, and this value increased to 85.94% at 3 h reaction time. Further prolonged reaction time was not recommended even though the removal efficiency also further increased. The reduced reaction rate may be due to (1) decreased reactant concentration and (2) the evolution of surface physicochemical properties.31 With continuous reaction, the concentration of reactants gradually decreased, slowing mass transfer. Moreover, the reaction between the δ-MnO2 and MD may also result in structure destruction and surface chemistry, such as layered structure, crystal structure, and composition of surface oxygen. δ-MnO2 and MD worked synergistically to gradually reduce the reaction rate. Therefore, a too long reaction time only decreases production efficiency for industrial application. The recommend duration time is not more than 3 h.
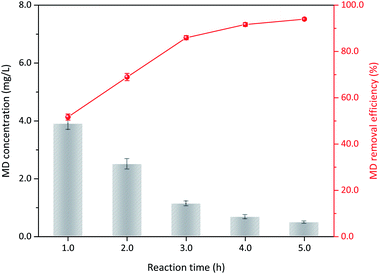 |
| | Fig. 5 The influence of reaction time on MD removal (reaction conditions: 8.00 g L−1 MD, 1.4 mol L−1 sulfuric acid, 100 g L−1 δ-MnO2, reacted at 90 °C). | |
3.3.3 Sulfuric acid concentration. The operation conditions, including initial MD concentration, δ-MnO2 addition, and reaction temperature, was maintained constant to determine the effect of sulfuric acid addition on MD removal. At 1.0 mol L−1 acid concentration, the removal efficiency of MD was 61.34% after 3 h of reaction and only slightly increased at an acid content of 1.2 mol L−1 (66.32%, Fig. 6). Subsequently, MD removal efficiency increased with increased sulfuric acid content from 1.2 mol L−1 to 1.4 mol L−1. The removal efficiency clearly increased from 66.32% to 85.95%. Subsequently, further addition of sulfuric acid addition was unnecessary, and the MD removal efficiency remained relatively stable. H+ reportedly plays an important role in the δ-MnO2 redox reaction, and a strong H+ atmosphere can accelerate the oxidability of MnO2.32 For the MD removal using MnO2, the MnO2 was reduced to Mn2+, and the redox potential between them (EMnO2/Mn2+) could be calculated as in eqn (13).32,33 Therefore, the increased acidity can promote the reduction potential of MnO2, but a concentration higher than 1.4 mol L−1 is unnecessary.| |
EMnO2/Mn2+ = 1.229 − 0.118pH − 0.0296![[thin space (1/6-em)]](https://www.rsc.org/images/entities/char_2009.gif) lg lg![[thin space (1/6-em)]](https://www.rsc.org/images/entities/char_2009.gif) CMn2+ CMn2+
| (13) |
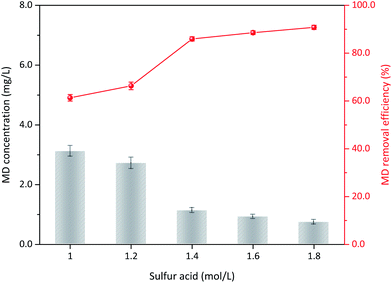 |
| | Fig. 6 The influence of sulfuric acid content on the MD removal (reaction conditions: 8.00 g L−1 MD, 100 g L−1 δ-MnO2, reacted at 90 °C for 3 h). | |
3.3.4 δ-MnO2 dosage. The operation conditions, including initial MD concentration, sulfuric acid concentration, and reaction temperature, were kept constant. The influence of δ-MnO2 dosage on the MD removal is illustrated in Fig. 7. When 60 g L−1 δ-MnO2 was added, the MD concentration was reduced from 8.00 g L−1 to 2.54 g L−1, showing 68.51% MD removal efficiency. The final concentration number decreased to 1.13 g L−1 (85.95%) with increased δ-MnO2 to 100 g L−1. Subsequently, only limited improvement was observed with further increased δ-MnO2 dosage. With increased δ-MnO2 addition, further active sites can participate to remove the MD, and a high MD removal efficiency is obtained.34 Notably, the initial concentration of MD, acidity, and temperature were constant, which means MD could took part in the surface reaction had a maximum, excess δ-MnO2 supply cannot improve the reaction efficiently. Consequently, 100 g L−1 δ-MnO2 addition content for MD removal is recommended in this study.
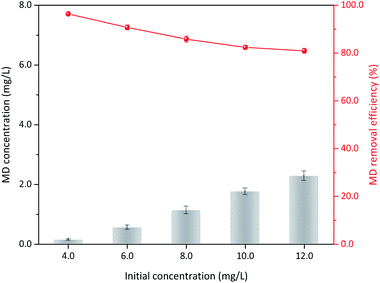 |
| | Fig. 7 The influences of initial MD concentration on MD removal (reaction conditions: 1.4 mol L−1 sulfuric acid, 100 g L−1 δ-MnO2, reacted at 90 °C for 3 h). | |
3.3.5 Initial MD concentration. Sulfuric acid addition, δ-MnO2 dosage, and reaction temperature were kept constant. Varied MD removal with initial concentration was also considered. Approximately 96.40% MD could be removed when the initial concentration was 4.00 g L−1, and the apparent removal efficiency only showed a limited reduction with increased initial MD concentration (Fig. 8). Under the conditions of 1.4 mol L−1 sulfuric acid, 100 g L−1 δ-MnO2 dosage, and 90 °C reaction temperature, up to 10.00 g L−1 MD could be reduced to less than 2.00 g L−1. The corresponding removal efficiency was only decreased 15.44% to 80.96% when the initial concentration of MD increased three times to 12.00 g L−1. This finding indicated that δ-MnO2 had prominent stability and activity for MD removal under the optimized reaction conditions. Furthermore, the MD removed per unit δ-MnO2 could be the best proof, which conspicuously raised from 38.6 mg L−1 g−1 to 97.1 mg L−1 g−1 δ-MnO2 when the MD concentration was changed from 4.00 g L−1 to 12.00 g L−1 (Table S1†). The gradually reduced removal efficiency was attributed to the significant increase in initial MD concentration.
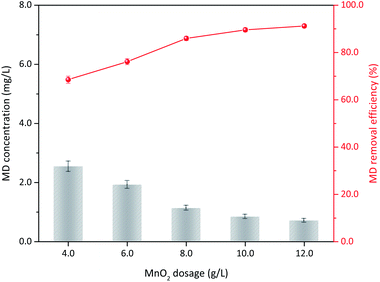 |
| | Fig. 8 The influences of δ-MnO2 dosage on the MD removal (reaction conditions: 8.00 g L−1 MD, 1.4 mol L−1 sulfuric acid, reacted at 90 °C for 3 h). | |
3.4 Mechanism analysis of MD removal
Fig. 9 shows the influence of temperature and acid concentration on the MD removal without δ-MnO2 addition. Under 1.4 mol L−1 sulfuric acid and temperature higher than 60 °C, a part of MD could be decomposed without δ-MnO2 addition. Fig. 4 reveals that δ-MnO2 played a critical role for MD removal in the desulfurized manganese slurry. The influence of sulfuric acid content represented in Fig. 9b and 6 showed almost the same conclusion. Without any δ-MnO2 addition, MD removal could be due to the MD self-decomposition under strong acidity condition. We found that the reaction products could discolour the C.1. Acid Violet 7 (18055) using the high-purity nitrogen as carry gas, which illustrated the formation of SO2 in the strong acidity and high temperature condition (eqn (10)).
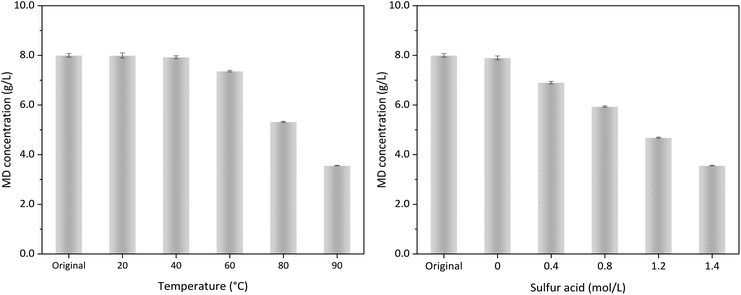 |
| | Fig. 9 The MD removal (a) in 1.4 mol L−1 sulfuric acid at different temperature, and (b) a constant temperature at 90 °C with different sulfuric acid dosage. | |
Fig. 10 shows the SEM images of δ-MnO2 before and after MD removal. The uniform nanomesh-structure of δ-MnO2 was clearly destroyed and presented a new analogous fusion surface after MD removal.35 The destroyed structure followed clear agglomeration because the particle size of the used δ-MnO2 residue was big. Fig. 11 illustrates the XRD patterns of the new δ-MnO2 and reacted residue. The characteristic peaks belonging to δ-MnO2 almost disappeared after MD removal. Alternatively, some characteristic peaks corresponding to α-MnO2 were detected. This transformation indicated that MD removal resulted in the destruction of the 2D layered structure of δ-MnO2 and consequently transferred to the [2 × 2] 1D α-MnO2.35 The MD removal shown in Fig. 3 indicates that the reaction activity of the four different MnO2 structures followed order δ-MnO2 > α-MnO2 > γ-MnO2 > β-MnO2. This result indicates that the newly formed α-MnO2 could remain effective for MD removal even though its activity is relative worse. This transformation of microcrystalline structure may also explain the influence of duration time shown in Fig. 5. The newly formed α-MnO2 partially resulted in the gradually reduced reaction rate.
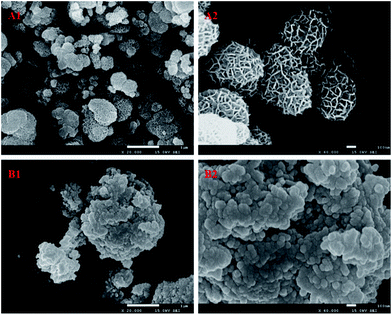 |
| | Fig. 10 The SEM image of δ-MnO2 before (A1 and A2) and after (B1 and B2) the MD removal. | |
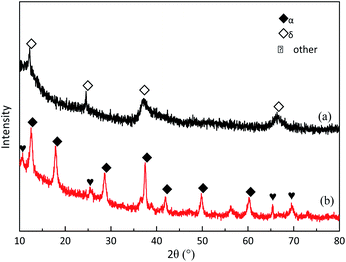 |
| | Fig. 11 The XRD patterns of δ-MnO2 before (a) and after (b) the MD removal. | |
Based on the characterization, including SEM and XRD before and after the MD removal reaction, and considering previous results, the MD removal with MnO2 may occur via the two following mechanisms. First is the decomposition–oxidation pathway (DO), in which MD is transferred to dithionic acid (H2S2O6, eqn (14)) and then decomposed to H2SO4 and SO2 (eqn (15)) the high temperature and strong acidity.36 The generated SO2 further reacts with MnO2 to generate MnSO4 (eqn (1)). Second is the direct oxidation–reduction (OR) reaction between the MD and MnO2, which could be expressed by two half-reactions; the reduction half-reaction involves Mn(IV)O2 obtaining two electrons to the divalent state (Mn(II)) (eqn (16)),37 and the oxidation half-reaction involves S2O62− donating electrons to SO42− (eqn (17)). The two half-reactions could be integrated into eqn (18), and its Gibbs free energy was calculated to be −279.70 kJ mol−1.
| | |
MnS2O6(l) + H2SO4(l) → H2S2O6(l) + MnSO4(l)
| (14) |
| | |
H2S2O6(l) → H2SO4(l) + SO2(g)
| (15) |
| | |
MnO2(s) + 4H+ + 2e− → Mn2+ + 2H2O(l) (reduction half)
| (16) |
| | |
S2O62− + 2H2O → 2SO42− + 4H+ + 2e− (oxidation half)
| (17) |
| |
 | (18) |
3.5 MD removal with natural manganese oxide ore
On the basis of the aforementioned results, MD removal with natural manganese oxide ore was carried out under relative optimum conditions. The XRD analysis indicated that MnO2 in the ore was primarily the δ type (Fig. S3†), which had the best activity for MD removal among the four types of MnO2 mentioned in this study. For the feasibility test, the operation conditions of 8.00 g L−1 MD, 1.4 mol L−1 sulfuric acid, 90 °C reaction temperature, and 3 h of reaction were used. MD removal at different ore dosages is shown in Fig. 12. MD removal showed a similar tendency with the synthesized δ-MnO2. When 100 g L−1 ore were added, the final MD concentration was only 1.78 g L−1 (corresponded MD removal efficiency was 77.74%), which was even lower than the same content of pure δ-MnO2 used. Increasing the dosage of MnO2 ore slowly increased the removal efficiency. This finding indicated that natural MnO2 ore is suitable for MD removal from desulfurization manganese slurry. In industrial applications, the desulfurization slurry should be further filtered before MD removal, and the MD removal residue can be returned to the front desulfurization section.
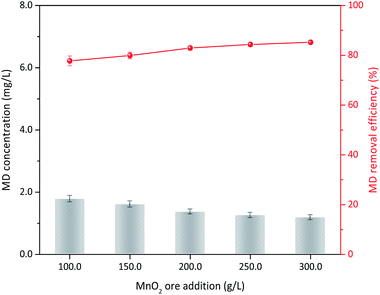 |
| | Fig. 12 MD removal with the natural MnO2 ore (reaction conditions: 8.00 g L−1 MD, 1.4 mol L−1 sulfuric acid, reacted at 90 °C for 3 h). | |
4. Conclusions
α-MnO2, β-MnO2, γ-MnO2, and δ-MnO2 were prepared for MD oxidation removal in desulfurized manganese slurry. Results showed that δ-MnO2 had the best oxidation activity due to its porosity and favorable surface properties. The optimal conditions were 1.4 mol L−1 sulfuric acid, 100 g L−1 δ-MnO2 dosage, and reaction at 90 °C for 3 h, which can remove more than 80.00% of MD with an initial MD concentration of 12.00 g L−1. The MD removal with MnO2 followed the DO pass and direct OR reaction, and consequently induced structure destruction and crystalline transfer. MD removal with natural MnO2 ore was also performed, and the natural MnO2 ore in the δ type showed prominent activity. Thus, this type of natural MnO2 ore can be a good alternative to pure MnO2 for decreasing the cost of MD removal from desulfurization manganese slurry.
Conflicts of interest
There are no conflicts to declare.
Acknowledgements
This work was funded by the National Key Research and Development Program of China (2018YFC0213405), and the China Postdoctoral Science Foundation (2019M653408).
References
- K. Hagelstein, J. Environ. Manage., 2009, 90, 3736–3740 CrossRef CAS PubMed.
- N. Duan, Z. Dan, F. Wang, C. Pan, C. Zhou and L. Jiang, J. Cleaner Prod., 2011, 19, 2082–2087 CrossRef.
- W. Sun, S. Su, Q. Wang and S. Ding, Hydrometallurgy, 2013, 133, 118–125 CrossRef CAS.
- N. Chow, A. Nacu, D. Warkentin, H. Teh, I. Aksenov and J. W. Fisher, Mining, Metallurgy & Exploration, 2012, 29, 61–74 Search PubMed.
- W. Ye, Y. Li, L. Kong, M. Ren and Q. Han, Trans. Nonferrous Met. Soc. China, 2013, 23, 3089–3094 CrossRef CAS.
- W. Sun, S. Ding, S. Zeng, S. Su and W. Jiang, J. Hazard. Mater., 2011, 192, 124–130 CrossRef CAS.
- J. D. Miller and R. Wan, Hydrometallurgy, 1983, 10, 219–242 CrossRef CAS.
- Y. Chen, Y. Li, X. Cao, J. Li, S. Tang, W. Ye and X. Zhang, Korean J. Chem. Eng., 2019, 36, 1082–1089 CrossRef CAS.
- Y. F. Li, H. Ye, C. Cao and L. N. He, Adv. Mater. Res., 2011, 233–235, 532–536 CAS.
- Z. You, G. Li, Y. Zhang, Z. Peng and T. Jiang, Hydrometallurgy, 2015, 156, 225–231 CrossRef CAS.
- R. E. Connick and Y. Zhang, Inorg. Chem., 1996, 35, 4613–4621 CrossRef CAS.
- C. B. Ward, US Pat. 7951282, 2011.
- C. Ward, C. Cheng and M. Urbani, Manganese-from waste to high-tech material, Publications of the Australasian Institute of Mining and Metallurgy, 2004, vol. 2, pp. 241–246 Search PubMed.
- L. M. Petrie, Appl. Geochem., 1995, 10, 253–267 CrossRef CAS.
- Q. Wu, D. Zhang, P. Ning, J. Zhang, S. Li, C. Li and S. Wang, Guangzhou Chem., 2017, 42, 49–56 Search PubMed , 73.
- W. Zhang and C. Y. Cheng, Hydrometallurgy, 2007, 89, 137–159 CrossRef CAS.
- B. Qu, L. Deng, B. Deng, K. He, B. Liao and S. Su, React. Kinet., Mech. Catal., 2018, 123, 743–755 CrossRef CAS.
- N. Soffer, Analyst, 1961, 86, 843–849 RSC.
- X. Wang and Y. Li, J. Am. Chem. Soc., 2002, 124, 2880–2881 CrossRef CAS PubMed.
- J. Zhang, Y. Li, L. Wang, C. Zhang and H. He, Catal. Sci. Technol., 2015, 5, 2305–2313 RSC.
- B. Zhao, R. Ran, X. Wu and D. Weng, Appl. Catal., A, 2016, 514, 24–34 CrossRef CAS.
- Y. Dong, H. Yang, K. He, S. Song and A. Zhang, Appl. Catal., B, 2009, 85, 155–161 CrossRef CAS.
- S. Liang, F. Teng, G. Bulgan, R. Zong and Y. Zhu, J. Phys. Chem. C, 2008, 112, 5307–5315 CrossRef CAS.
- Y. Dai, X. Wang, D. Li and Q. Dai, J. Hazard. Mater., 2011, 188, 132–139 CrossRef CAS PubMed.
- S. Ponce, M. A. Peña and J. L. G. Fierro, Appl. Catal., B, 2000, 24, 193–205 CrossRef CAS.
- C. Yu, G. Li, L. Wei, Q. Fan, Q. Shu and J. C. Yu, Catal. Today, 2014, 224, 154–162 CrossRef CAS.
- P. Gong, J. Xie, D. Fang, D. Han, F. He, F. Li and K. Qi, Chin. J. Catal., 2017, 38, 1925–1934 CrossRef CAS.
- Y. Ding, X. Shen, S. Gomez, H. Luo, M. Aindow and S. L. Suib, Adv. Funct. Mater., 2006, 16, 549–555 CrossRef CAS.
- J. Li, C. Song and S. Liu, Acta Chim. Sin., 2012, 70, 2347–2352 CrossRef CAS.
- T. Chen, H. Dou, X. Li, X. Tang, J. Li and J. Hao, Microporous Mesoporous Mater., 2009, 122, 270–274 CrossRef CAS.
- J. Klausen, S. B. Haderlein and R. P. Schwarzenbach, Environ. Sci. Technol., 1997, 31, 2642–2649 CrossRef CAS.
- H. Zhang and C. Huang, Environ. Sci. Technol., 2005, 39, 4474–4483 CrossRef CAS.
- A. T. Stone, Environ. Sci. Technol., 1987, 21, 979–988 CrossRef CAS.
- Z. He, L. Jiang, J. Chen and L. Zhang, Shuichuli Jishu, 2013, 39, 34–39 CAS.
- T. T. Truong, Y. Liu, Y. Ren, L. Trahey and Y. Sun, ACS Nano, 2012, 6, 8067–8077 CrossRef CAS PubMed.
- R. Liang, S. Yao, C. Tang, S. Zhang and D. Hu, J. Chongqing Univ., 1994, 17, 88–92 CAS.
- K. Lin, W. Liu and J. Gan, Environ. Sci. Technol., 2009, 43, 3860–3864 CrossRef CAS PubMed.
Footnote |
| † Electronic supplementary information (ESI) available: Fig. S1: The XRD patterns of the α-, β-, γ- and δ-four different MnO2; Fig. S2: The Mn 2p spectrum of α-, β-, γ- and δ-four different MnO2; Fig. S3: The XRD pattern of the used natural MnO2 ore; Table S1: The calculation of MD decomposition with different initial concentration, and the calculation method of MD concentration. See DOI: 10.1039/c9ra09810k |
|
| This journal is © The Royal Society of Chemistry 2020 |
Click here to see how this site uses Cookies. View our privacy policy here.  Open Access Article
 *ab,
Cheng Wanga,
Lu Yao
 ab,
Wenju Jiang
 *ab,
Xia Jiang
 ab and
Jianjun Liab


![[thin space (1/6-em)]](https://www.rsc.org/images/entities/char_2009.gif) lg
lg![[thin space (1/6-em)]](https://www.rsc.org/images/entities/char_2009.gif) CMn2+
CMn2+


