 Open Access Article
Facile one-step synthesis of quaternary AgInZnS quantum dots and their applications for causing bioeffects and detecting Cu2+†
Xiao-Le Han‡
 *a,
Qingyu Li‡a,
Hao Haoa,
Chenyin Liua,
Run Lia,
Fan Yua,
Jiawen Leia,
Qingqing Jiang
 a,
Yi Liub and
Juncheng Hu
 *a
*a
aKey Laboratory of Catalysis and Energy Materials Chemistry of Ministry of Education, Hubei Key Laboratory of Catalysis and Materials Science, School of Chemistry and Materials Science, South-Central University for Nationalities, Wuhan 430074, China. E-mail: HXL1220@hotmail.com; jchu@mail.scuec.edu.cn
bState Key Laboratory of Virology, Key Laboratory of Analytical Chemistry for Biology and Medicine (MOE), College of Chemistry and Molecular Sciences, Wuhan University, Wuhan 430072, P. R. China
First published on 3rd March 2020
Abstract
Water-soluble AgInZnS quantum dots (AIZS QDs) were synthesized with glutathione (GSH) as a stabilizer by a facile one-step method based on a hydrothermal reaction between the nitrate salts of the corresponding metals and sodium sulfide as a sulfide precursor at 110 °C. The optimal reaction conditions (temperature, time, pH, and the molar ratios of the precursors) were studied. According to the data from TEM, XPS, and XRD, AIZS QDs were characterized with excellent optical properties. The results showed that the aqueous-dispersible AIZS QDs were quasi-spherical and their average diameter was 3.51 nm. Furthermore, the cytotoxicity of AIZS QDs was investigated by microcalorimetry and microscopy techniques (confocal microscopy and TEM). The data revealed that AIZS QDs exhibited low toxicity, biocompatibility, and good water stability, due to which they could be used as a fluorescent probe for bioimaging and labeling. In addition, AIZS QDs could be used as a sensor to detect Cu2+ because the fluorescence of AIZS QDs was quenched by Cu2+.
Introduction
In the last few decades, quantum dots (QDs) have attracted much attention due to their unique optical and electrical properties. At the same time, studies on the application of QDs in light-emitting diodes, photovoltaic cells, bioimaging, medical diagnosis, ion selection, and other aspects are endless.1–16,23,35 As for the application of quantum dots in biology, medicine, and other fields, numerous researchers have made many research contributions.23,31–33 The manipulation of the optical properties of QDs can be used to selectively image and monitor a specific biological site.27–32 White light-emitting diodes (WLEDs) based on all-inorganic halide (CsPbX3, X = Cl, Br, and I) perovskite quantum dots (QDs) have also attracted broad attention due to their high brightness.34 At the same time, there has recently been increasing interest in fabricating entirely new types of devices and even exploring new physics by structuring matter at the nanoscale. Nanostructured materials are acknowledged as viable materials to effectively replace conventional energy materials in such energy applications. Many applications including photovoltaics, supercapacitors, and batteries have also been widely investigated.36,37QDs are materials with nanoscale adjustable characteristics in structure. The traditional II–VI or III–V QDs, which contain the elements Cd, Hg, As, or Pb, can hardly be used directly in biomedicine. The main reason is the risk that these heavy metal ions can be released into the organism, causing potential disorders or tissue destruction of the biological internal environment. Therefore, the cytotoxic effect of QDs is the primary factor to be considered in their applications in the fields of biology and medicine. Han and coworkers found that the QD-induced cytotoxicity is due to endocytosis and is partially dependent on the QDs' size, which determines the free or confined states of the QDs in the cell.17 In follow-up studies, Han et al. explored the cytotoxicity of CdTe QDs with different surface coatings against the yeast Saccharomyces cerevisiae.18 Wang and colleagues made a review of the in vitro toxicological research of quantum dots and potentially involved mechanisms.19 Given this, safety measures, such as coating protocols and polymer modification, have been extensively tried to reduce their toxicity, such as by inhibiting or reducing the release of metal ions.
Some researchers have focused on trying to synthesize quantum dots that do not contain heavy metal ions and as such, ternary I–III–VI2 compound nanocrystals containing no heavy metal ions can be promising alternatives to traditional Cd or As-based QDs due to their remarkable biocompatibility, composition-dependent optical properties, high biochemical stability, and ionic crystal lattices.20 Stroyuk and coworkers synthesized 2–3 nm size-selected glutathione-capped Ag–In–S (AIS) and core/shell AIS/ZnS quantum dots (QDs) by precipitation/redissolution from an aqueous colloidal ensemble. The as-synthesized QDs possessed broadband photoluminescence (PL) with a quantum yield of up to 60%.38 Galiyeva et al. fabricated the preparation of quaternary (AgInS2)x(MnS)y(ZnS)1−x−y QDs and noted Mn![[thin space (1/6-em)]](https://www.rsc.org/images/entities/char_2009.gif) :
:![[thin space (1/6-em)]](https://www.rsc.org/images/entities/char_2009.gif) AIZS via a thermally induced decomposition of Ag, In, Zn, and Mn precursors in the presence of oleylamine and dodecanethiol. In addition, the incorporation of Mn2+ ions in the AIZS crystal lattice resulted in a red-shift of the photoluminescence (PL) emission maximum depending on the Mn2+ content. Therefore, the fluorescence properties of the quantum dots could be regulated by ion doping.39 In addition, by changing the reaction method or reaction conditions, like the temperature, pH value, or molar ratio of the precursors, the optical properties of ternary I–III–VI2 QDs can be improved and can even be adjusted in order to obtain QDs with corresponding optical properties according to requirements.21,22
AIZS via a thermally induced decomposition of Ag, In, Zn, and Mn precursors in the presence of oleylamine and dodecanethiol. In addition, the incorporation of Mn2+ ions in the AIZS crystal lattice resulted in a red-shift of the photoluminescence (PL) emission maximum depending on the Mn2+ content. Therefore, the fluorescence properties of the quantum dots could be regulated by ion doping.39 In addition, by changing the reaction method or reaction conditions, like the temperature, pH value, or molar ratio of the precursors, the optical properties of ternary I–III–VI2 QDs can be improved and can even be adjusted in order to obtain QDs with corresponding optical properties according to requirements.21,22
In this study, hydrophilic AIZS QDs were synthesized via a one-step hydrothermal method using glutathione (GSH) as a stabilizing reagent and a nitrate precursor. The as-prepared AIZS QDs had an average diameter of 3.51 nm and exhibited relatively strong photoluminescence, a high fluorescence stability, and good aqueous dispensability without any surface modification or further processing required. Subsequently, a micro-calorimetric technique was used to investigate the biological effect of the AIZS QDs on S. cerevisiae. The relationships between the growth rate constant k and the concentration, inhibitory ratio I, and the half inhibitory concentration (IC50) were also assessed. Moreover, the morphology of yeast cells grown under different conditions of AIZS QDs was observed by TEM. The fluorescence of AIZS QDs inside yeast cells was observed using laser scanning confocal and fluorescence microscopy. Compared with the CdTe QDs synthesized by our research group,17,18 we found that the AIZS QDs had better biocompatibility and optical properties. Besides, we found the as-prepared AIZS QDs had potential application as a sensor to detect Cu2+ ions in the fields of biomedicine and water treatment due to the fluorescence being quenched by metal Cu2+ ions.
Experimental
Chemicals and reagents
Silver nitrate (AgNO3) was purchased from Sinopharm Chemical Reagent Co., Ltd (Shanghai, China). Sodium sulfide (Na2S·9H2O) was purchased from Shanghai Ling Feng Chemical Reagent Co., Ltd (Shanghai, China). Zinc nitrate (Zn(NO3·6H2O)2, 99.99%), glutathione (Reduced) (GSH, 98%), and sodium hydroxide (NaOH, AR) were purchased from Shanghai Aladdin Bio-Chem Technology Co., Ltd. Indium nitrate (In(NO3)3, 99.99%) was bought from Shanghai Macklin Biochemical Co., Ltd.Phosphate buffer saline (PBS, pH = 7.4), and yeast extract peptone dextrose (YPED) medium were prepared by dissolving yeast extract (10 g), peptone (10 g), and glucose (20 g) in DI water (1.0 L) at natural pH, which was then sterilized under high-pressure steam at 120 °C for 30 min. The water used in the experiment was deionized distilled. All the chemicals were of analytical grade and used without further purification.
Instrumentation
The photoluminescence (PL) spectra and ultraviolet-visible (UV-Vis) absorption spectra were measured on a fluorescence spectrophotometer (HITACHI F-4600) and ultraviolet-visible spectrophotometer (HITACHI U-3900H), respectively. Transmission microscopy (TEM, TECNAI G2 20 S-TWIN) was used to obtain the shape and size distribution of the AIZS QDs, and the XPS spectra were acquired via X-ray photoelectron spectroscopy (MULTILAB 2000) for determining the elementary composition. X-ray diffraction (XRD) measurements were carried out using an X-ray diffractometer (D8 ADVANCE) in order to analyze the crystalline structure of the AIZS QDs. The fluorescence lifetime of the AIZS QDs was measured using a photoluminescence spectrometer (FLS 1000) in order to obtain the average fluorescence lifetime of the QDs and the decay model of the fluorescence intensity.Synthesis of the AIZS QDs
The AIZS QDs were synthesized via a one-step hydrothermal method. Typically, 1.70 mg of AgNO3 (10−5 M), 30.08 mg of In(NO3)3 (10−4 M), 14.87 mg of Zn(NO3)2·6H2O (5 × 10⁻⁵ M), and 0.2151 g of GSH were mixed with 48 mL of water. Then, 0.2162 g of Na2S·9H2O was dispersed in 2 mL of water and rapidly injected into the mixture. Subsequently, NaOH solution (1 M) was used dropwise to adjust the pH of the mixture to 8.50 under vigorous stirring. Then the mixture was placed into a 150 mL three-necked flask followed by heating at 110 °C under an open-air atmosphere using a condenser. At various time intervals, aliquots of the reaction solution were withdrawn and the reaction was stopped after 5 h. After the reaction solution was cooled to room temperature, the AIZS QDs were precipitated by adding twofold ethanol. Then the precipitates were dispersed in water and freeze-dried thoroughly for further use. After that, the experimental variables, including the temperature, pH, time of reaction, and molar ratios of the precursors, were varied for investigating their influences on the fluorescence intensity of the aqueous AIZS QDs.TAM air experiments
Microcalorimetry is used to measure the heat changes from chemical reactions or physical events. In this experiment, the metabolism thermogenic curves of S. cerevisiae in the yeast extract peptone dextrose (YPED) medium with different concentrations of AIZS QDs at 30 °C were investigated. The specific experimental process was as follows: first, S. cerevisiae was cultured in YPED medium for 10 h at 30 °C. Second, 50 mL of sterilized YPED medium was mixed with 500 μL S. cerevisiae solution, and then separated into 8 ampoules via pipette and 5 mL yeast liquid was then added into each ampoule. Third, a different amount of AIZS QDs (0, 0.8, 1.2, 1.6, 2.4, 3.2, 4.8, 9.6 μM) was added into these ampoules, respectively. Then all these ampules were sealed and oscillated thoroughly. Finally, the packaged ampoules were transferred to an isothermal microcalorimeter (TAM air) for measuring the heat changes of S. cerevisiae incubated with different concentrations of AIZS QDs. After the experiment, the data were analyzed.Microscopic experiments
S. cerevisiae were incubated with AIZS QDs (1.6, 4.8 μM) in YEPD at 30 °C for 6 h and the absorbance rose to 0.8 (about 360 min) at 600 nm (A600) for laser scanning confocal and TEM analyses.All the experiments were repeated three times.
Results and discussion
Optical properties
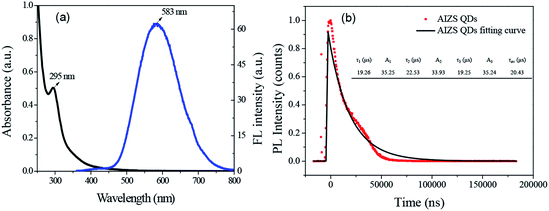
The AIZS QDs were synthesized under normal pressure reaction conditions. The fluorescence and absorption spectra are shown in Fig. 1a. It was revealed that the position of absorption peak was at 295 nm and the emission peak wavelength was at 583 nm, respectively. The PL decay profile of the AIZS QDs reacting for 5 h is shown in Fig. 1b, and according to eqn (1),24 the PL quantum yield of the AIZS QDs was calculated to be 5.88%.
 | (1) |
The PL decay curves of AIZS QDs was fitted by the following triexponential function (2):
 | (2) |
Influence of the reaction conditions on the optical properties of the AIZS QDs
In order to synthesis AIZS QDs with excellent optical stability and biocompatibility, we optimized the synthetic conditions from the perspective of the reaction time, reaction temperature, pH of the reaction solution, and the molar ratios of Ag–In, In–S, In–GSH, and Ag–Zn. It is worth noting that we changed one variable at a time while keeping the other concentrations of the corresponding precursors constant.The effects of the reaction time, temperature, and pH of reaction on the PL intensity of AIZS QDs were investigated, respectively (Fig. 2). From Fig. 2a, it could be observed that the optimal reaction time of the AIZS QDs was 5 h, showing the maximal PL intensity. With the increase in reaction temperature, the PL intensity of the AIZS QDs also increased. The PL intensity of the AIZS QDs at 110 °C was the highest, which was thus considered as the best reaction temperature for the AIZS QDs synthesis (Fig. 2b). From Fig. 2c, it could be obviously found that the PL intensity displayed a downward trend when the pH of the reaction was increased from 8.50 to 10.50. Therefore, we confirmed that the maximum fluorescence intensity of the AIZS QDs occurred under pH 8.50.
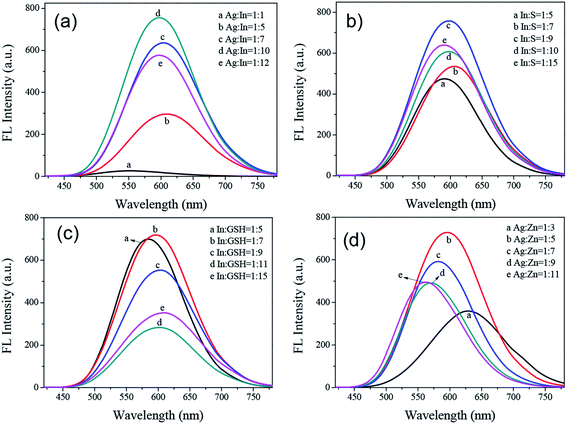
The effects of the molar ratios of Ag–In, In–S, In–GSH, and Ag–Zn on the PL intensity of the AIZS QDs were the non-neglected factors for the synthesis of the quaternary system, and determined the intensity and position of the PL emission spectrum. All the data related to the different molar ratios are shown in Fig. 3. From Fig. 3a, the PL intensity of the AIZS QDs was the maximum when the molar ratio of Ag–In was 1![[thin space (1/6-em)]](https://www.rsc.org/images/entities/char_2009.gif) :
:![[thin space (1/6-em)]](https://www.rsc.org/images/entities/char_2009.gif) 10. Fig. 3b showed that the PL intensity of AIZS QDs was the strongest when the molar ratio of In–GSH was 1
10. Fig. 3b showed that the PL intensity of AIZS QDs was the strongest when the molar ratio of In–GSH was 1![[thin space (1/6-em)]](https://www.rsc.org/images/entities/char_2009.gif) :
:![[thin space (1/6-em)]](https://www.rsc.org/images/entities/char_2009.gif) 7 keeping the molar ratio of Ag–In at 1
7 keeping the molar ratio of Ag–In at 1![[thin space (1/6-em)]](https://www.rsc.org/images/entities/char_2009.gif) :
:![[thin space (1/6-em)]](https://www.rsc.org/images/entities/char_2009.gif) 10. Just as shown in Fig. 3c, the optimal molar ratio of In–S was 1
10. Just as shown in Fig. 3c, the optimal molar ratio of In–S was 1![[thin space (1/6-em)]](https://www.rsc.org/images/entities/char_2009.gif) :
:![[thin space (1/6-em)]](https://www.rsc.org/images/entities/char_2009.gif) 9. By changing the molar ratio of Ag–Zn from 1
9. By changing the molar ratio of Ag–Zn from 1![[thin space (1/6-em)]](https://www.rsc.org/images/entities/char_2009.gif) :
:![[thin space (1/6-em)]](https://www.rsc.org/images/entities/char_2009.gif) 3 to 1
3 to 1![[thin space (1/6-em)]](https://www.rsc.org/images/entities/char_2009.gif) :
:![[thin space (1/6-em)]](https://www.rsc.org/images/entities/char_2009.gif) 11, the influence on the PL intensity of AIZS QDs caused by the molar ratio of Ag–Zn was investigated, as shown in Fig. 3d. It was revealed that the optimal molar ratio of Ag–Zn was 1
11, the influence on the PL intensity of AIZS QDs caused by the molar ratio of Ag–Zn was investigated, as shown in Fig. 3d. It was revealed that the optimal molar ratio of Ag–Zn was 1![[thin space (1/6-em)]](https://www.rsc.org/images/entities/char_2009.gif) :
:![[thin space (1/6-em)]](https://www.rsc.org/images/entities/char_2009.gif) 5.
5.
Meanwhile, with the increase in the concentration of the Zn precursor, the emission peak position shifted from 627.6 nm to 562.6 nm. These features may be caused by the donor–acceptor transition and trap-state emission. We considered that the large Stokes shift was not due to a band gap emission. The reason is that the conduction band of the bulk Ag–In–S semiconductor is made up of hybrid orbitals of In 5p5s and S 3p, while the valence band is formed by S 3p hybridized with Ag 4d. Therefore, when Zn was incorporated into the reaction system, Ag was replaced via cation exchange, leading to a decrease in the number of Ag orbitals, thus expanding the band gap. Combining all the results, we concluded that the optimal molar ratio of Ag![[thin space (1/6-em)]](https://www.rsc.org/images/entities/char_2009.gif) :
:![[thin space (1/6-em)]](https://www.rsc.org/images/entities/char_2009.gif) In
In![[thin space (1/6-em)]](https://www.rsc.org/images/entities/char_2009.gif) :
:![[thin space (1/6-em)]](https://www.rsc.org/images/entities/char_2009.gif) GSH
GSH![[thin space (1/6-em)]](https://www.rsc.org/images/entities/char_2009.gif) :
:![[thin space (1/6-em)]](https://www.rsc.org/images/entities/char_2009.gif) S
S![[thin space (1/6-em)]](https://www.rsc.org/images/entities/char_2009.gif) :
:![[thin space (1/6-em)]](https://www.rsc.org/images/entities/char_2009.gif) Zn for the maximum PL intensity of AIZS QDs should be 1
Zn for the maximum PL intensity of AIZS QDs should be 1![[thin space (1/6-em)]](https://www.rsc.org/images/entities/char_2009.gif) :
:![[thin space (1/6-em)]](https://www.rsc.org/images/entities/char_2009.gif) 10
10![[thin space (1/6-em)]](https://www.rsc.org/images/entities/char_2009.gif) :
:![[thin space (1/6-em)]](https://www.rsc.org/images/entities/char_2009.gif) 70
70![[thin space (1/6-em)]](https://www.rsc.org/images/entities/char_2009.gif) :
:![[thin space (1/6-em)]](https://www.rsc.org/images/entities/char_2009.gif) 90
90![[thin space (1/6-em)]](https://www.rsc.org/images/entities/char_2009.gif) :
:![[thin space (1/6-em)]](https://www.rsc.org/images/entities/char_2009.gif) 5.
5.
Morphology and structure characterization of the AIZS QDs
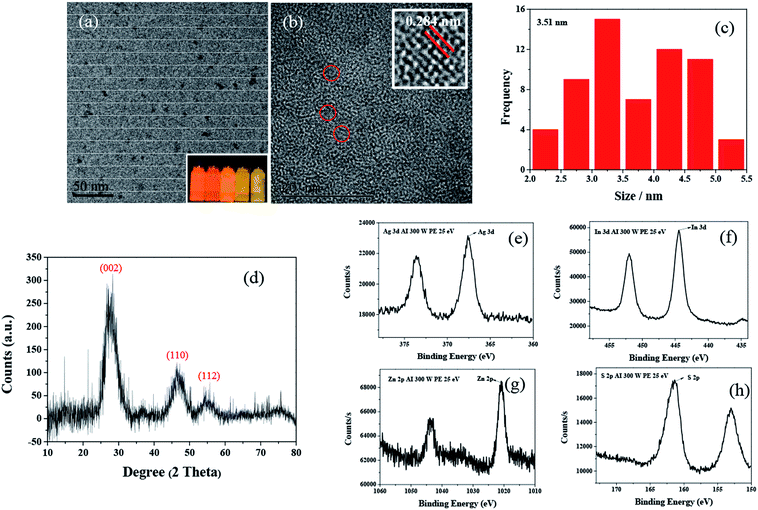
TEM observation (Fig. 4a) revealed that the AIZS QDs had good monodispersity and a quasi-spherical morphology. The HRTEM image (Fig. 4b) showed continuous lattice fringes with a d-spacing of 0.284 nm, which is indicative of the single crystalline nature of the AIZS QDs. Besides, the histograms of the size distribution are given in Fig. 4c, exhibiting a wide distribution, and the average size of the AIZS QDs was determined to be 3.51 nm. XRD and XPS analyses were further used to determine the crystal structure and the elements in the AIZS QDs. The XRD pattern for the AIZS QDs of the sample with the optimal reaction conditions is shown in Fig. 4d, which basically matched well with the characteristic peaks of the hexagonal AgInZn2S4 structure (JCPDF 25-0383). The XRD observations showed three main peaks around 2θ values of 27.81°, 46.53°, and 54.87°, which corresponded to the (002), (110), and (112) phase of the hexagonal structure, respectively. The broad diffraction peaks could be explained by the small size of the nanoparticles. In Fig. 4e–h, the XPS pattern of the AIZS QDs demonstrated the existence of Ag, In, Zn, and S of quaternary AIZS QDs, which is consistent with the results obtained from the XRD pattern of the AIZS QDs. Besides, the elementary compositions of Ag, In, Zn, and S of quaternary AIZS QDs were 0.64%, 3.8%, 1.25%, and 8.68%, respectively, and the approximate ratio of these elements was Ag![[thin space (1/6-em)]](https://www.rsc.org/images/entities/char_2009.gif) :
:![[thin space (1/6-em)]](https://www.rsc.org/images/entities/char_2009.gif) In
In![[thin space (1/6-em)]](https://www.rsc.org/images/entities/char_2009.gif) :
:![[thin space (1/6-em)]](https://www.rsc.org/images/entities/char_2009.gif) Zn
Zn![[thin space (1/6-em)]](https://www.rsc.org/images/entities/char_2009.gif) :
:![[thin space (1/6-em)]](https://www.rsc.org/images/entities/char_2009.gif) S = 1
S = 1![[thin space (1/6-em)]](https://www.rsc.org/images/entities/char_2009.gif) :
:![[thin space (1/6-em)]](https://www.rsc.org/images/entities/char_2009.gif) 6
6![[thin space (1/6-em)]](https://www.rsc.org/images/entities/char_2009.gif) :
:![[thin space (1/6-em)]](https://www.rsc.org/images/entities/char_2009.gif) 2
2![[thin space (1/6-em)]](https://www.rsc.org/images/entities/char_2009.gif) :
:![[thin space (1/6-em)]](https://www.rsc.org/images/entities/char_2009.gif) 14.
14.
Investigation of the bioeffects of the AIZS QDs
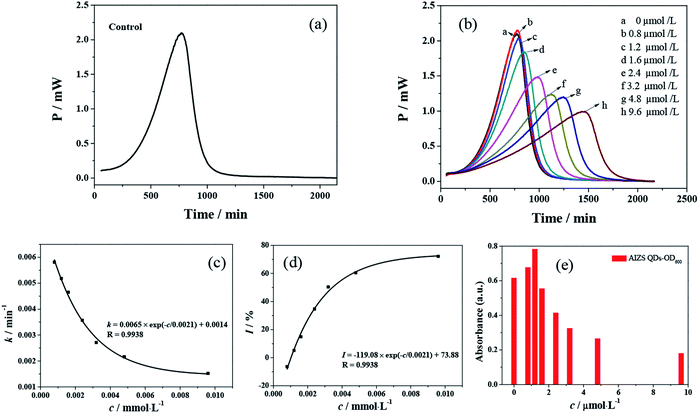
S. cerevisiae is widely used as an unicellular eukaryotic model organism in the toxicological evaluation of chemicals. Our earlier research showed that CdTe QDs with different sizes and modifications affect the growth of S. cerevisiae and induce cytotoxicity to the yeast cells.12 In order to study the cytotoxicity of AIZS QDs, S. cerevisiae was chosen as a model organism here. We studied the influence of AIZS QDs on S. cerevisiae using a TAM air microcalorimeter. The typical thermogenic power–time (p–t) curve is shown in Fig. 5a, regarded as a control group without AIZS QDs. With increasing the concentration of AIZS QDs, the metabolism of S. cerevisiae was changed regularly and the heat output in the metabolism process decreased, as shown in Fig. 5b.The microbial growth rate constant k can provide an important quantitative index of microbial activity. All the data were collected and analyzed by the thermokinetic eqn (3). The growth rate constant k was calculated from the slope of the semi-logarithm of the exponential phase:
 | (3) |
![[thin space (1/6-em)]](https://www.rsc.org/images/entities/char_2009.gif) Pt, the growth rate constant k of the microorganism can be obtained. With the addition of the AIZS QDs, the multiplying metabolism of S. cerevisiae changed gradually, which naturally resulted in a change in the growth rate constant k, just as shown in Table 1.
Pt, the growth rate constant k of the microorganism can be obtained. With the addition of the AIZS QDs, the multiplying metabolism of S. cerevisiae changed gradually, which naturally resulted in a change in the growth rate constant k, just as shown in Table 1.
| QDs | c [nmol L−1] | k [10−3 min−1] | R | Pm [mW] | Qtotal [J] | I [%] | IC50 [nmol L−1] |
|---|---|---|---|---|---|---|---|
| AIZS QDs | 0 | 5.46 | 0.994 | 2.08 | 0.830 | 0 | 1000 |
| 800 | 5.81 | 0.999 | 2.13 | 0.844 | −6.41 | ||
| 1200 | 5.18 | 0.999 | 2.01 | 0.810 | 5.13 | ||
| 1600 | 4.65 | 0.995 | 1.82 | 0.820 | 14.84 | ||
| 2400 | 3.57 | 0.994 | 1.46 | 0.822 | 34.62 | ||
| 3200 | 2.71 | 0.999 | 1.21 | 0.780 | 50.37 | ||
| 4800 | 2.16 | 0.999 | 1.17 | 0.819 | 60.44 | ||
| 9600 | 1.52 | 0.996 | 0.97 | 0.826 | 72.16 |
In order to describe the inhibition of AIZS QDs against S. cerevisiae, the inhibitory ratio (I) must be defined. The inhibitory ratio is a very important parameter to evaluate the toxicological effect of QDs, which can be calculated through eqn (4):
 | (4) |
With the increasing concentration of AIZS QDs, the rate constant k and inhibitory ratio I were affected, respectively, as shown in Fig. 5c. It was indicated that the growth rate k decreased gradually with the addition of a higher concentration of AIZS QDs, which was due to a concentration-dependent effect. Therefore, the peak time corresponding to the maximum power output was prolonged with the change in the concentration of QDs.17 In Fig. 5d, when the inhibitory ratio was equal to 50%, the half inhibitory concentration (IC50) could be obtained, which represents the inhibition capability of the compound quantitatively. However, according to the relationship from Fig. 5b, the value of IC50 was equal to 1 × 10⁻³ mM (or 1000 nM). Compared with our previous work (with IC50 values responding to the different CdTe QDs),17,18 just as shown in Table 1, we found that the IC50 of AIZS QDs was larger than that of CdTe QDs. The smaller the value of IC50, the stronger its inhibitory activity. The results revealed that the AIZS QDs had a lower toxicity on S. cerevisiae than CdTe QDs. Fig. 5e presents the optical density (same as absorbance) of the yeast incubated with different concentrations of AIZS QDs. The results showed that with the increase in AIZS QDs, the optical density of the yeast increased at first and then decreased, gradually. This can be explained by the stress of yeast cells to the low concentration of AIZS QDs, which increases the metabolic activity of the yeast.
By analyzing the data from the power–time curves of S. cerevisiae only and the system of S. cerevisiae-AIZS QDs, a good deal of thermodynamic and kinetic information about the multiplying metabolism can be obtained and are listed in Table 1. It was revealed that the change of the total heat output (Qtotal) was not distinct compared to the maximum power output (Pm) with the increment in the concentration of AIZS QDs. Here, the inhibiting action of AIZS QDs cannot instantly inhibit the metabolism and the genetic material of the microorganisms, but rather they damage their physiological function gradually to present chronic toxicity.
Morphological changes of S. cerevisiae treated with AIZS QDs
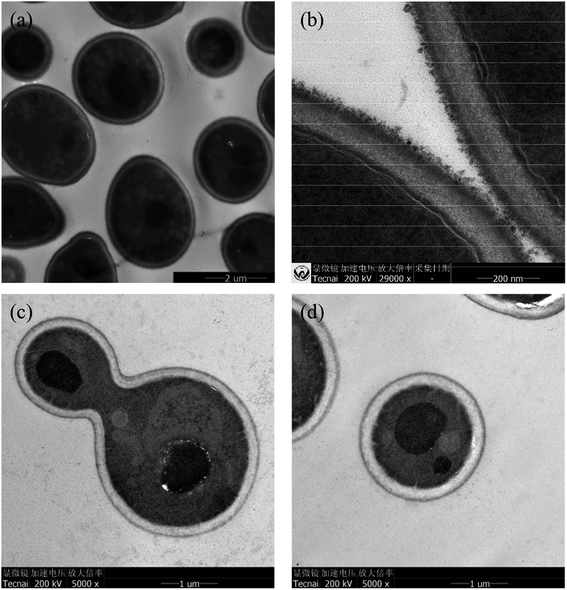
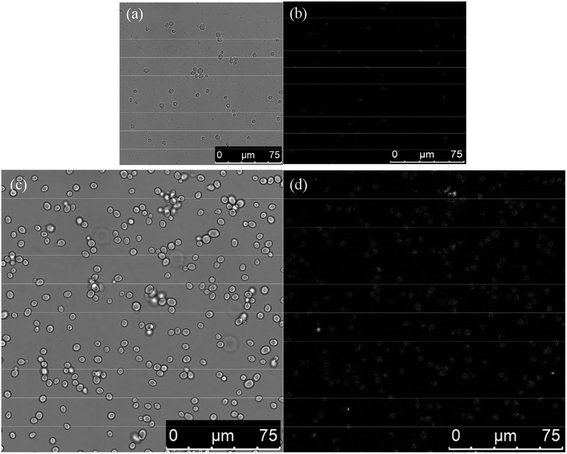
The TEM images of S. cerevisiae treated with AIZS QDs were found to have some differences in morphology in comparison with the control (S. cerevisiae only). Fig. 6a and b represent the TEM images of a thin section of yeast cells growing in the absence of AIZS QDs. These yeast cells were cultured in good condition and the cell walls were intact. Fig. 6c and d show the yeast cells treated with AIZS QDs. By comparison, it can be found that some yeast cell walls were damaged accompanied by some cytoplasmic efflux. At the same time, most of them remained intact except for some changes in the organelles in the cytoplasm. Compared with the TEM images of a thin section of yeast cells treated with CdTe QDs,12 the yeast cells treated with AIZS QDs had higher integrity. In other words, the AIZS QDs had less effect on the yeast cells and lower toxicity than the CdTe QDs in Tables S1 and S2 (see ESI†), which meant that the AIZS QDs have potential applications in bioimaging.Based on the above analysis of the TEM images of a thin section of yeast cells growing with AIZS QDs, we attempted to clarify whether or not the AIZS QDs could be internalized into the yeast cells via laser scanning confocal microscopy. The yeast cells were incubated with AIZS QDs for 6 h (the cells were in the growth phase) to analyze the intracellular uptake of QDs. Fig. 7a and c show the bright-field images of yeast cells incubated with AIZS QDs. The yellow fluorescence of AIZS QDs can be observed in the cells after being incubated with S. cerevisiae (Fig. 7b and d). This indicated that the AIZS QDs can be applied in bioimaging and for labeling the yeast cells. In addition, we found that the AIZS QDs can be used to detect the Cu2+, and the results are shown in Fig. 8.
Fluorescence detection of Cu2+
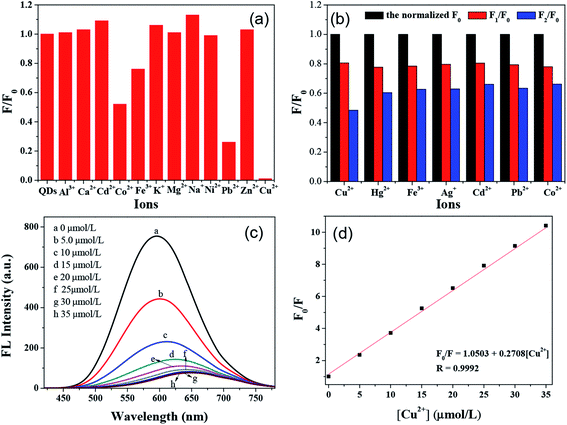
As shown in Fig. 8a, the influence of 12 kinds of metal ions (including Cu2+) on the fluorescence of AIZS QDs was investigated. It could be seen that Cu2+ had the largest quenching effect on the fluorescence intensity of AIZS QDs upon the addition of the same amount of metal ions (1.67 × 10⁻³ mM). Besides, Hg2+, Ag+, Co2+, Fe3+, and Pb2+ could all quench the fluorescence of AIZS QDs to various degrees. Therefore, it was important to study the effect of these six kinds of metal ions on the fluorescence intensity of the AIZS QDs. The results are shown in Fig. 8b. As illustrated, F0, F1 are the normalized fluorescence intensity of AIZS QDs in the absence and presence of 0.4 μM Cu2+, while F2 represents the relative fluorescence intensity of AIZS QDs in the presence of different metal ions coexisting with 0.4 μM Cu2+. The concentration of these metal ions was 10 μM. It was indicated that Cu2+ still had the greatest quenching effect on the fluorescence intensity of the AIZS QDs in the presence of the different metal ions coexisting with Cu2+. These results demonstrated that the AIZS QDs can be used as a probe to detect Cu2+. Then the selectivity of AIZS QDs to Cu2+ was investigated in order to evaluate the feasibility of using the AIZS QDs as a probe for detecting Cu2+.The fluorescence spectra of AIZS QDs quenched by the addition of different concentrations of Cu2+ are shown in Fig. 8c. It was found that the fluorescence of AIZS QDs decreased with the increase in Cu2+ concentration from 0 to 35.0 μM. According to the linear fitting curves (Fig. 8d), it was proved that a good linear correlation between F0/F (F and F0 are the fluorescence intensity of AIZS QDs in the presence and absence of Cu2+) and the concentration of Cu2+ existed. In addition, the linear equation for Cu2+ is given below:
| F0/F = 1.0503 + 0.2708[Cu2+], R = 0.9992. |
This is similar to the Stern–Volmer equation: F0/F = 1 + Ksv[Cu2+]. The quenching efficiency F0/F and the concentration of Cu2+ displayed a good linear relationship. The limit of detection (LOD) for Cu2+ was calculated to be 100.28 nM via the formula 3Sb/k, where Sb is the standard deviation of the blank and k is the slope of the fitted trend line. In our work, the synthesis method for the AIZS QDs was quite simple, and the as-prepared QDs did not need any subsequent modifications. Besides, the QDs possessed good fluorescence stability and long fluorescence lifetime. The comparison of different QDs-based assays for the detection of Cu2+ are listed in Table S340–44 (see ESI†). By comparison, these fluorescent probes used to detect Cu2+ were synthesized in a variety of ways. Some of the synthesis methods were relatively simple, while others were relatively cumbersome or even involved some toxic organic solvents. In addition, some of the fluorescent probes involved a composite of two or more nanomaterials. To a certain extent, these showed better sensitivity and selectivity in the detection of Cu2+. Also, this provides a direction for us to improve the AIZS QDs in the next step of our research.
Conclusions
In summary, quaternary AgInZnS quantum dots were synthesized by a facile and one-step hydrothermal method at the usual atmospheric pressure. The reaction conditions (reaction time, temperature, pH values of the reaction system, and molar ratios of precursors) were investigated and the optimal reaction synthesis conditions of AIZS QDs were determined. The as-synthesized AIZS QDs were quasi-spherical and their average diameter was 3.51 nm with yellow fluorescence. The results from microcalorimetry and TEM showed that S. cerevisiae was affected by AIZS QDs with different concentrations at 30 °C. The value of IC50 was equal to 1 × 10⁻³ mM. The AIZS QDs had less effect on yeast cells and a lower toxicity than CdTe QDs; however, the AIZS QDs could be internalized into the yeast cells. According to the excellent biocompatibility, water stability, and good fluorescence stability, AIZS QDs have potential applications in bioimaging. Moreover, they can be used as a sensor to detect Cu2+ and the limit of detection (LOD) for Cu2+ was 100.28 nM.Conflicts of interest
There are no conflicts to declare.Acknowledgements
This work was partly supported by the National Natural Science Foundation of China [21873075, 21503283]; Natural Science Foundation of Hubei Province [2015CFC873, 2018CFB135]; Foundation of Ministry of Science and Technology of the People's Republic of China [BZY19022]; Fundamental Research Funds for the South-Central University for Nationalities [CZY20015].Notes and references
- Y. J. Zhang, R. R. Yuan, M. L. He, G. C. Hu, J. T. Jiang, T. Xu, L. Zhou, W. Chen, W. D. Xiang and X. J. Liang, Nanoscale, 2017, 9, 17849 RSC.
- J. X. Chen, Y. Li, L. Wang, T. L. Zhou and R. J. Xie, Nanoscale, 2018, 10, 9788 RSC.
- D. H. Jara, S. J. Yoon, K. G. Stamplecoskie and P. V. Kamat, Chem. Mater., 2014, 26, 7221–7228 CrossRef CAS.
- M. Zhou, Y. M. Gong, J. Xu, G. Fang, Q. B. Xu and J. F. Dong, J. Alloys Compd., 2013, 574, 272–277 CrossRef CAS.
- W. C. Law, K. T. Yong, I. Roy, H. Ding, R. Hu, W. W. Zhao and P. N. Prasad, Small, 2009, 5, 1302–1310 CrossRef CAS PubMed.
- L. Cao, X. Q. Li, L. X. Qin, S. Z. Kang and G. D. Li, J. Mater. Chem. B, 2017, 5, 6300 RSC.
- H. M. Meng, D. Zhao, N. Li and J. B. Chang, Analyst, 2018, 143, 4967 RSC.
- A. Rakovich and T. Rakovich, J. Mater. Chem. B, 2018, 6, 2690 RSC.
- P. J. Li, Y. Y. Hong, H. T. Feng and S. F. Y. Li, J. Mater. Chem. B, 2017, 5, 2979 RSC.
- X. W. Qie, M. H. Zan, P. Miao, L. Li, Z. M. Chang, M. F. Ge, P. Gui, Y. G. Tang and W. F. Dong, J. Mater. Chem. B, 2018, 6, 3549 RSC.
- X. P. Tan, J. D. Yang, Q. Li and Q. Yang, Analyst, 2015, 140, 6748 RSC.
- P. Jiang, S. L. Li, M. L. Han, Y. Liu and Z. L. Chen, Analyst, 2019, 144, 2604 RSC.
- X. Y. Sun, P. C. Liu, L. L. Wu and B. Liu, Analyst, 2015, 140, 6742 RSC.
- S. F. Xu and H. Z. Lu, Chem. Commun., 2015, 51, 3200 RSC.
- L. Wang, X. J. Kang and D. C. Pan, Inorg. Chem., 2017, 56, 6122–6130 CrossRef CAS PubMed.
- G. X. Xu, S. W. Zeng, B. T. Zhang, M. T. Swihart, K. T. Yong and P. N. Prasad, Chem. Rev., 2016, 116, 12234–12327 CrossRef CAS PubMed.
- X. l. Han, L. Lai, F. F. Tian, F. L. Jiang, Q. Xiao, Y. Li, Q. L. Yu, D. W. Li, J. Wang, Q. M. Zhang, B. F. Zhu, R. Li and Y. Liu, Small, 2012, 8, 2680–2689 CrossRef CAS PubMed.
- X. L. Han, J. W. Lei, K. Chen, Q. Y. Li, H. Hao, T. F. Zhou, F. L. Jiang, M. Li and Y. Liu, Ecotoxicol. Environ. Saf., 2019, 174, 467–474 CrossRef CAS PubMed.
- Y. Wang and M. Tang, Sci. Total Environ., 2018, 625, 940–962 CrossRef CAS PubMed.
- J. l. Q. Song, C. Ma, W. Z. Zhang, X. D. Li, W. T. Zhang, R. B. Wu, X. C. Cheng, A. Ali, M. Y. Yang, L. X. Zhu, R. X. Xia and X. L. Xu, ACS Appl. Mater. Interfaces, 2016, 8, 24826–24836 CrossRef CAS PubMed.
- W. M. Girma, M. Z. Fahmi, A. Permadi, M. A. Abate and J. Y. Chang, J. Mater. Chem. B, 2017, 5, 6193 RSC.
- Y. F. Liu, X. S. Tang, M. Deng, T. Zhu, Y. Z. Bai, D. R. Qu, X. B. Huang and F. Qiu, J. Lumin., 2018, 202, 71–76 CrossRef CAS.
- S. Y. Liu, S. Pang, H. Huang and X. G. Su, Analyst, 2014, 139, 5852 RSC.
- X. Yang, Z. T. Pan and Y. Ma, J. Anal. Sci., 2003, 6, 588–589 Search PubMed.
- X. J. Zhao, F. X. Li, Q. Y. Zhang, Z. B. Li, Y. H. Zhou, J. Yang, C. Dong, J. P. Wang and S. M. Shuang, RSC Adv., 2015, 5, 21504 RSC.
- J. L. Q. Song, T. T. Jiang, T. Y. Guo, L. Liu, H. J. Wang, T. Y. Xia, W. T. Zhang, X. C. Ye, M. Y. Yang, L. X. Zhu, R. X. Xia and X. L. Xu, Inorg. Chem., 2015, 54, 1627–1633 CrossRef CAS PubMed.
- M. Z. Fahmi and J.-Y. Chang, Procedia Chem., 2016, 18, 112–121 CrossRef CAS.
- R. F. Zhou, S. K. Sun, C. H. Li, L. Wu, X. D. Hou and P. Wu, ACS Appl. Mater. Interfaces, 2018, 10, 34060–34067 CrossRef CAS PubMed.
- Y. X. Ma, G. B. Mao, W. R. Huang, G. Q. Wu, W. Yin and X. H. Ji, et al., J. Am. Chem. Soc., 2019, 141, 13454–13458 CrossRef CAS PubMed.
- X. L. Ge, B. Huang, Z. L. Zhang, X. L. Liu, M. He and Z. L. Yu, et al., J. Mater. Chem. B, 2019, 7, 5782–5788 RSC.
- W. S. Guo, N. Chen, C. H. Dong, Y. Tu, J. Chang and B. B. Zhang, RSC Adv., 2013, 3, 9470–9475 RSC.
- R. Wang and F. Zhang, J. Mater. Chem. B, 2014, 2, 2422–2443 RSC.
- Z. G. Zang, X. F. Zeng, M. Wang, W. Hu, C. R. Liu and X. S. Tang, Sens. Actuators, B, 2017, 252, 1179–1186 CrossRef CAS.
- H. L. Guan, S. Y. Zhao, H. X. Wang, D. D. Yan, M. Wang and Z. G. Zang, Nano Energy, 2020, 67, 104279 CrossRef.
- F. Zhang, Z. F. Shi, Z. Z. Ma, Y. Li, S. Li and D. Wu, Nanoscale, 2018, 10, 20131 RSC.
- A. Kostopoulou, E. Kymakis and E. Stratakis, J. Mater. Chem. A, 2018, 6, 9765–9798 RSC.
- L. J. Su, S. L. Lei, L. Liu, L. Y. Liu, Y. F. Zhang and S. Q. Shi, et al., J. Mater. Chem. A, 2018, 6, 9997 RSC.
- O. Stroyuk, A. Raevskaya, F. Spranger, O. Selyshchev, V. Dzhagan, S. Schulze, D. R. T. Zahn and A. Eychmüller, J. Phys. Chem. C, 2018, 122, 13648–13658 CrossRef CAS.
- P. Galiyeva, H. Alem, H. Rinnert, L. Balan, S. Blanchard, G. Medjahdi, B. Uralbekove and R. Schneider, Inorg. Chem. Front., 2019, 6, 1422–1431 RSC.
- X. H. Lu, Y. J. Zhao, J. J. Zhang, X. Z. Lu, Y. C. Wang and C. H. Liu, Analyst, 2015, 140, 7859 RSC.
- B. Liao, W. Wang, X. T. Deng, B. Q. He, W. N. Zeng, Z. L. Tang and Q. Q. Liu, RSC Adv., 2016, 6, 14465 RSC.
- Y. Q. Chen, Y. Q. Lian, M. N. Huang, L. Wei and L. H. Xiao, Analyst, 2019, 144, 4250–4257 RSC.
- Y. F. Liu, T. Zhu, M. Deng, X. S. Tang, S. Han and A. P. Liu, et al., J. Lumin., 2018, 201, 182–188 CrossRef CAS.
- Y. F. Liu, M. Deng, X. S. Tang, T. Zhu, Z. G. Zang, X. F. Zeng and S. Han, Sens. Actuators, B, 2016, 233, 25–30 CrossRef CAS.
- Y. Hamanaka, T. Ogawa, M. Tsuzuki and T. Kuzuya, J. Phys. Chem. C, 2011, 115, 1786–1792 CrossRef CAS.
Footnotes |
| † Electronic supplementary information (ESI) available. See DOI: 10.1039/c9ra09840b |
| ‡ These authors contribute equally to this work. |
| This journal is © The Royal Society of Chemistry 2020 |

