 Open Access Article
Spectroscopic demonstration of sinapic acid methyl ester complexes with serum albumins†
Adam Kasparek * and
Bogdan Smyk
Department of Physics and Biophysics, University of Warmia and Mazury in Olsztyn, Oczapowskiego 4, 10-719 Olsztyn, Poland. E-mail: adam.kasparek@uwm.edu.pl
First published on 28th February 2020
Abstract
The methyl ester of sinapic acid (MESA) is a molecule with confirmed antioxidant properties. It is important to establish whether it can be transported across humans and animals. Therefore, we investigated MESA interactions with serum albumins, namely, human serum albumin (HSA), bovine serum albumin (BSA), rabbit serum albumin (RSA), and sheep serum albumin (SSA). Experiments were performed in a pH range from 5.9 to 10.7 using absorption and fluorescence techniques. It was found that MESA formed complexes with every albumin in the entire pH range under examination, which was confirmed by the appearances of new absorption and fluorescence complex bands. Fluorescence intensities were much higher (up to 20 times) and lifetimes were up to 340 times as compared to those for unbound MESA. The quenching experiments at pH 7.4 showed that the stoichiometry for every albumin was 1![[thin space (1/6-em)]](https://www.rsc.org/images/entities/char_2009.gif) :
:![[thin space (1/6-em)]](https://www.rsc.org/images/entities/char_2009.gif) 1; the binding constant was the highest for HSA, which reached 52
1; the binding constant was the highest for HSA, which reached 52![[thin space (1/6-em)]](https://www.rsc.org/images/entities/char_2009.gif) 000 M−1. The obtained results suggested that MESA preferred the hydrophobic binding sites in albumins. The analysis of the fluorescence spectra and fluorescence lifetimes showed two possibly different binding sites in BSA, RSA, and SSA as well as three binding sites in HSA.
000 M−1. The obtained results suggested that MESA preferred the hydrophobic binding sites in albumins. The analysis of the fluorescence spectra and fluorescence lifetimes showed two possibly different binding sites in BSA, RSA, and SSA as well as three binding sites in HSA.
Introduction
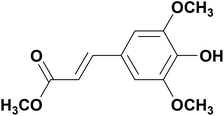
Recently, natural antioxidants have been used to extend the shelf lives of human food and animal feed. Natural candidates comprise compounds having one or more phenolic groups in their molecular structures. These include, among others, sinapic acid (Sa), which is a representative of hydroxycinnamic acids. Hydroxycinnamic acids have many important biological functions including antioxidative, antimicrobial, and cancer-preventing functions.1 Sa is one of the best antioxidants among them.2–5 It occurs in many plants, such as vegetables and cereals (mainly in rapeseed),6–8 which causes it to be consumed by humans as well as animals. In the body, it is absorbed in the small intestine,9 from which it enters the blood plasma and then, it can be transported by forming molecular complexes with albumins.10 In plants, Sa exists in the free form and in the form of esters, including methyl ester (methyl ester of Sa (MESA); Chart 1).MESA is, for example, the main component of a radish methanolic extract.7,11 According to some reports,3,12 MESA has greater antioxidant potential than Sa. The same was confirmed by Gaspar and others,13 who compared the antioxidant abilities of various phenolic acids to their esters. MESA acts as an antioxidant via the dehydrogenation of a hydroxyl group at the ring or by electron transfer.13 Because MESA is a strong antioxidant, there is a chance that in the future, it will be added to food and feed to prevent their spoilage. For this reason, it is likely that it will circulate in the body.14,15 However, until now, there have been no reports on whether MESA can be transported by proteins in the organism. The natural candidates for MESA transport are serum albumins. One of their functions in the body is aiding the transport and distribution of various molecules, including hormones and fatty acids.16–20 In our previous work,21 we determined the physical and chemical properties of MESA in different microenvironments: the pKa values in the ground and excited states (8.6 and 1.9, respectively), fluorescence lifetimes in water as well as polar and nonpolar solvents, and quantum yields (QYs). It was also found that MESA could be dissolved in a wide pH range (from 2 to 11). The main goal of this study was to investigate whether MESA forms molecular complexes with serum albumins or not and whether it can be transported with them or not. This is because in preliminary studies, the fluorescence quantum efficiency was greater in the presence of BSA than that without it, which suggested complex formation. We determined the pH values at which it is the most effective in the case of four albumins, namely, bovine serum albumin (BSA), human serum albumin (HSA), rabbit serum albumin (RSA), and sheep serum albumin (SSA). Another issue is whether MESA can be used as a fluorescent probe for serum albumins or not, particularly at alkaline pH (above 10).
Materials and methods
Materials
Sa, BSA, HSA, RSA, and SSA were purchased from Sigma-Aldrich (Poland). MESA was prepared in the same way as that in an earlier work21 according to the procedure described by Fujita et al.22 Stock solutions of MESA (0.3 mM) and albumins (0.2 mM) were prepared in water from the Millipore Simplicity 185 ultrapure water purification system. The final solutions were obtained by adding 0.5 mL of MESA solution, 0.5 mL of the appropriate albumin solution, and 9 mL of PBS or carbonate buffer at the appropriate pH, resulting in a final concentration of 15 μM of MESA and 10 μM of the corresponding albumin. For quenching experiments, a stock solution of MESA (0.5 mM) and albumin (50 μM) was prepared in a PBS buffer at pH 7.4. Then, albumin was diluted to the final concentration of 5 μM with a buffer and MESA solution. The final MESA concentration was in the range of 2.5–50 μM.Methods
The absorption spectra were measured by means of a Cary 5000 spectrophotometer and the fluorescence spectra by using a Cary Eclipse spectrofluorometer (Agilent, Australia). The emission and excitation slits were set to 10 nm. The measurements were carried out in a 1 cm quartz cuvette using right-angle geometry. A temperature of 298 K was set for both the instruments using the Peltier accessory. The emission spectra were determined at excitation wavelengths, λex, of 375, 390, and 410 nm, and λex = 280 nm was used for the quenching experiment, whereas the excitation spectra were determined at the observation wavelength, λem, of 480 nm. The fluorescence spectra were corrected for the sensitivity of the instrument as well as for the inner filter effects of type I and II according to the procedure described by Kasparek and Smyk.23 The fluorescence lifetimes were measured with a FluoTime 200 spectrophotometer (PicoQuant, Germany) with a TCSPC module and an MCP PMT detector with an electron transit time of 25 ps as well as a FluoTime 300 spectrophotometer (PicoQuant, Germany) with a hybrid PMT detector for an electron transit time of 50 ps. The samples were excited with a 375 nm laser diode (PicoQuant, Germany) and with a 280 nm LED diode (PicoQuant, Germany). The pH value was measured using a Jenway 3030 (United Kingdom) pH meter. The calculations were carried out using the following software: MATLAB v. 2014 (MathWorks, USA), GraphPad Prism 7.05 (GraphPad Software, USA), PeakFit 4.04 (Systat Software Inc., USA), and FluoFit 4.6.6 and EasyTau 2.1 (PicoQuant, Germany).Gaussian decomposition of the fluorescent spectra
The Gaussian decompositions of the fluorescence spectra were performed using the PeakFit software. The MESA spectrum without albumin was subtracted from the fluorescence spectra, and the Savitzky–Golay method was used for smoothing. The “Log Normal Area” peak type for the excitation spectra and the “Gauss Area” for the emission spectra were used. The criterion determining the number of peaks was the minimization of standard deviation (SD) and R2.Reconvolution of exponential decays
Fluorescence decays were analyzed using the FluoFit and EasyTau software. The fluorescence decays were fitted using the sum of the exponential terms:
 | (1) |
Stern–Volmer and FRET analyses
The results obtained from the quenching experiment were fitted to the Stern–Volmer equation:24
 | (2) |
In order to determine the binding constant, Kb, we fitted the obtained results to the following equation:25–27
 | (3) |
In order to calculate the distances between MESA and tryptophan (Trp) in the albumins, the following equation for determining the Förster distance, R0, was used:24
| R0 = 0.211(κ2n−4QYAJ(λ))1/6 | (4) |
 , and εM is the absorption coefficient of MESA. Distance, r, between the Trp and MESA was calculated using the following equation:24
 | (5) |
Results and discussion
Absorption of MESA solutions with proteins
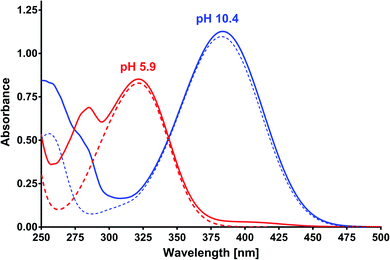
Based on the results of the preliminary research and albumin properties, it was expected that MESA would form complexes with them. In addition, several types of complexes were expected due to the number of potential binding sites for albumin.19,20,28 The absorption of MESA solutions with albumin was measured in the pH range from 5.9 to about 10.9. Fig. 1 shows the exemplary absorption spectra of MESA and SSA solutions. In this figure, the solid lines represent the MESA spectra with the protein and dashed lines without protein. The spectra of the solutions with the highest pH value are marked in blue color and those with the lowest pH value are denoted in red color. Based on the above results, the MESA spectra in the presence of SSA at the extreme pH values were calculated using software29 and are shown in Fig. S1.† The description of the spectra are the same. Both these figures show changes in the MESA absorption spectra after SSA addition, which can be attributed to the absorbance reduction at the maximum of the undissociated form at 322 nm and the appearance of a small band at around 410 nm. In the case of the dissociated form, a bathochromic shift of about 3 nm was observed. These results indicate that in the electronic ground state, MESA forms complexes with the SSA. Similar spectra were obtained for the remaining albumins (Fig. S2†). The pKa value of the OH group in the MESA ground state without proteins was 8.6 ± 0.2.21 The calculated pKa values of the MESA solutions with albumins are listed in Table 1. The observed changes relative to the MESA without proteins were relatively small and were within the limits of the measurement error. However, the pKa value decreased for each albumin, suggesting a weak effect of binding sites on the dissociation of the hydroxyl group of the MESA—there was no significant weakening in protein binding. Therefore, the fraction of the residues of the polypeptide side chain of the polar amino acids involved in the binding was negligible. In addition, while the MESA alone was unstable at higher pH, the addition of albumins significantly increased its stability.| MESA with | pKa ± SD |
|---|---|
| a SD: standard deviation. | |
| HSA | 8.24 ± 0.47 |
| BSA | 8.50 ± 0.61 |
| RSA | 8.48 ± 0.49 |
| SSA | 8.40 ± 0.70 |
Fluorescence of MESA with HSA
For all the pH values of the solutions, the fluorescence decay times were measured and reconvoluted using the “Global Method” for the four observation wavelengths. They are listed in Table 2. The best matches were obtained when using the triple-exponential decay. All the lifetimes of MESA with HSA were many times greater than those of MESA without HSA. This suggests the presence of three different binding sites in HSA, because the protein has no absorption bands for the excitation wavelength of 375 nm and the lifetimes of both the MESA forms were very low, i.e., below 10 ps.
| pH | τ1 [ns] | τ2 [ns] | τ3 [ns] |
|---|---|---|---|
| 5.9 | 2.557 | 0.432 | 0.132 |
| 6.8 | 1.562 | 0.365 | 0.115 |
| 7.3 | 1.362 | 0.353 | 0.111 |
| 7.7 | 1.356 | 0.361 | 0.113 |
| 8.2 | 1.442 | 0.365 | 0.105 |
| 8.7 | 1.600 | 0.382 | 0.101 |
| 9.0 | 1.754 | 0.410 | 0.101 |
| 9.6 | 1.892 | 0.449 | 0.107 |
| 10.1 | 1.919 | 0.453 | 0.106 |
| 10.4 | 1.927 | 0.455 | 0.105 |
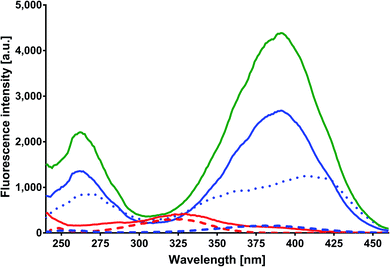
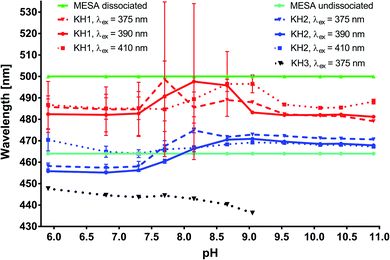
 corresponds to specific lifetimes. The obtained results indicate that the shapes of the fluorescence spectra corresponding to times τ2 and τ3 are the same (Fig. S9†), suggesting that both the lifetimes were associated with the same binding site or two similar binding sites. Fig. S8† shows the fluorescence intensity calculated at the observation wavelength of 480 nm. The solid lines correspond to the intensity of the individual peak obtained from the Gaussian decomposition. The KH1 complex is marked with red line; KH2, blue line; and KH3, black line. The dashed lines indicate the spectral intensities obtained from the multiplication of the fluorescence intensity by factor fi. The blue line represents the added spectra associated with τ2 and τ3. The red line shows the spectrum corresponding to τ1. The shapes of the blue lines are similar to each other. Red lines are also similar. The same analysis was carried out for the remaining three wavelengths for observations in the measurement of lifetimes. In addition, the shape of the fluorescence peaks obtained by means of lifetimes was compared with that of the spectra obtained from the Gaussian decomposition (Fig. S7†). From the analyses shown in Fig. S7–S9,† it may be concluded that τ2 and τ3 represent the same KH2 complex, while τ1 is linked with the KH1 complex. Since both KH1 and KH2 have a blue-shift in relation to the dissociated form of MESA, we can conclude that both the binding sites are hydrophobic pockets. In the case of KB1, the maximum of both fluorescence and excitation spectra did not change with the increase in pH in the range of the measurement error. Simultaneously, there was a significant 120–250-fold increase in τ1 as compared to that of the unbound MESA. Because the KH2 maxima changed more with increasing pH than that for KH1 and because the lifetimes increased less (around 40 times), the binding site of KH1 seems to be more hydrophobic than that of KH2. The binding site of KH1 is probably (Sudlow site I) chosen by anions,20 whereas hydrophobic–hydrophilic site II, occupied by KH2, may be accessed by the solvent molecules. The optional KH2 binding site may be located on the HSA surface. The possibility of binding inside the protein structure is confirmed by the lifetimes, which do not significantly change with increasing pH values.
Fluorescence of MESA with BSA
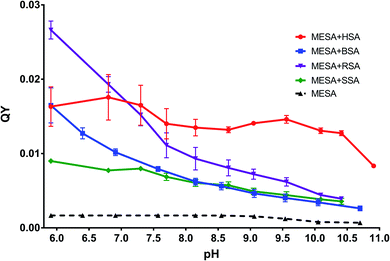
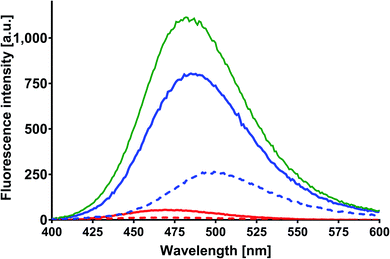
The solutions of MESA with BSA were excited with the same wavelengths as that in the case of HSA. Fig. 6 shows the emission spectra of MESA with and without BSA for λex = 375 nm. Similar to that in the case of HSA, the solid lines denote the MESA spectra with BSA, where the solid blue line indicates the spectrum for the highest pH (10.70) and the solid red line denotes the spectrum for the lowest pH (5.91). The MESA spectra without protein were marked with dashed lines, where red color was used for the lowest and blue color for the highest pH values. The fluorescence intensities of MESA with BSA increased up to pH 9.5 (green color). However, the increase in fluorescence intensity at pH 9.5 with protein relative to that without protein was lower than that for HSA and was about 4.7. Similarly, with HSA, the increase in fluorescence intensity with increasing pH is associated with an increase in the concentration of the dissociated form, which is the main form excited by the wavelength of 375 nm. The maximum fluorescence intensity for pH 5.9 was 469 nm, which increased with the pH (up to 9.5); above this value, the maximum remained constant at 487 nm. A similar case is seen for HSA: the maximum below 500 nm suggests the binding of MESA to the hydrophobic sites of BSA. The same results were obtained for the other excitation wavelengths. In Fig. 4, the dependence of QYs of the MESA solution with BSA on pH is indicated with blue color. The QYs markedly decreased as the pH increased. The highest QY was determined for the lowest pH (5.9), which was equal to 0.0164 ± 0.0024. The lowest QY value of 0.00262 ± 0.00015 was determined for the solution with the highest pH (10.7). When comparing QYs of MESA with and without the protein in the entire pH range under consideration, the QY of MESA with BSA was found to be significantly higher. Below pKa, this increase is about 10-fold, whereas above pKa, it is constant and then decreases to about 3.5. This suggested that MESA can be used as a BSA fluorescent probe. MESA, in contrast to Sa,28 can form complexes with BSA at alkaline pH (at least up to 10.7), and the QY of fluorescence is about twice as high. In order to extract the complex bands, the MESA fluorescence spectra with BSA were decomposed. The peak maxima obtained are shown in Fig. S10.† The KB1 complex, whose maximum is in the range between 482 and 497 nm, is denoted with the red line, while KB2 having the maximum in the range between 466 and 474 nm was denoted with blue line. The solid line indicates the results for λex = 390 nm, dashed line for λex = 410 nm, and dotted line for λex = 375 nm. The fluorescence maximum of the dissociated form of MESA without protein (λmax = 500 nm) is marked with the light green color. The best fit in the entire pH range was obtained for two bands of complexes and not for three as that in the case of HSA. The existence of the third complex band at pH of about 7.0 cannot be ruled out, because the maximum of KB2 for λex = 375 nm (Fig. S10†)—the blue dotted line—exhibited a significant blue-shift. The maximum of KB1 had a smaller blue-shift (from 484 to 497 nm) with increasing pH. The KB2 maximum, initially shifted to 475 nm at pH 6.9, and then practically did not change. The fluorescence decay times were calculated using the global method for the three wavelengths under consideration. The results for all the pH values are shown in Table 3. The best matches were obtained for the triple-exponential decay. All the lifetimes were many times greater than the lifetimes of MESA without BSA. Based on these calculations, τ1 should be associated with the KB1 complex, whereas τ2 and τ3 with the KB2 complex. In contrast to HSA, it cannot be unambiguously determined which of the binding sites are more hydrophobic, as both the maxima and lifetimes were changed with changing pH. However, for KB2, changes in the maximum as well as the lifetime occurred mainly for pH below 7.| pH | τ1 [ns] | τ2 [ns] | τ3 [ns] |
|---|---|---|---|
| 5.9 | 3.408 | 0.636 | 0.127 |
| 6.4 | 2.595 | 0.51 | 0.115 |
| 6.9 | 1.806 | 0.398 | 0.101 |
| 7.6 | 1.273 | 0.319 | 0.0883 |
| 8.2 | 1.271 | 0.335 | 0.0927 |
| 8.6 | 1.268 | 0.333 | 0.0903 |
| 9.1 | 1.33 | 0.378 | 0.1033 |
| 9.5 | 1.337 | 0.397 | 0.108 |
| 10.1 | 1.303 | 0.400 | 0.109 |
| 10.7 | 1.298 | 0.441 | 0.125 |
Therefore, if the third complex existed, then the KB2 binding site should be in the interior of the protein and therefore should be highly hydrophobic.
Fluorescence of MESA with SSA
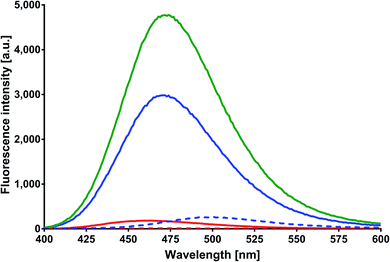
MESA solutions with SSA were excited with the same wavelengths as that used in the previous cases. Fig. 7 shows the emission spectra for λex = 375 nm. The solid lines show the spectra of MESA with SSA solutions, and the dashed lines show those of MESA without albumin. The spectra for the lowest pH (5.9) are marked with red lines and the highest pH (10.4) are marked with blue ones. The fluorescence intensity of MESA solutions with SSA increased with pH values up to pH 9 (green line). Similar to those for HSA and BSA, this increase could be attributed to the fact that λex = 375 nm mainly excited the dissociated form of MESA. The relative increase in the fluorescence intensity of MESA with SSA as compared to MESA was about 5-fold for pH 9.5 and was similar to the increase noted for BSA in the entire pH range. At pH 5.9, the maximum value was 472 nm and this value increased with the pH up to pKa. Above pKa, the maximum was fixed at 483 nm. Again, as those in the case of HSA and BSA, the maximum position suggests that MESA preferred the hydrophobic sites of SSA. For the remaining excitation wavelengths, similar results were obtained. The QYs of the MESA solution with SSA are shown in Fig. 4 in green. Similar to the case of BSA, the QY decreased with increasing pH. The highest QY was noted for pH 5.9, which was 0.0089 ± 0.0002. The lowest value was observed at pH 10.4, which was 0.0035 ± 0.0005. As compared to MESA without albumin, the QY for the lowest pH value was about 5 times higher. This ratio decreases with increasing pH up to pKa, where it is about 3.2. Then, it rises to 5 for the highest pH. Similar to the case of the previously analyzed results, the emission spectra of MESA with SSA were subjected to Gaussian decomposition in order to obtain information on the number of complexes. Fig. S11† shows the peak positions of the individual complexes. The KS1 complex is depicted in red: its maximum value varies from 490 to 506 nm. The KS2 complex is depicted in blue, and its maximum value varies from 471 to 475 nm. The maxima of the dissociated form of MESA are marked with the light green color. The dashed line corresponds to λex = 410 nm; the solid line, λex = 390 nm; and the dotted line, λex = 375 nm. Similar to that in the case of BSA, the best Gaussian fitting in the entire pH range was obtained for two complexes. This does not exclude the existence of the third complex, since its absorption band may lie below λex = 375 nm. However, this is less likely than that in the case of BSA, because the maxima positions for this excitation are consistent with the positions observed for other excitations. The maximum of KS1 increased with the pH. At pH above 9.5, new maxima were separately formed for excitations at 390 and 410 nm. For λex = 375 nm, the maximum was 507 ± 5 nm; for λex = 390 nm, 496 ± 5 nm; and for λex = 410 nm, 493 ± 2 nm. Taking this into account, it cannot be unambiguously determined whether the binding site is hydrophobic at alkaline pH. As discussed earlier, for SSA, the decay times were obtained using the global method for the three observation wavelengths and three lifetimes. The results are shown in Table 4. These lifetimes are many times greater than the MESA lifetimes; therefore, they must be associated with the complexes. The analysis of the results allowed linking τ1 with the binding site KS1, and τ2 and τ3 with binding site KS2. These results support the earlier suggestions that MESA can be used as a fluorescent probe for hydrophobic albumin sites even at alkaline pH, but for excitations above 390 nm. The maximum of KS2 did not significantly change in the entire pH range under consideration and it was about 473 nm. This suggests that the KS2 microenvironment is more hydrophobic than that of KS1.| pH | τ1 [ns] | τ2 [ns] | τ3 [ns] |
|---|---|---|---|
| 5.9 | 3.254 | 0.427 | 0.107 |
| 6.8 | 2.008 | 0.329 | 0.097 |
| 7.3 | 1.828 | 0.323 | 0.096 |
| 7.7 | 1.379 | 0.314 | 0.094 |
| 8.2 | 1.287 | 0.361 | 0.105 |
| 8.7 | 1.350 | 0.412 | 0.120 |
| 9.1 | 1.521 | 0.482 | 0.142 |
| 9.6 | 1.438 | 0.487 | 0.147 |
| 10.1 | 1.419 | 0.524 | 0.158 |
| 10.4 | 1.415 | 0.532 | 0.161 |
On the other hand, the lifetimes associated with KS2 increased by about 50% in the pH range from pKa to pH 10.4; therefore, this hypothesis cannot be confirmed without further research.
Fluorescence of MESA with RSA
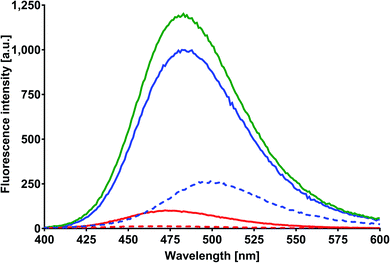
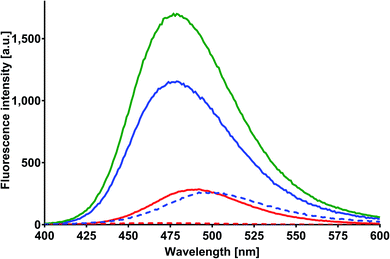
MESA with RSA solutions were excited in the same manner as those done for HSA, BSA, and SSA. Fig. 8 shows the emission spectra of MESA with RSA and without RSA for λex = 375 nm. The MESA spectra with RSA are marked with solid lines and the MESA spectra without albumin are marked with dashed lines. The spectra plotted for the lowest pH (5.9) are depicted in red, and those plotted for the highest pH (10.4) are in blue, whereas the spectrum for the highest intensity is denoted in green. The fluorescence intensity increased as the pH increased to 9 (Fig. 8, green line), after which it started to decrease. This effect is probably related to the increased concentration of the dissociated form of MESA, and it was also observed in solutions with the other proteins. An increase was observed in the fluorescence intensity as compared to the MESA solution without proteins, which was equal to 6.8 at pH 9.6; this was distinctly greater than the increase noted for BSA and SSA and significantly lower than that noted for HSA. Unlike other proteins, the fluorescence maximum of MESA with RSA moved toward the shorter wavelengths as the pH increased to pKa: for pH 5.9, it was 492 nm; above pKa, it oscillated at around 478 nm. These results suggest that in RSA, MESA also preferred the hydrophobic binding sites.The QY of the MESA solution with RSA is shown in Fig. 4 (denoted in violet color). Similar to those for SSA and BSA, the QY of MESA with RSA decreased with increasing pH. For the lowest pH (5.9), it was 0.0261 ± 0.0008; for the highest pH (10.4), it was 0.00035 ± 0.00005. The greatest increase in QY, in relation to MESA solutions without albumin, was 16 times and it was achieved at pH 5.9. Along with the increase in pH to the pKa value, the ratio dropped to 4.8 at pH 8.7. Above pKa, it increased to 5.6 at pH 10.4. These results confirm that MESA can also be used as an RSA fluorescent probe in the pH range from 5.9 to 10.4.
Similar to the spectra of MESA with the other proteins, the fluorescent spectra with RSA were decomposed into Gaussian peaks. The results are shown in Fig. S12.† The KR1 complex is denoted in red, which has its maxima ranging from 487 to 500 nm. The KR2 complex is denoted in blue and its maximum is between 491 and 466 nm. The position of the fluorescence maxima of the dissociated form of MESA is denoted in light green. The solid lines indicate the maxima for λex = 390 nm; dashed lines, 410 nm; and dotted ones, 375 nm. The best matches were obtained for the two-band distribution. If there was a third complex, its emission band should have been observed for excitations below 375 nm. The location of the maximum KR1 remained approximately constant with respect to the pKa value and ranged from 492 to 497 nm; above pKa, it oscillated for various excitations. The induction of relatively large errors caused its location to be indeterminable. The maximum of KR2 did not change till reaching pKa and it was 488 nm. Above pKa, this value shifted toward shorter wavelengths and reached 468 nm at pH 10.4. These results suggest that both the binding sites are not unambiguously hydrophobic.
Fluorescence decay times were also measured for RSA and the results were obtained using the procedure as that used above for λex = 375 nm. The best matches were obtained for the triple-exponential decay. The results are listed in Table 5. The analysis of lifetimes dependence on the pH values shows that above pKa, all the three lifetimes showed similar changes. This suggests that the MESA microenvironments at the KR1 and KR2 binding sites were similar.
| pH | τ1 [ns] | τ2 [ns] | τ3 [ns] |
|---|---|---|---|
| 5.9 | 3.399 | 0.719 | 0.214 |
| 6.8 | 2.751 | 0.683 | 0.195 |
| 7.3 | 2.274 | 0.655 | 0.183 |
| 7.7 | 1.793 | 0.612 | 0.169 |
| 8.2 | 1.465 | 0.566 | 0.159 |
| 8.7 | 1.399 | 0.563 | 0.162 |
| 9.0 | 1.346 | 0.556 | 0.165 |
| 9.6 | 1.421 | 0.612 | 0.182 |
| 10.1 | 1.474 | 0.654 | 0.199 |
| 10.4 | 1.415 | 0.615 | 0.191 |
| 10.9 | 1.919 | 0.731 | 0.218 |
Binding study
In order to obtain the binding constants between the serum albumins and MESA, steady-state fluorescence spectra and time-resolved fluorescence decays of serum albumins were measured at pH 7.4 and λex = 280 nm. The corrected emission spectra of HSA in the presence of MESA (Fig. S13†) show a significant decrease in intensity, which indicated the presence of either dynamic or static quenching. The number of calculated lifetimes was not dependent on the number of Trps in albumin. In HSA, BSA, and SSA, this value was 2; in RSA, it was 3. Table 6 lists the τ0 values computed for the different albumins. The τ and τ0 values were amplitude-weighted lifetimes.24 Their values slightly differed, which suggests that for BSA and SSA, as compared to HSA, two Trps have similar lifetimes; this, in turn, suggests that the microenvironment was similar for both of them. Three lifetimes for RSA suggested the fluorescence of tyrosine (Tyr). Fig. 9 shows the Stern–Volmer plots for HSA: both . Since the X axis and
  are parallel to each other, the observed quenching is static rather than dynamic. Similar plots were obtained for the other albumins. Quenching constants KSV and kq were determined from eqn (2) (R2 > 0.99), as listed in Table 6. Values of kq for each albumin were significantly higher than the reported maximal diffusive quenching constant kq (1.2 × 10¹⁰ M−1).24 This suggests that a complex existed in the ground state, which was confirmed by the absorption spectra (Fig. 1 and S2†).
| Protein | τ0 [ns] | KSV [M−1] | kq × 10−11 [s−1 M−1] | Kb [M−1] | n | R0 [Å] | r [Å] |
|---|---|---|---|---|---|---|---|
| HSA | 6.35 ± 0.14 | 66![[thin space (1/6-em)]](https://www.rsc.org/images/entities/char_2009.gif) 700 ± 2200 700 ± 2200 |
105.0 ± 4.2 | 52![[thin space (1/6-em)]](https://www.rsc.org/images/entities/char_2009.gif) 000+2200−1500 000+2200−1500 |
0.97 ± 0.03 | 23.0 | 24.7 |
| BSA | 5.90 ± 0.10 | 9290 ± 180 | 15.75 ± 0.41 | 1800+1100−700 | 0.84 ± 0.04 | 21.2 | 33.9 |
| SSA | 5.48 ± 0.16 | 29![[thin space (1/6-em)]](https://www.rsc.org/images/entities/char_2009.gif) 280 ± 660 280 ± 660 |
53.4 ± 2.0 | 10![[thin space (1/6-em)]](https://www.rsc.org/images/entities/char_2009.gif) 500+5400−3600 500+5400−3600 |
0.90 ± 0.04 | 22.7 | 30.4 |
| RSA | 3.35 ± 0.17 | 5560 ± 240 | 16.60 ± 1.1 | 1800+1600−800 | 0.89 ± 0.06 | 19.5 | 36.7 |
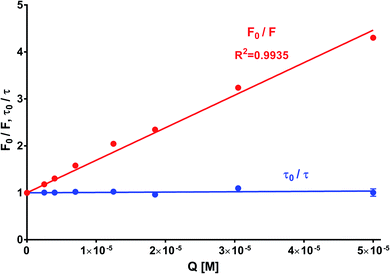 | ||
| Fig. 9 Stern–Volmer plot of HSA with MESA. Concentration of HAS: 5 μM; concentration of MESA: 2.5–50.0 μM; λex = 280 nm; λem = 350 nm; 1 cm quartz cell; right-angle geometry. | ||
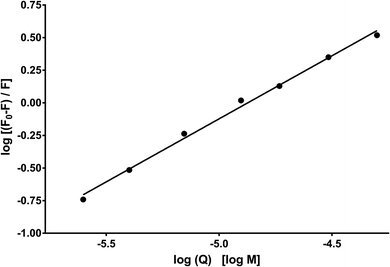
Fig. 10 shows the dependence of log[Q] on  for determining the quenched fluorescence of HSA. The binding constant, Kb, and the number of binding sites, n, determined from eqn (3) (R2 > 0.99) are listed in Table 6. All the obtained Kb values were higher than those for Sa and BSA (Kb = 600 M−1).28 The Kb value for HSA was about 28 times higher than those for BSA and RSA and about 5 times higher for SSA. This is in agreement with the fluorescence results obtained from the spectral analysis. The number of binding sites (n) for all the albumins was below one (Table 6), confirming that there was only one binding site. These results are inconsistent with the results from the spectral decomposition and time-resolved spectroscopy data, which suggested a higher number of binding sites. In order to get an additional insight into the location of the binding pockets in the proteins, the FRET theory was employed to determine the distance between MESA and Trp in the albumins. The Förster distance, R0, was determined using eqn (4) and listed in Table 6. Then, it was used to calculate the distance (r) between Trp in serum albumins and bound MESA (Table 6). For each albumin, r was smaller than 8 nm; for HSA, BSA, and SSA, r < 1.5R0, which proves that resonance energy transfer was possible and could be significant. The r values calculated for HSA reveals that the most probable binding site is Sudlow site I, which is close to the Trp in HSA.25,26 In the case of BSA (with two Trps), it is unclear which binding site is preferred by MESA; however, reports have indicated a similar r value for molecules preferring Sudlow site I.27
Summary
Results obtained for all the tested albumins showed many similarities. MESA formed complexes with all the albumins in the pH range from 5.9 to 11. Complex formation with albumins did not significantly affect pKa, suggesting a small contribution of the MESA hydroxyl group. The complexes had their own absorption and fluorescence bands. The maxima of the fluorescence bands were blue-shifted as compared to those of the unbound MESA, which suggests their hydrophobic nature. In the case of HSA, BSA, and SSA, the fluorescence maxima were red-shifted as the pH increased up to pKa. Above the pKa value, the maxima remained unchanged. The highest intensities were observed in the pH range from 9.0 to 9.5. Also, QY determined for complexes with BSA, SSA, and RSA showed similar increases as compared to the unbound MESA. Large differences were observed in the fluorescence intensity, QYs, and Kb values of the complexes with HSA as compared to those with the other proteins. In turn, the blue-shift of the fluorescence band with the increase in pH up to pKa was observed only for RSA. Some analyses showed that there was a different number of binding sites in different proteins, i.e., three for HSA, two (with a potential third) for BSA, and two for both SSA and RSA. However, the analysis conducted using eqn (3) indicated the existence of only one binding site in all the albumins.It is interesting whether four protein binding sites can be treated as similar or the same, i.e., whether KH1, KB1, KS1, and KR1 complexes could be considered as K1 binding sites. Similarly, whether KH2, KB2, KS2, and KR2 could be considered as K2 binding sites. Unfortunately, the answer is ambiguous. First, complexes with RSA must be excluded from this juxtaposition, which, despite certain similarities, behave differently: although the blue-shift in the KR2 complex maximum occurred with an increase in pH, all the lifetime values changed in the same way above pKa. Differences were also found between the binding sites of the other three proteins. Below pKa, there was a greater blue-shift in the KH2 maxima as compared to MESA than those in KB2 and KS2. The maxima of the complexes vary with changes in the pH value. In BSA and SSA, the KB1 and KS1 maxima would reduce their blue-shifts with increasing pH, while the maxima positions of KB2 and KS2 did not change. An opposite behavior was observed in HSA, namely, the KH2 blue-shift decreased with increasing pH, while the positions of the KH1 maxima did not change.
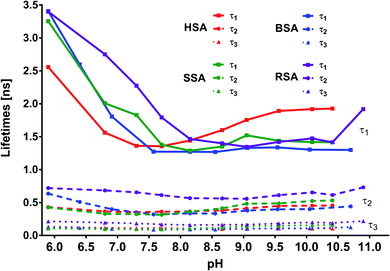
In addition to the abovementioned differences, similarities could also be noticed, particularly for lifetime matches (Fig. 11). First, for complexes with all the tested albumins, the best fit for the decay times was obtained using the triple exponential. Second, for MESA with HSA, BSA, and SSA, the τ1 values ranged from 1.2 to 3.5 ns; τ2, from 0.3 to 0.65 ns; and τ3, from 0.085 to 0.17 ns. However, the differences for individual pH values were significantly smaller (Tables 2–4). Third, there were similarities in the course of the individual values of τ1, τ2, and τ3 at pH values for the different proteins, particularly those above pKa.
Fourth, for complexes with HSA, BSA, and SSA, it could be noticed that τ1 was linked to the KH1, KB1, and KS1 complexes. Analogously, the binding sites of KH2, KB2, and KS2 could be connected to τ2 and τ3. Fifth, the results for both BSA and HSA reveal that MESA prefers Sudlow site I. When analyzing the decomposition of the fluorescence spectra into Gaussian peaks, the similarity of the maxima of the fluorescence bands of the complex associated with the K2 binding sites above pKa can be noticed—they remained constant and ranged from 465 to 475 nm for λex = 390 nm. For complexes related to the K1 binding site, fitting errors prevented a similar analysis.
In summary, it seems reasonable to accept the hypothesis that we are referring to binding sites of the same nature—with similar microenvironments—particularly those above pKa. However, further studies are required to confirm this hypothesis.
Increasing the pH above 7 causes a less rigid structure of albumins,31 e.g., BSA has a very high α-helix content (∼62%) in the N-form, which decreases to ∼44% in the B-form and 2% in the A-form. In the A-form, the structure of BSA developed in the random coil conformation. The obtained data indicate that protein unfolding up to pH 10 did not cause the unbonding of the MESA. Above pH 10, the complex gradually disappeared, which can be caused by the disappearance of the hydrophobic pockets and a high negative net charge on the protein. Such a behavior up to pH 10 indicated the strong affinity of MESA toward the albumins. In contrast, completely dissociated hydroxy and carboxy groups at alkaline pH in the Sa molecule resulted in the fact that no complex was formed with BSA.28
Conclusions
The results obtained from the absorption and fluorescence analyses confirmed the formation of MESA molecular complexes with the studied albumins in the examined pH range from 5.9 to 10.7. Changes in the absorption spectra and pKa values revealed the formation of complexes in the electronic ground state, which resulted in a significant increase in the fluorescence intensity and QY for MESA in the presence of proteins, particularly with HSA. The blue-shift in the fluorescence spectra as compared to unbound MESA suggests that MESA prefers the hydrophobic binding sites. Together with the increase in the fluorescence decay times, this indicated the feasibility of using MESA as a fluorescent probe of hydrophobic binding sites of albumins, particularly at alkaline pH.The Gaussian decomposition of the fluorescence spectra and lifetimes suggests the existence of at least two types of binding sites in all the albumins, in contrast to the single site obtained from the fluorescence quenching experiments. At higher pH, the dissociation of hydrogen from the hydroxyl group of MESA and the high negative net charge on the proteins did not hinder the formation of complexes. Binding constants were calculated for MESA with HSA, BSA, SSA, and RSA, which were 52![[thin space (1/6-em)]](https://www.rsc.org/images/entities/char_2009.gif) 000, 1800, 1050, and 1800 M−1, respectively, and were significantly higher than that in the case of the binding constants computed for Sa and BSA.28 This indicated that blocking the protein dissociation from the carboxyl group increased the binding affinity.
000, 1800, 1050, and 1800 M−1, respectively, and were significantly higher than that in the case of the binding constants computed for Sa and BSA.28 This indicated that blocking the protein dissociation from the carboxyl group increased the binding affinity.
Conflicts of interest
There are no conflicts to declare.Acknowledgements
Project financially supported by Minister of Science and Higher Education in the range of the program entitled “Regional Initiative of Excellence” for the years 2019–2022, Project No. 010/RID/2018/19, amount of funding 12![[thin space (1/6-em)]](https://www.rsc.org/images/entities/char_2009.gif) 000
000![[thin space (1/6-em)]](https://www.rsc.org/images/entities/char_2009.gif) 000 PLN. We would also like to acknowledge the support from the project No. 17.610.011-110.
000 PLN. We would also like to acknowledge the support from the project No. 17.610.011-110.
Notes and references
- Y. Takaya, Y. Kondo, T. Furukawa and M. Niwa, J. Agric. Food Chem., 2004, 51, 8061–8066 CrossRef PubMed.
- Y. Chen, H. Xiao, J. Zheng and G. Liang, PLoS One, 2015, 10(3), e0121276 CrossRef PubMed.
- M. Foti, C. Daquino and C. Geraci, J. Org. Chem., 2004, 69, 2309–2314 CrossRef CAS PubMed.
- O. Koroleva, A. Torkova, I. Nikolaev, E. Khrameeva, T. Fedorova, M. Tsentalovich and R. Amarowicz, Int. J. Mol. Sci., 2014, 15, 16351–16380 CrossRef PubMed.
- J. Teixeira, A. Gaspar, E. M. Garrido, J. Garrido and F. Borges, BioMed Res. Int., 2013, 2013, 251754 Search PubMed.
- C. Manach, A. Scalbert, C. Morand, C. Rémésy and L. Jimenez, Am. J. Clin. Nutr., 2004, 79, 727–747 CrossRef CAS PubMed.
- N. Niciforovic and H. Abramovic, Compr. Rev. Food Sci. Food Saf., 2013, 13, 34–51 CrossRef.
- A. Siger, J. Czubinski, K. Dwiecki, P. Kachlicki and M. Nogala-Kalucka, Eur. J. Lipid Sci. Technol., 2013, 115, 1130–1138 CAS.
- S. M. Kern, R. N. Bennett, P. W. Needs, F. A. Mellon, P. A. Kroon and M.-T. Garcia-Conesa, J. Agric. Food Chem., 2003, 51, 7884–7891 CrossRef CAS PubMed.
- B. A. Acosta-Estrada, J. A. Gutiérrez-Uribe and S. O. Serna-Saldívar, Food Chem., 2014, 152, 46–55 CrossRef CAS PubMed.
- L. Trnkova, I. Bousova, V. Kubicek and J. Drsata, Nat. Sci., 2010, 2, 563–570 CAS.
- S.-K. Chung, T. Osawa and S. Kawakishi, Biosci., Biotechnol., Biochem., 1997, 61, 118–123 CrossRef CAS.
- A. Gaspar, M. Martins, P. Silva, E. M. Garrid, J. Garrido, O. Firuzi, R. Miri, L. Saso and F. Borges, J. Agric. Food Chem., 2010, 58, 11273–11280 CrossRef CAS PubMed.
- S. M. Kern, R. N. Bennett, F. A. Mellon, P. A. Kroon and M.-T. Garcia-Conesa, J. Agric. Food Chem., 2003, 51, 6050–6055 CrossRef CAS PubMed.
- C. Chen, Oxid. Med. Cell. Longevity, 2016, 2016, 3571614 Search PubMed.
- X.-L. Jin, X. Wei, F.-M. Qi, S.-S. Yu, B. Zhou and S. Bai, Org. Biomol. Chem., 2012, 10, 3424–3431 RSC.
- J. Fan, X. Chen, Y. Wang, C. Fan and Z. Shang, J. Zhejiang Univ., Sci., B, 2006, 7, 452–458 CrossRef CAS PubMed.
- A. Papadopoulou, R. J. Green and R. A. Frazier, J. Agric. Food Chem., 2005, 53, 158–163 CrossRef CAS PubMed.
- Y. Zhang, S. Wu, Y. Qin, J. Liu, J. Liu, Q. Wang, F. Ren and H. Zhang, Food Chem., 2018, 240, 1072–1080 CrossRef CAS PubMed.
- D. C. Carter and J. X. Ho, Adv. Protein Chem., 1994, 45, 153–203 CrossRef CAS PubMed.
- B. Smyk, G. Mędza, A. Kasparek, M. Pyrka, I. Gryczynski and M. Maciejczyk, J. Phys. Chem. B, 2017, 121, 7299–7310 CrossRef CAS PubMed.
- M. Fujita, M. Yamada, S. Nakajima, K. Kawai and M. Nagai, Chem. Pharm. Bull., 1984, 32, 2622–2627 CrossRef CAS PubMed.
- A. Kasparek and B. Smyk, Spectrochim. Acta, Part A, 2018, 198, 297–303 CrossRef CAS PubMed.
- J. R. Lakowicz, Principles of Fluorescence Spectroscopy, Springer, Singapore, 3rd edn, 2009 Search PubMed.
- S. Ranjbar, Y. Shokoohinia, S. Ghobadi, N. Bijari, S. Gholamzadeh, N. Moradi, M. R. Ashrafi-Kooshk, A. Aghaei and R. Khodarahmi, Sci. World J., 2013, 2013, 305081 Search PubMed.
- R. Joshi, M. Jadhao, H. Kumar and S. K. Ghosh, Bioorg. Chem., 2017, 75, 332–346 CrossRef CAS PubMed.
- H.-x. Zhang, Y. Zhou and E. Liu, Spectrochim. Acta, Part A, 2012, 92, 283–288 CrossRef CAS PubMed.
- B. Smyk, J. Fluoresc., 2003, 13, 349–356 CrossRef CAS.
- Z. Wieczorek, J. Stepinski, M. Jankowska and H. Lönneberg, J. Photochem. Photobiol., B, 1995, 28, 57–63 CrossRef CAS.
- N. Fogh-Andersen, P. J. Bjerrum and O. Siggaard-Andersen, Clin. Chem., 1993, 39, 48–52 CrossRef CAS.
- N. Varga, V. Hornok, D. Sebök and I. Dékány, Int. J. Biol. Macromol., 2016, 88, 51–58 CrossRef CAS PubMed.
Footnote |
| † Electronic supplementary information (ESI) available. See DOI: 10.1039/c9ra09980h |
| This journal is © The Royal Society of Chemistry 2020 |

